Archive for Forex and Currency News – Page 206

US Dollar & Precious Metals: How Do They Relate? Video

By TheTechnicalTraders 

Chris Joins Tom Bodrovics from Palisades Radio to discuss the recent moves in the markets and why money has resumed the move into equities. A new rally in equities could spill over to precious metals, thus putting pressure onto the US dollar.

Currently, the dollar is trading at the critical $94 level and, should it collapse, this could also serve to drive precious metal prices higher. Precious metals, such as gold, are pushing against the US Dollar, and we’re starting to see a momentum shift in GDXJ. On the flip side, miners like GDX and SILJ rely on energy prices remaining steady to stay profitable. Thus, as energy prices increase, the pressure is put on metals.

To Learn More click on the Video link Below

GET YOUR DAILY DOSE OF CHRIS’ PRECIOUS METALS ANALYSIS ALONG WITH THE HOTTEST ETFS TO TRADE WITH BAN TRADER PRO NOW PART OF THE TOTAL ETF PORTFOLIO!

TheTechnicalTraders.com

USDCHF Bearish Triple Zigzag Completion Coming Up!

By Orbex

The current USDCHF structure shows that the pair completed the actionary wave y of a cycle degree. This was followed by a cycle intervening wave x.

Judging by the structure, wave x takes the form of a bearish triple zigzag Ⓦ-Ⓧ-Ⓨ-Ⓧ-Ⓩ. At the time of writing, this construction is more than halfway through its completion.

Currently, bears are structuring an actionary wave Ⓩ. We can see the completion of the wave Ⓩ near the 0.893 area. At that level, cycle wave x will be at 100% along the Fibonacci lines of wave y.

After reaching this mark, the price could start an upward movement in the wave z above the maximum of 0.936.

USDCHF

Let’s look at the alternative scenario that hints at a price increase. According to this, the formation of the cycle intervening wave x is fully completed. It also has the form of a triple zigzag of the primary degree.

Thus, we can make an assumption that in the last section of the chart we can see the initial part of the bullish actionary wave z of the cycle degree.

Most likely, with wave z, prices will rise above the previous maximum of 0.937, near 0.951. At that level, actionary cycle waves y and z will be equal.


Orbex-LogoArticle by Orbex

Orbex is a fully licensed broker that was established in 2011. Founded with a mission to serve its traders responsibly and provides traders with access to the world’s largest and most liquid financial markets. www.orbex.com

Ichimoku Cloud Analysis 10.11.2021 (GBPUSD, AUDUSD, USDCHF)

Article By RoboForex.com

GBPUSD, “Great Britain Pound vs US Dollar”

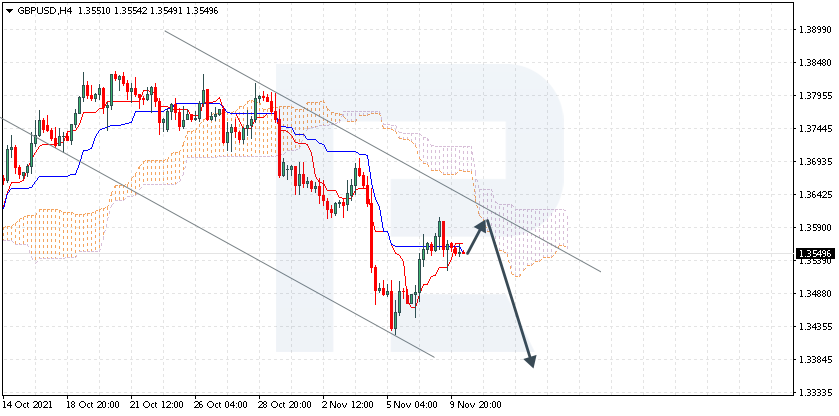
The currency pair is trading at 1.3549 under the Ichimoku Cloud, suggesting a downtrend. A test of the lower border of the Cloud at 1.3590 is expected, followed by falling to 1.3375. An additional signal confirming the decline might become a bounce off the upper border of the descending channel. The scenario can be canceled by a breakaway of the upper border of the Cloud and securing above 1.3685, which will mean further growth to 1.3775.

GBPUSD
Risk Warning: the result of previous trading operations do not guarantee the same results in the future

AUDUSD, “Australian Dollar vs US Dollar”

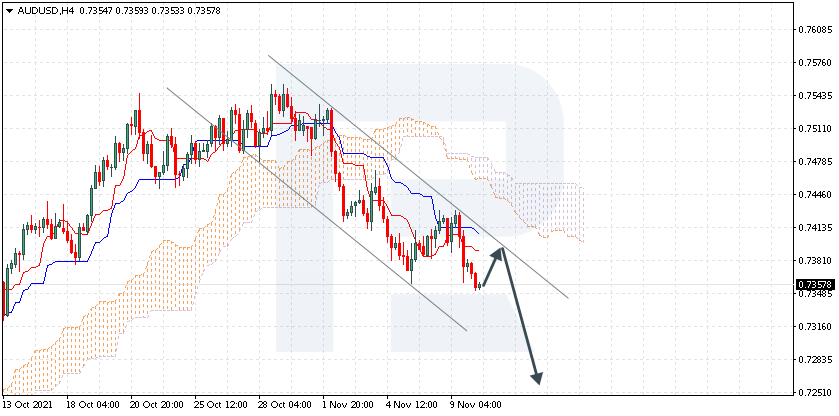
Gold is trading at 0.7357 under the Ichimoku Cloud, suggesting a downtrend. A test of the signal lines of the indicator at 0.7390 is expected, followed by falling to 0.7255. An additional signal confirming the decline might become a bounce off the upper border of the descending channel. The scenario can be canceled by a breakaway of the upper border of the Cloud and securing above 0.7495, which will entail further growth to 0.7585.

AUDUSD
Risk Warning: the result of previous trading operations do not guarantee the same results in the future

USDCHF, “US Dollar vs Swiss Franc”

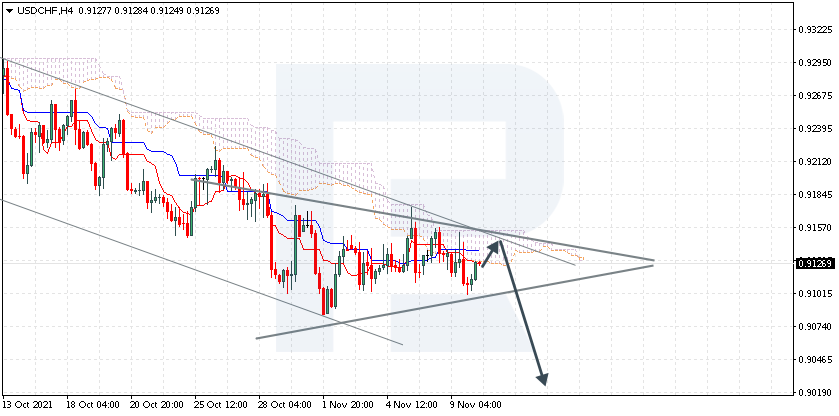
The pair is trading at 0.9126 under the Ichimoku Cloud, suggesting a downtrend. A test of the upper border of the Cloud at 0.9145 is expected, followed by falling to 0.9020. An additional signal confirming the growth will be a bounce off the upper border of the descending channel. The scenario can be canceled by a breakaway of the upper border of the Cloud and securing above 0.9185, which will entail further growth to 0.9275. The decline will be confirmed by a breakaway of the lower border of the Triangle pattern and securing under 0.9075.

USDCHF

Article By RoboForex.com

Attention!
Forecasts presented in this section only reflect the author’s private opinion and should not be considered as guidance for trading. RoboForex LP bears no responsibility for trading results based on trading recommendations described in these analytical reviews.

Japanese Candlestick Analysis 10.11.2021 (USDCAD, AUDUSD, USDCHF)

Article By RoboForex.com

USDCAD, “US Dollar vs Canadian Dollar”

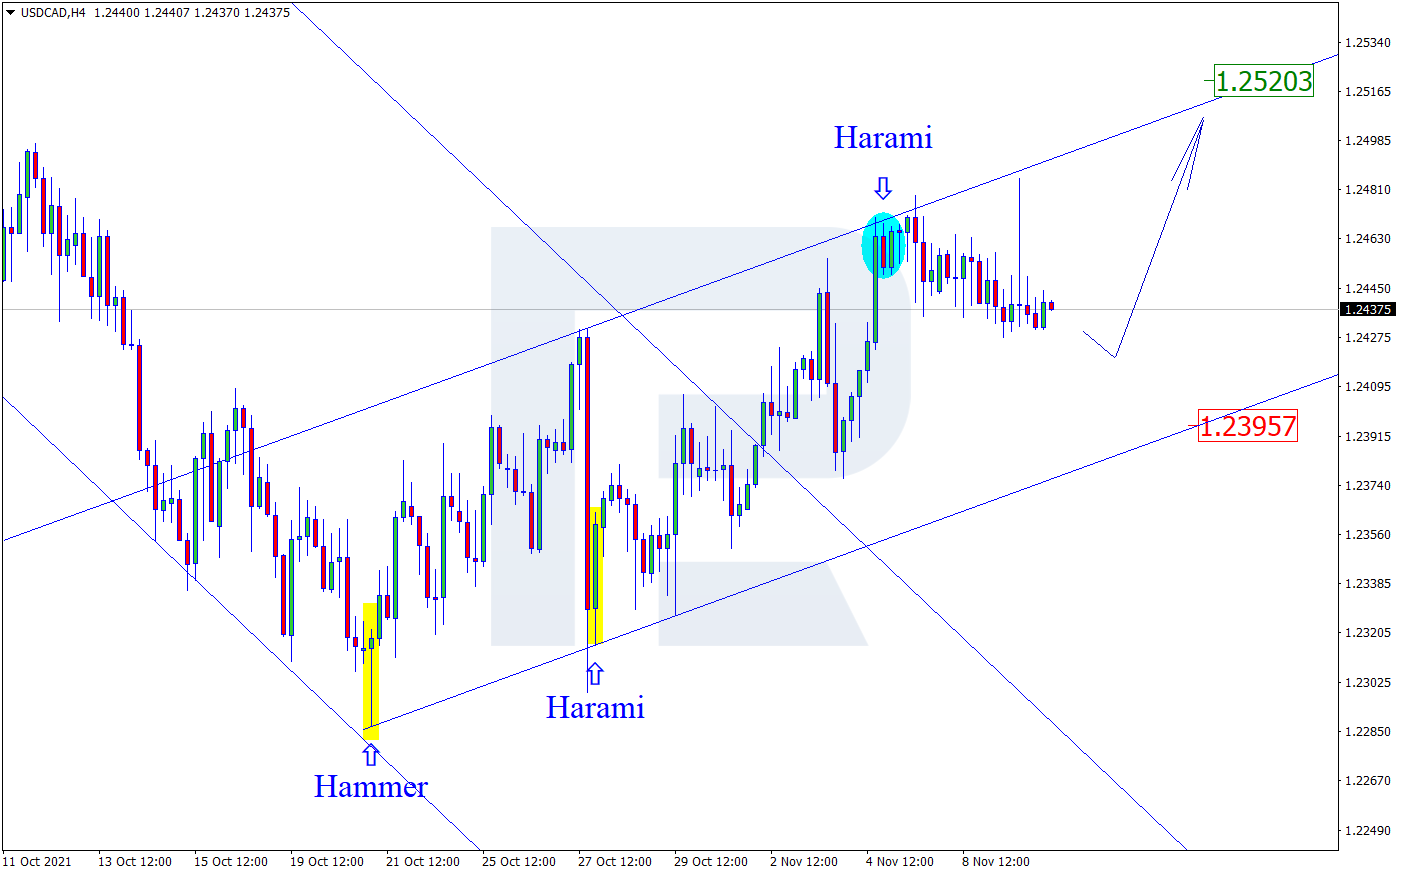
On H4, at the resistance level, the quotations formed several reversal patterns, including a Harami. The pair is currently going by the signal. The aim of the decline is the support level of 1.2395. However, the quotations can still grow to 1.2520 without a test of the support level.

USDCAD
Risk Warning: the result of previous trading operations do not guarantee the same results in the future

AUDUSD, “Australian Dollar vs US Dollar”

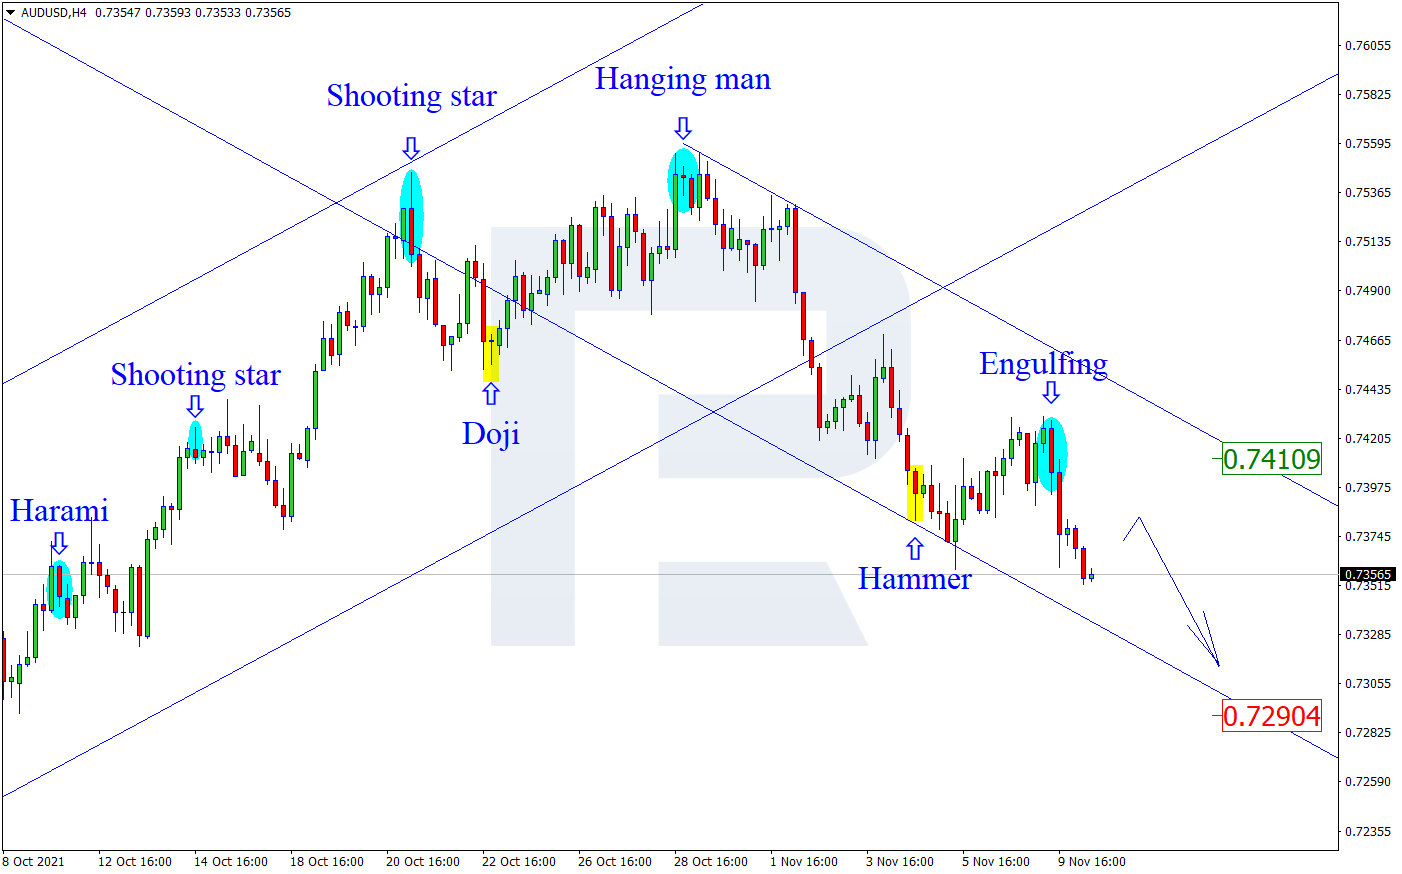
On H4, at a pullback near the resistance level, the pair has formed an Engulfing reversal pattern. Going by the reversal signal, the pair will be falling. The pair is the support level of 0.7290. However, the quotations can still grow to 0.7410before continuing the downtrend.

AUDUSD
Risk Warning: the result of previous trading operations do not guarantee the same results in the future

USDCHF, “US Dollar vs Swiss Franc”

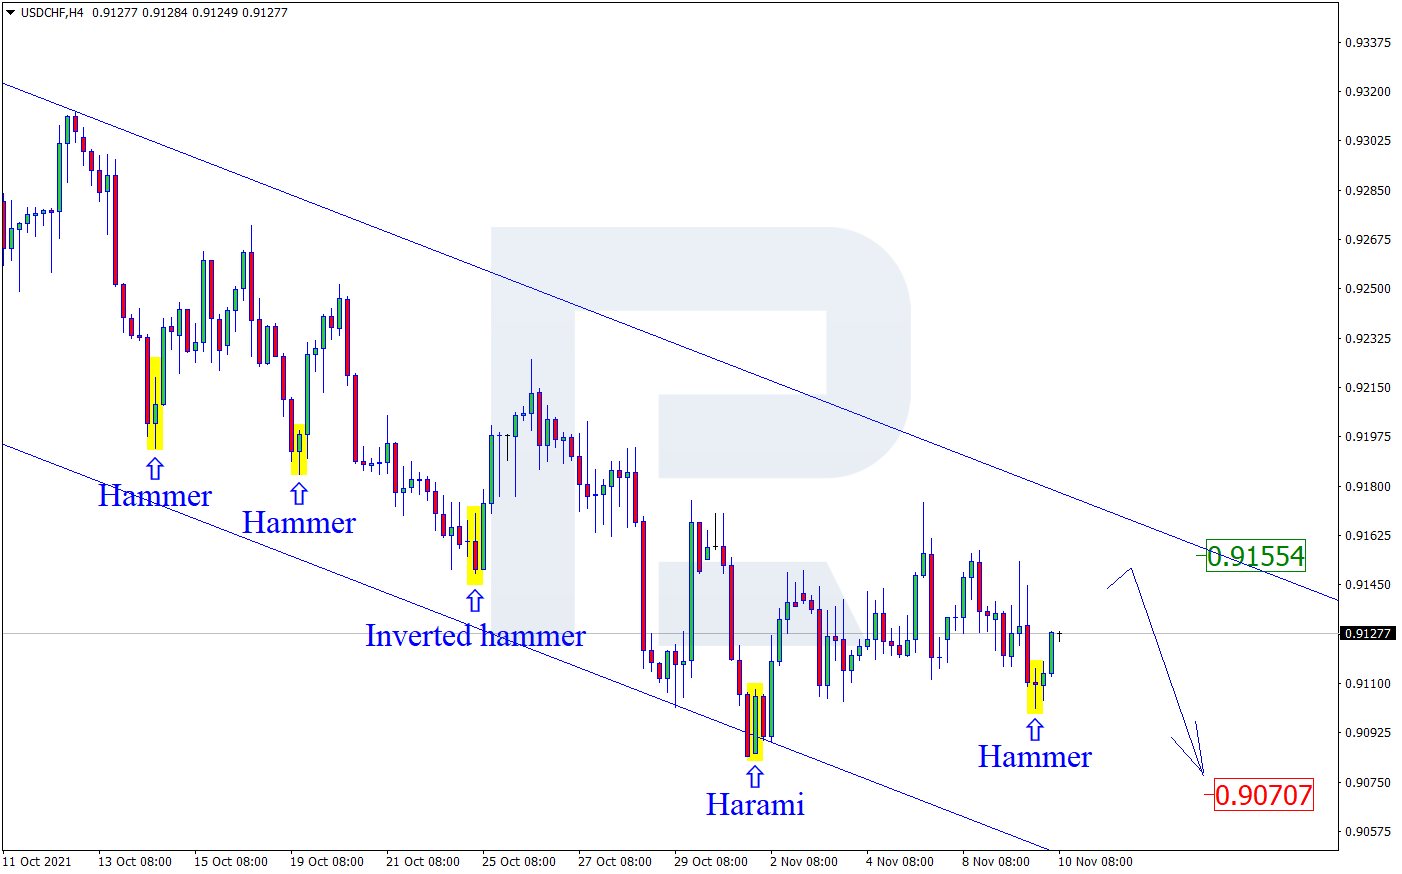
On H4, the pair tested the support level and formed several reversal patterns, including a Hammer. The pair is currently going by the signal, forming a correctional wave to the resistance level. The aim is 0.9175. However, the pair can continue the decline to 0.9070 without testing the resistance level.

USDCHF

Article By RoboForex.com

Attention!
Forecasts presented in this section only reflect the author’s private opinion and should not be considered as guidance for trading. RoboForex LP bears no responsibility for trading results based on trading recommendations described in these analytical reviews.

The Analytical Overview of the Main Currency Pairs on 2021.11.10

by JustForex

The EUR/USD currency pair

Technical indicators of the currency pair:
  • Prev Open: 1.1585
  • Prev Close: 1.1594
  • % chg. over the last day: +0.08%

The ECB balance continues to grow rapidly. Total assets increased by another €16.6 billion to a new level of €8,382.7 billion. The ECB will continue to print money as part of its stimulus program until the end of the year. The index of economic sentiment in Germany and the Eurozone is rising again. Experts forecast the resumption of economic growth and lower inflation in both Germany and the eurozone in the first quarter of 2022.

Trading recommendations
  • Support levels: 1.1573, 1.1535, 1.1502, 1.1453
  • Resistance levels: 1.1613, 1.1645, 1.1667, 1.1717, 1.1772

From the technical point of view, the EUR/USD on the hour time frame is bearish. The MACD indicator has become inactive. Under such market conditions, traders should consider sell positions from the resistance levels near the moving average. There is no optimal entry point for buy trades at the moment.

Alternative scenario: if the price breaks out through the 1.1667 resistance level and fixes above, the mid-term uptrend will likely resume.

EUR/USD
News feed for 2021.11.10:
  • – German Consumer Price Index (m/m) at 09:00 (GMT+2);
  • – US Consumer Price Index (m/m) at 15:30 (GMT+2);
  • – US Initial Jobless Claims (w/w) at 15:30 (GMT+2).

The GBP/USD currency pair

Technical indicators of the currency pair:
  • Prev Open: 1.3561
  • Prev Close: 1.3556
  • % chg. over the last day: -0.04%

According to the Institute for Economic and Social Research (NIESR), the UK consumer price index will peak at around 5% in Q2 2022. UK GDP will grow by 4.7% in 2022 and 6.9% in 2021.

Trading recommendations
  • Support levels: 1.3508, 1.3360
  • Resistance levels: 1.3616, 1.3685, 1.3748, 1.3780, 1.3831, 1.3886

On the hourly time frame, the trend on GBP/USD is bearish. The MACD indicator has become inactive. It is best to look for sell deals from the resistance levels around the moving average. There is no optimal entry point for buy trades at the moment.

Alternative scenario: if the price breaks out through the 1.3685 resistance level and consolidates above, the bullish scenario will likely resume.

GBP/USD
News feed for 2021.11.10:
  • – US Consumer Price Index (m/m) at 15:30 (GMT+2).

The USD/JPY currency pair

Technical indicators of the currency pair:
  • Prev Open: 113.21
  • Prev Close: 112.87
  • % chg. over the last day: -0.30%

At the moment there are no fundamental reasons for the USDJPY quotes to go down in the mid-term, as the Bank of Japan has kept its monetary policy soft until the end of the year, while the Fed is already cutting QE. Moreover, if the US consumer price index is high today, it will lead to a rise in the dollar index and USDJPY quotes.

Trading recommendations
  • Support levels: 112.30, 111.53, 110.99, 110.65
  • Resistance levels: 113.42, 114.48, 115.15

The global trend on the USD/JPY currency pair is bullish. But the local trend is strictly bearish at the moment. Under such market conditions, it’s better to look for buy positions from the buyers’ initiative zone on the higher timeframes. Sell positions should be considered from the resistance levels, given there is sellers’ initiative.

Alternative scenario: if the price falls below 112.30, the uptrend will likely be broken.

USD/JPY
News feed for 2021.11.10:
  • – US Consumer Price Index (m/m) at 15:30 (GMT+2).

The USD/CAD currency pair

Technical indicators of the currency pair:
  • Prev Open: 1.2441
  • Prev Close: 1.2436
  • % chg. over the last day: -0.04%

The Canadian dollar is a commodity currency, so the USD/CAD currency pair highly depend on the dynamics of the dollar index and oil prices. Both the dollar index and oil prices increased yesterday. As a result, the USD/CAD currency pair is trading flat. Fundamentally, the Canadian dollar is tending to strengthen now as oil prices are rising and the Canadian central bank has begun to cut its stimulus program. On the other hand, a rise in the dollar index may eliminate these factors.

Trading recommendations
  • Support levels: 1.2428, 1.2352, 1.2306, 1.2260
  • Resistance levels: 1.2518, 1.2565, 1.2628, 1.2729, 1.2774

From the technical point of view, the USD/CAD currency trend has changed to bullish. The price broke through the priority change level and consolidated above. The MACD indicator has become inactive, and there are no signs of reversal. Under such market conditions, it is better to look for buy trades from the support levels, given there is the buyers’ initiative. Sell deals should be considered from the resistance levels of the higher time frame.

Alternative scenario: if the price breaks down through the 1.2351 support level and fixes below, the downtrend will likely resume.

USD/CAD
News feed for 2021.11.10:
  • – Canada BoC Gov Macklem’s Speech at 00:45 (GMT+2);
  • – US Consumer Price Index (m/m) at 15:30 (GMT+2);
  • – US Crude Oil Reserves (w/w) at 17:30 (GMT+2).

by JustForex


This article reflects a personal opinion and should not be interpreted as an investment advice, and/or offer, and/or a persistent request for carrying out financial transactions, and/or a guarantee, and/or a forecast of future events.


Investors are waiting for key data on inflation in the US today

by JustForex

The US stock markets closed in the red zone yesterday, breaking the longest (8 consecutive sessions) series of records since 1997. By the end of the day, the Dow Jones Industrial Average decreased by 0.31%, the S&P 500 fell by 0.35%, and the Nasdaq lost 0.6%. Macroeconomic data released on Tuesday showed a slight increase in the pace of producer price inflation in October to 0.6% from 0.5% in September. In annual terms, the US producer inflation is rising at a record pace. The US inflation data will be released today. Experts believe US inflation will rise slightly. But if the actual value is much worse than expected, the dollar index may react sharply as the Fed is ready to speed up the pace of stimulus cuts if necessary.

European stock indexes also decreased on Tuesday. The British FTSE 100 fell by 0.36%, the German DAX lost 0.04%, the French CAC 40 decreased by 0.06%, the Italian FTSE MIB lost 0.97%. The exception was the Spanish IBEX 35, which increased by 0.05%. The ECB balance sheet continues to grow rapidly. Total assets rose by another €16.6 billion to a new level of €8,382.7 billion. The ECB will continue to print money as part of its stimulus program until the end of the year. German exports fell by 0.7% in September compared to August, according to data from the country’s Federal Statistics. But the index of economic sentiment in Germany and the Eurozone is growing again. Experts forecast renewed economic growth and lower inflation in both Germany and the Eurozone in the first quarter of 2022. Germany will release its inflation report today.

The drug regulator in the EU will soon approve Regeneron-Roche drugs against COVID-19.

The European Union decided to partially suspend the visa facilitation agreement between the EU and Belarus due to the influx of migrants.

Yesterday, oil prices grew amid American Petroleum Institute (API) data on energy reserves in the US, which showed an unexpected decline of oil reserves in the US last week. Today, the US Department of Energy will release an official report on US crude oil and natural gas inventories. Usually, natural gas inventories are released on Thursdays, but tomorrow is a bank holiday in the US. So, the report will be published today.

The price of gold is trading near a two-month high due to declining US bond yields. Investors are waiting for key US inflation data today. Rising inflation could cause the US dollar to strengthen on the expectation that the US Federal Reserve will accelerate the pace of QE cuts. A rise in the dollar index will lead to higher government bond yields and lower gold prices.

China’s consumer inflation accelerated in October to its highest in 13 months since September 2020. The inflation rate reached 1.5% in annual terms. Experts predicted inflation at 1.4%. At the same time, China’s producer price index jumped to 13.5% in annual terms amid rising prices for coal and other raw materials used by power plants. That has been the highest level since 1996. Asia-Pacific stock markets are decreasing on inflation data in China. Japan’s Nikkei 225 index decreased by 0.61%, Hong Kong’s Hang Seng decreased by 0.98%, Shanghai’s Shanghai Composite lost 0.94%, and Australia’s ASX 200 decreased by 0.14%.

Main market quotes:

S&P 500 (F) 4,685.30 −16.40 (−0.35%)

Dow Jones 36,320.04 −112.18 (−0.31%)

DAX 16,040.47 −6.05 (−0.04%)

FTSE 100 7,274.04 −26.36 (−0.36%)

USD Index 93.98 −0.07 (−0.08%)

Important events for today:
  • – Canada BoC Gov Macklem’s Speech at 00:45 (GMT+2);
  • – China Consumer Price Index (q/q) at 03:30 (GMT+2);
  • – China Producer Price Index (q/q) at 03:30 (GMT+2);
  • – German Consumer Price Index (m/m) at 09:00 (GMT+2);
  • – US Consumer Price Index (m/m) at 15:30 (GMT+2);
  • – US Initial Jobless Claims (w/w) at 15:30 (GMT+2);
  • – US Crude Oil Reserves (w/w) at 17:30 (GMT+2);
  • – US Natural Gas Storage (w/w) at 19:00 (GMT+2).

by JustForex


This article reflects a personal opinion and should not be interpreted as an investment advice, and/or offer, and/or a persistent request for carrying out financial transactions, and/or a guarantee, and/or a forecast of future events.

Intraday Market Analysis – Euro Attempts To Bounce

By Orbex

EURUSD meets resistance

EURUSD

The euro finds support from an upbeat economic sentiment from across the block. The pair has met buying interest in the demand zone around 1.1520.

A bullish RSI divergence suggests that sellers may have taken their feet off the pedal. Subsequently, a break above 1.1560 prompted the short side to cover.

1.1615 is a key supply zone from last week’s sell-off, after which the bulls need to lift offers near 1.1690 before a reversal could gain traction. On the downside, a fall below 1.1550 may call the rebound into question.

XAGUSD awaits breakout

XAGUSD

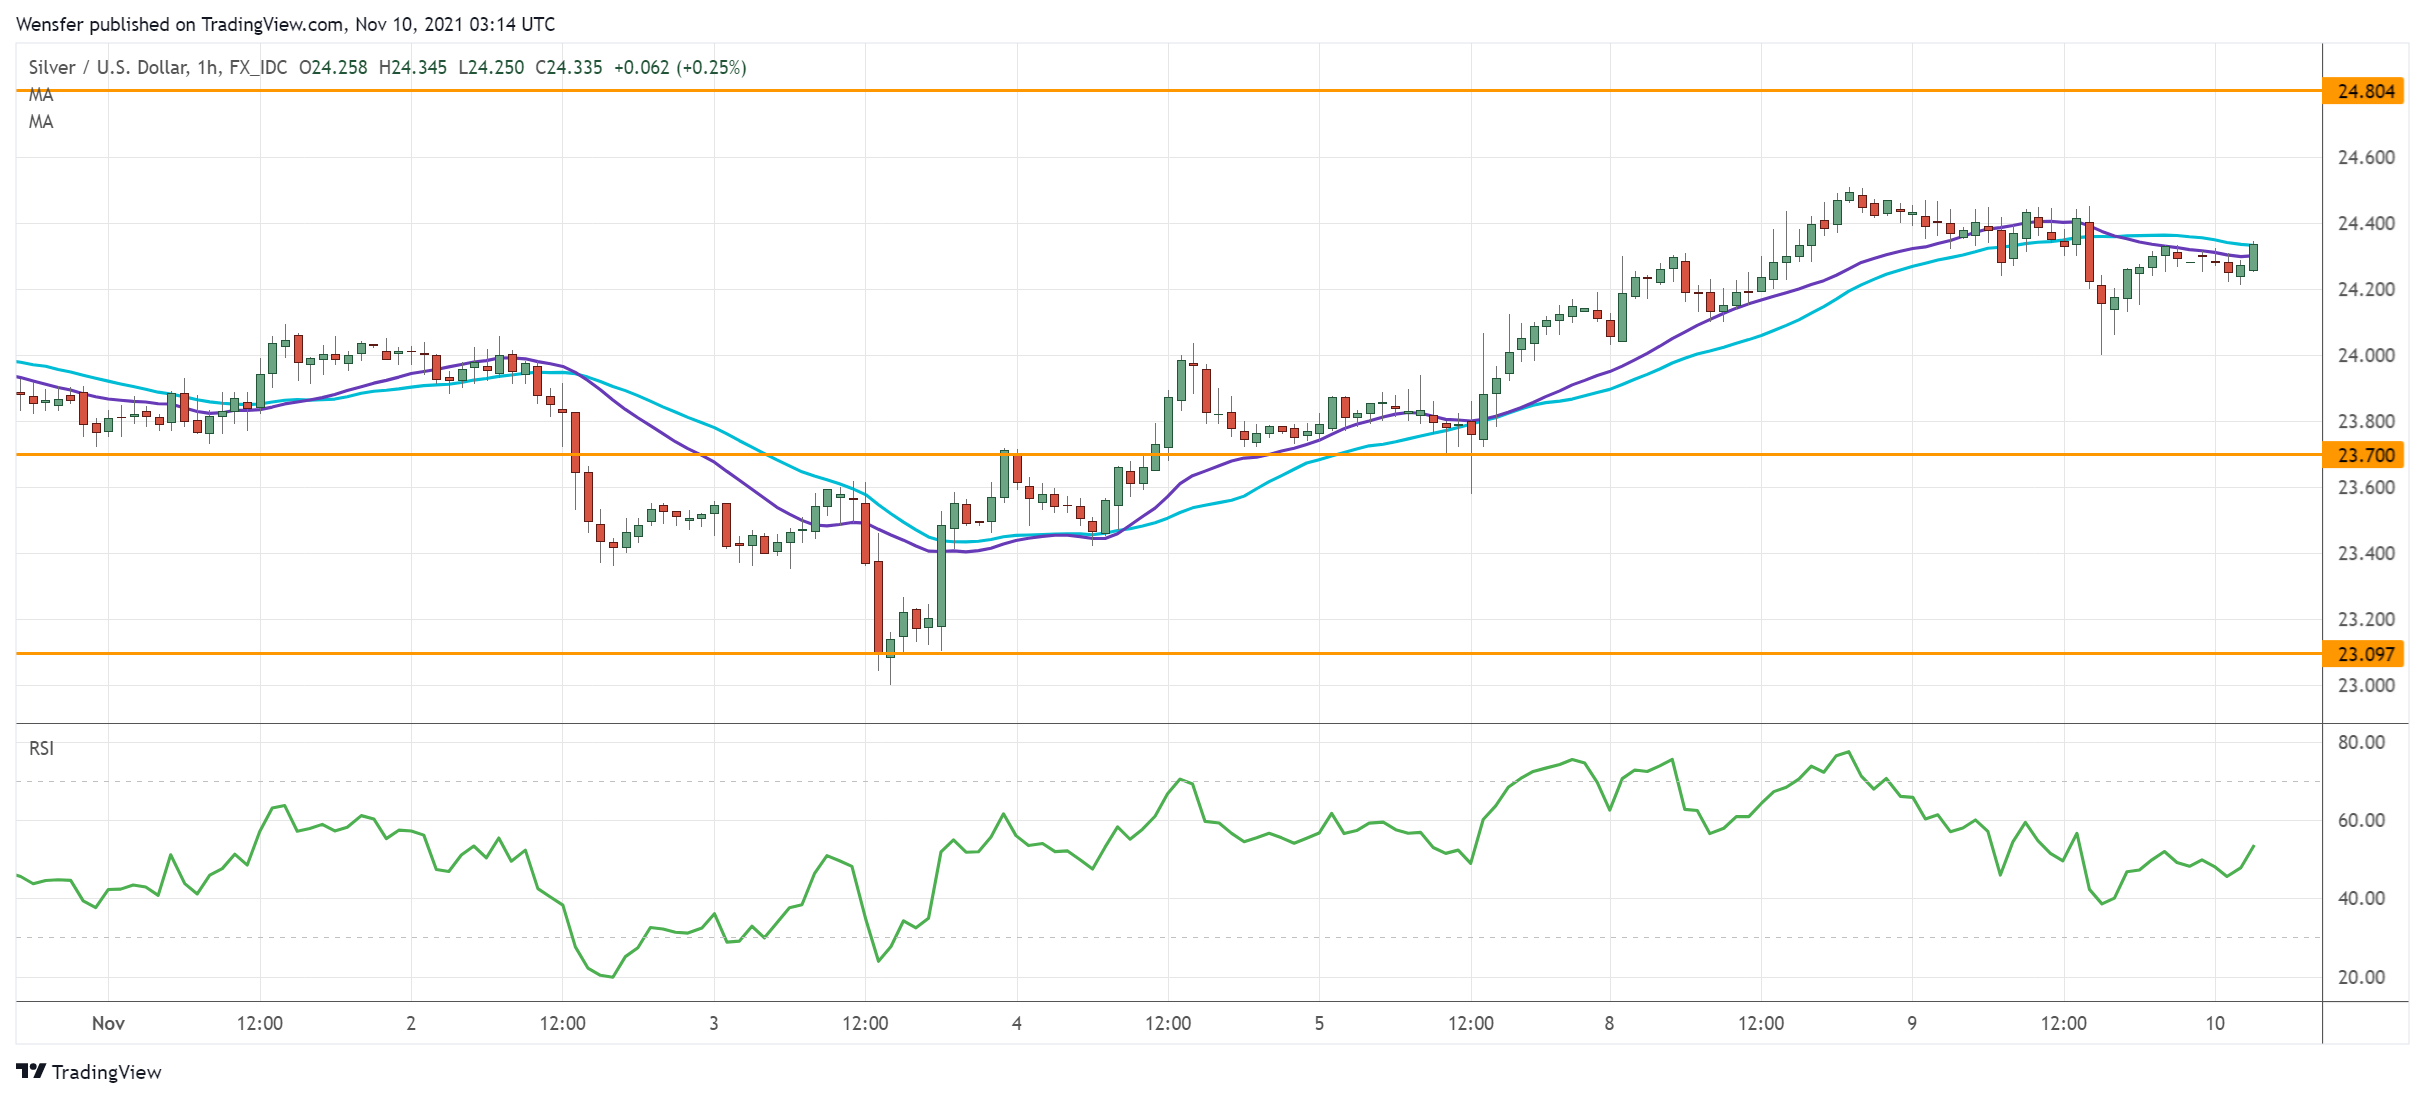
Bullions rise as the US dollar retreats ahead of the release of inflation data. A bullish MA cross on the daily chart is a sign that sentiment could be turning around.

Silver is testing the September high of 24.80. A bullish breakout would trigger an extended rally towards 26.00. However, the RSI’s double top in the overbought area has held buyers back as the market awaits new catalysts.

A combination of profit-taking and fresh selling could drive the price lower. The base of a previous breakout at 23.70 would be a support.

US 500 seeks support

US500

The S&P 500 consolidates gains over strong corporate earnings and improved economic outlook.

The divergence between the 20 and 30-day moving averages indicates an acceleration in the rally. Though there is a chance of a pullback after the RSI shot into the overbought area. The bullish bias means that buyers may be eager to jump in during a correction.

The index is hovering above 4660. 4625 on the 20-day moving average would be the second line of defense. On the upside, a rebound would lead to 4750.


Orbex-LogoArticle by Orbex

Orbex is a fully licensed broker that was established in 2011. Founded with a mission to serve its traders responsibly and provides traders with access to the world’s largest and most liquid financial markets. www.orbex.com

Intraday Market Analysis – GBP Seeks Support

By Orbex

EURGBP sees a temporary pullback

EURGBP

The sterling inched higher as traders took profit after the BOE’s dovish shift last week. The rally above the supply area of 0.8570 is a sign of commitment from the buy-side.

Strong momentum has forced the bears to rush for the exit door. 0.8620 is now the next resistance. Its break would bring the euro to September’s high at 0.8660, where a breakout may lead to a bullish reversal in the medium-term.

In the meantime, an overbought RSI is causing a pullback. The base of the latest surge at 0.8465 is an important support.

NZDUSD tests key resistance

NZDUSD

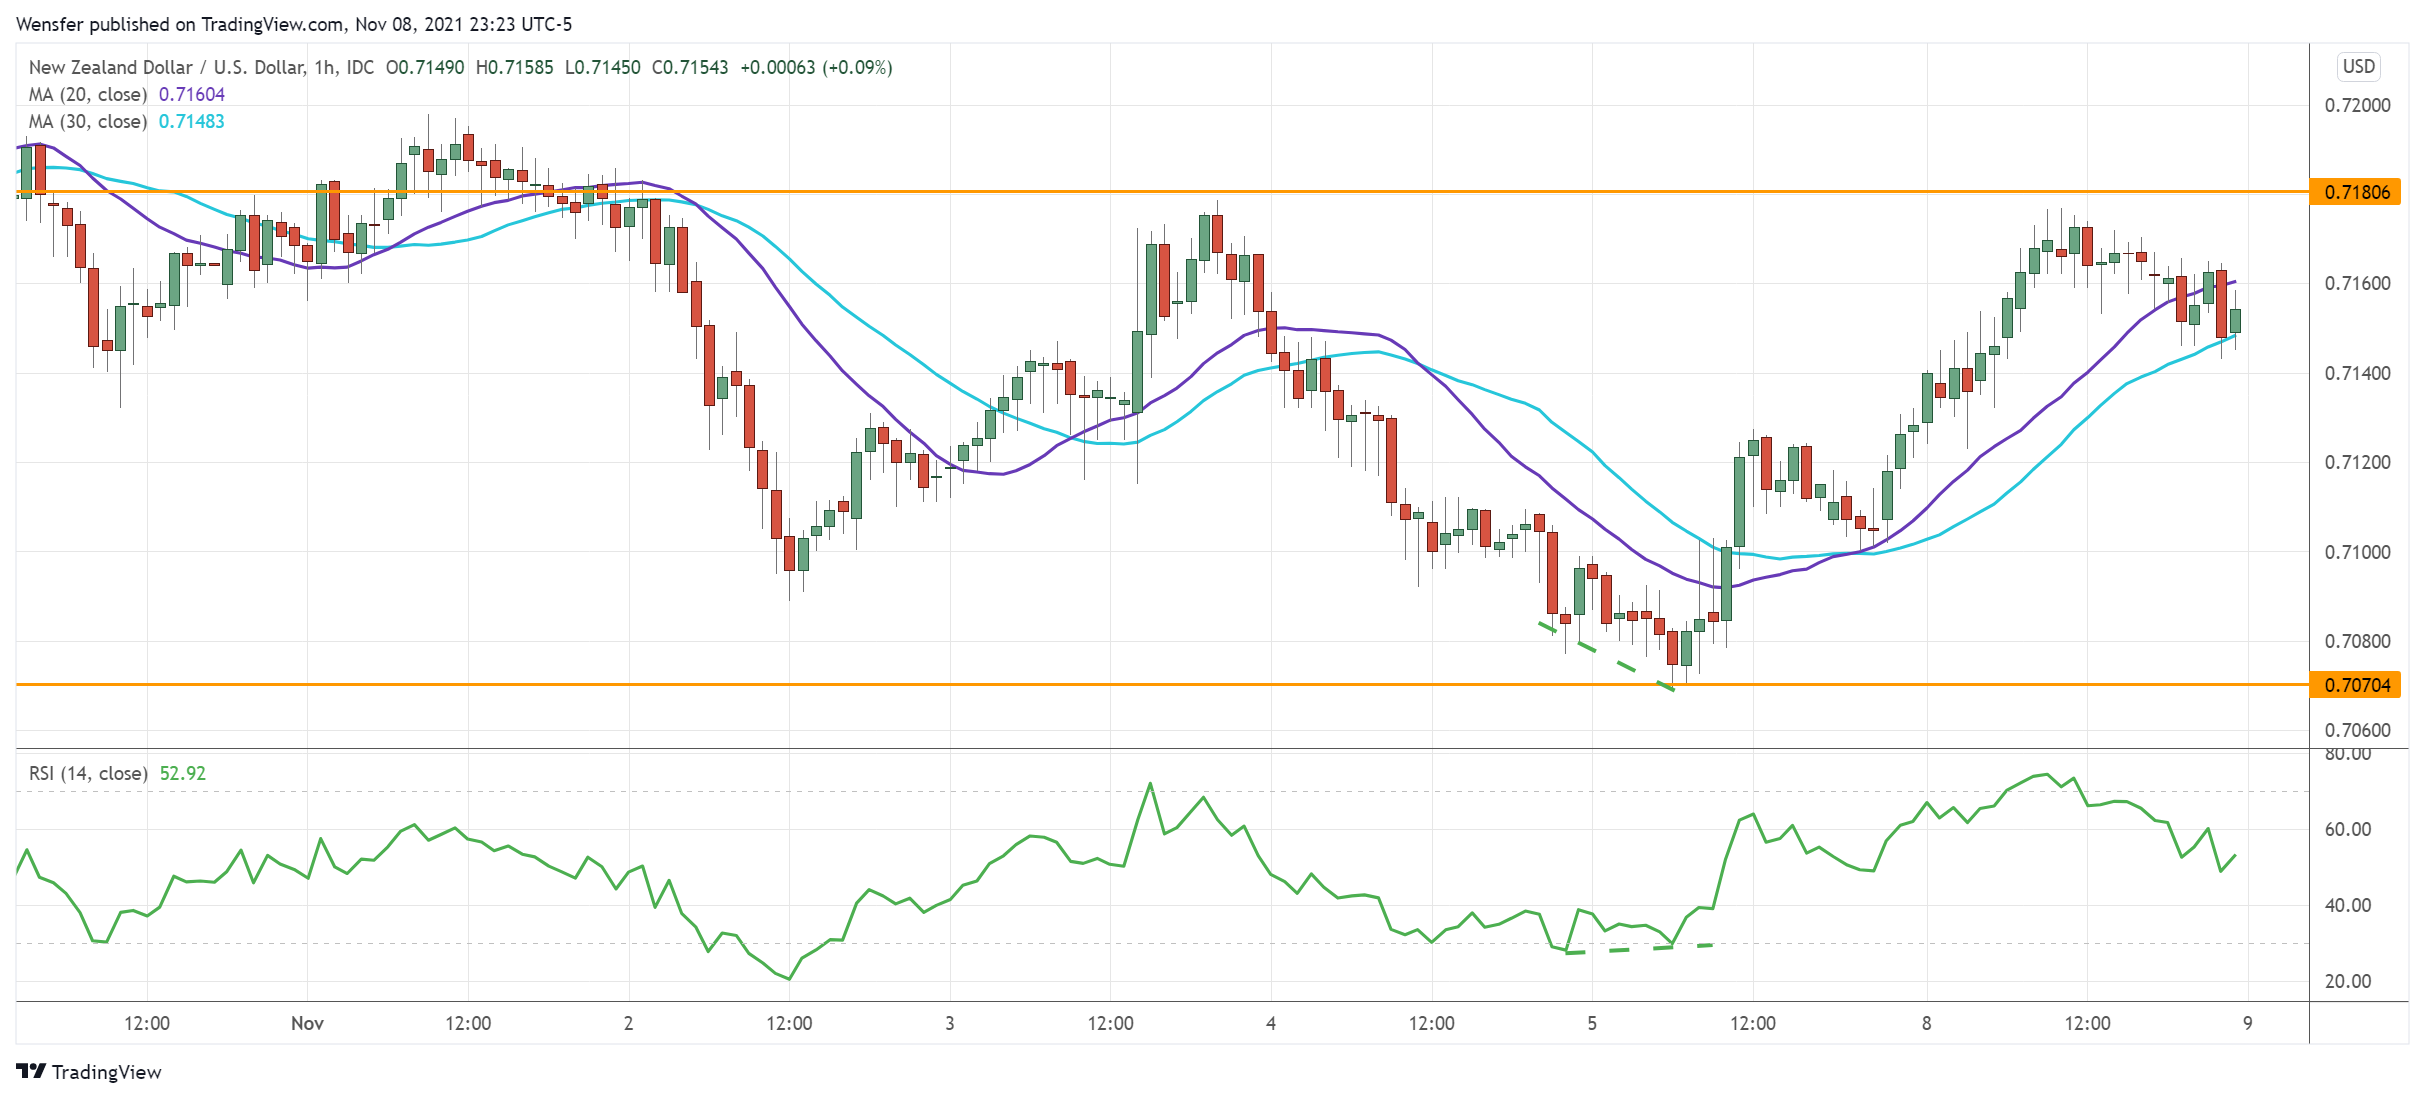
The New Zealand dollar recoups losses as risk appetite recovers. The pair has met buying interest at 0.7070 along the 20-day moving average.

A bullish RSI divergence is a sign that the bearish momentum has waned. When this happens in a demand zone, it makes a rebound of greater significance.

0.7180 is a major hurdle ahead following a previously botched bounce. Its breach may resume the kiwi’s uptrend above 0.7220. The RSI’s double top in the overbought area may briefly limit the bullish impetus.

GER 40 consolidates gains

DE40

The Dax 40 continues to rally in hopes of a prolonged low-rate environment.

The bulls are pushing towards 16200 after the index reached the milestone at 16000. However, the RSI’s multiple ventures into the overbought area and a bearish divergence indicate that the rally may have overextended.

A temporary pullback would be necessary to let the bulls catch their breath. 15920 is the immediate support. Further down, 15730 on the 20-day moving average would be an area of interest.


Orbex-LogoArticle by Orbex

Orbex is a fully licensed broker that was established in 2011. Founded with a mission to serve its traders responsibly and provides traders with access to the world’s largest and most liquid financial markets. www.orbex.com

Fibonacci Retracement Analysis 09.11.2021 (EURUSD, USDJPY)

Article By RoboForex.com

EURUSD, “Euro vs US Dollar”

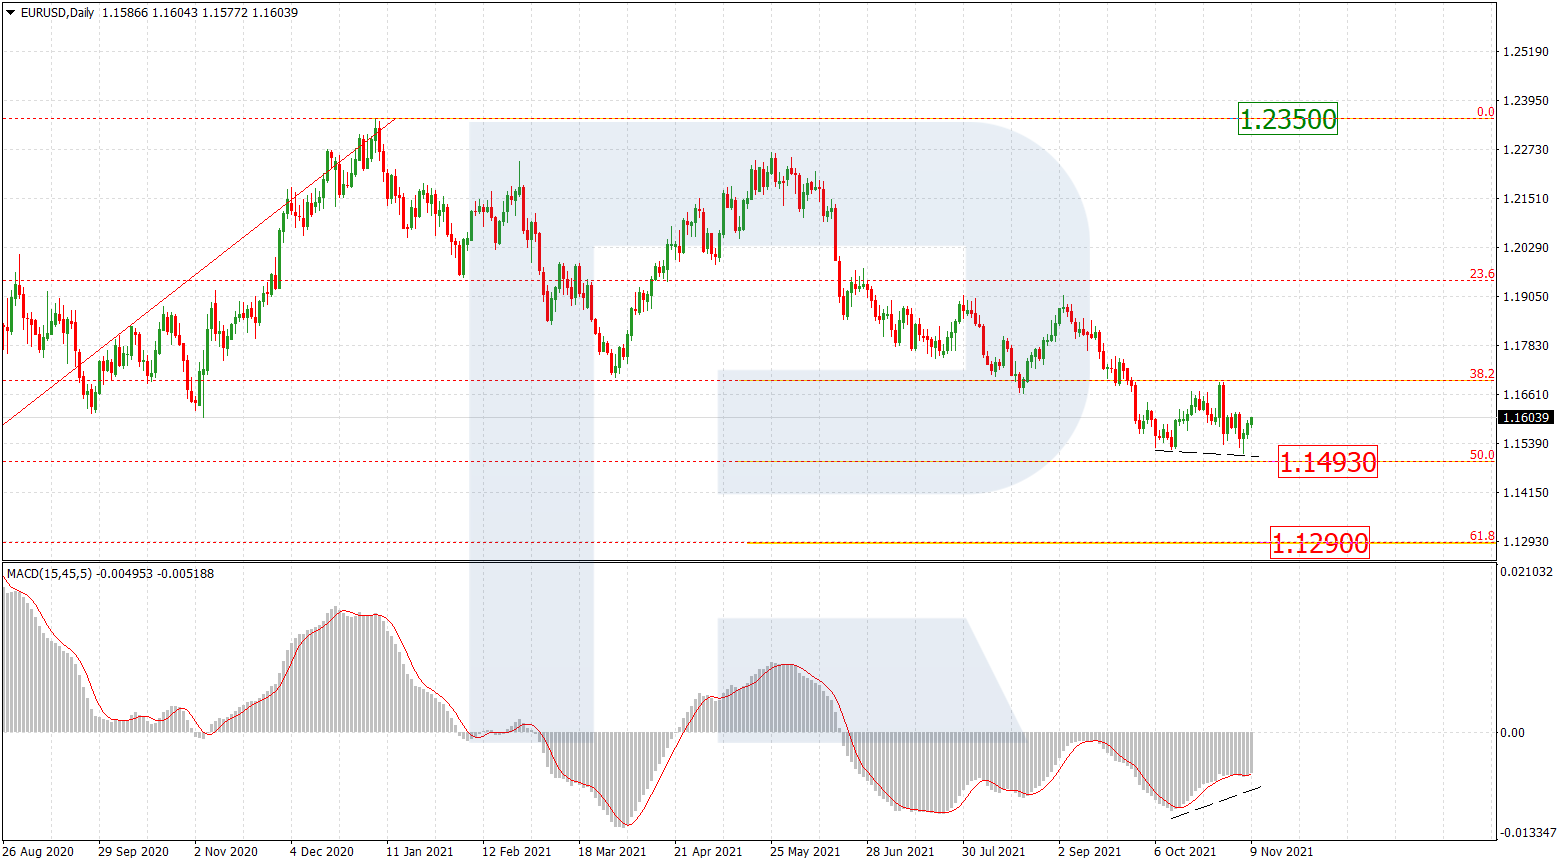
On D1, the quotations are demonstrating another attempt to test 50.0% (1.1493) Fibo in a long-term bearish phase. Also note that a local divergence is forming on the MACD, which might hint on a short-term pullback. When it is over, another wave of decline will head for not only 50.0% (1.1493) but also 61.8% (1.1290).

EURUSD_D1
Risk Warning: the result of previous trading operations do not guarantee the same results in the future

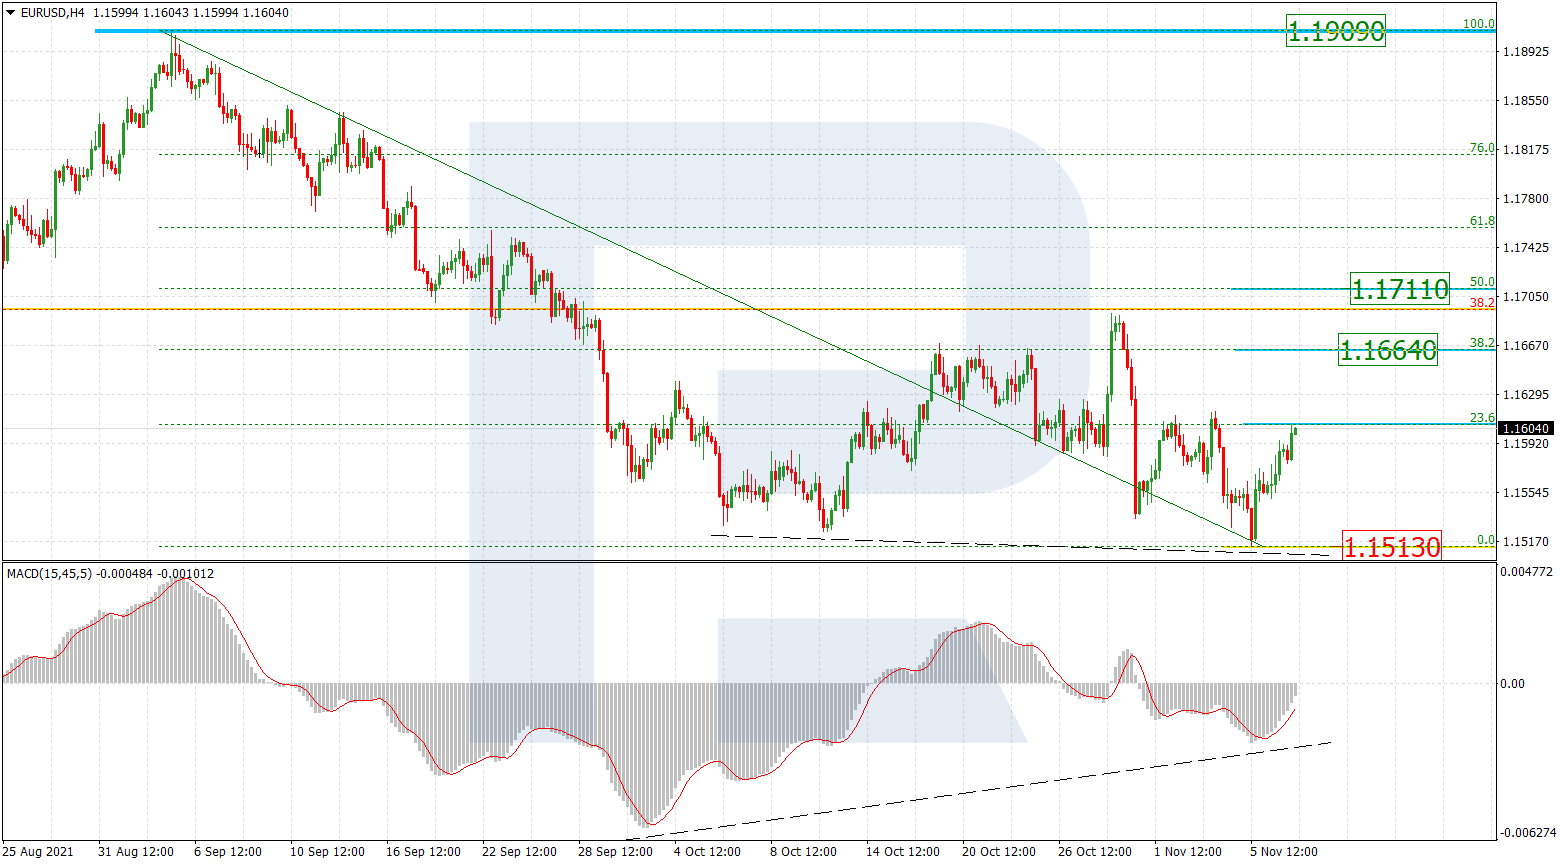
On H4, one can see potential goals of the ascending correction after a local convergence on the MACD. Now the quotations have risen to 23.6%, and later they can reach 38.2% (1.1664) and 50.0% (1.1711) Fibo. A breakaway of the low at 1.1513 will signal about the continuation of the downtrend.

EURUSD_H4
Risk Warning: the result of previous trading operations do not guarantee the same results in the future

USDJPY, “US Dollar vs Japanese Yen”

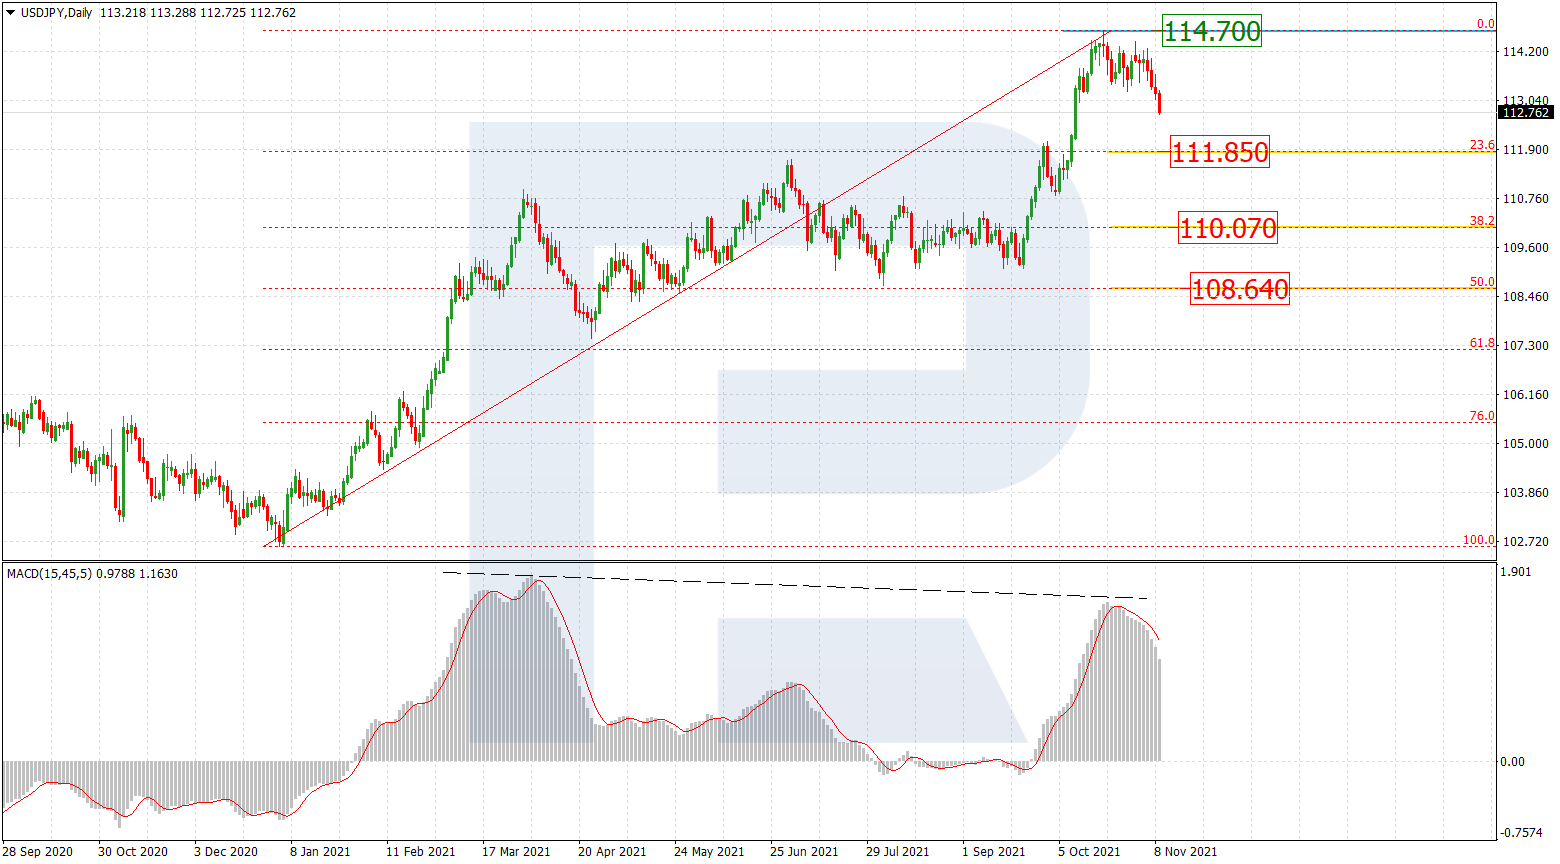
On D1, there is a downward movement beginning after a divergence. Potential goals of the medium-term decline are 23.6% (111.85), 38.2% (110.07), and 50.0% (108.64) Fibo. The main resistance is at the high of 114.70.

USDJPY_D1
Risk Warning: the result of previous trading operations do not guarantee the same results in the future

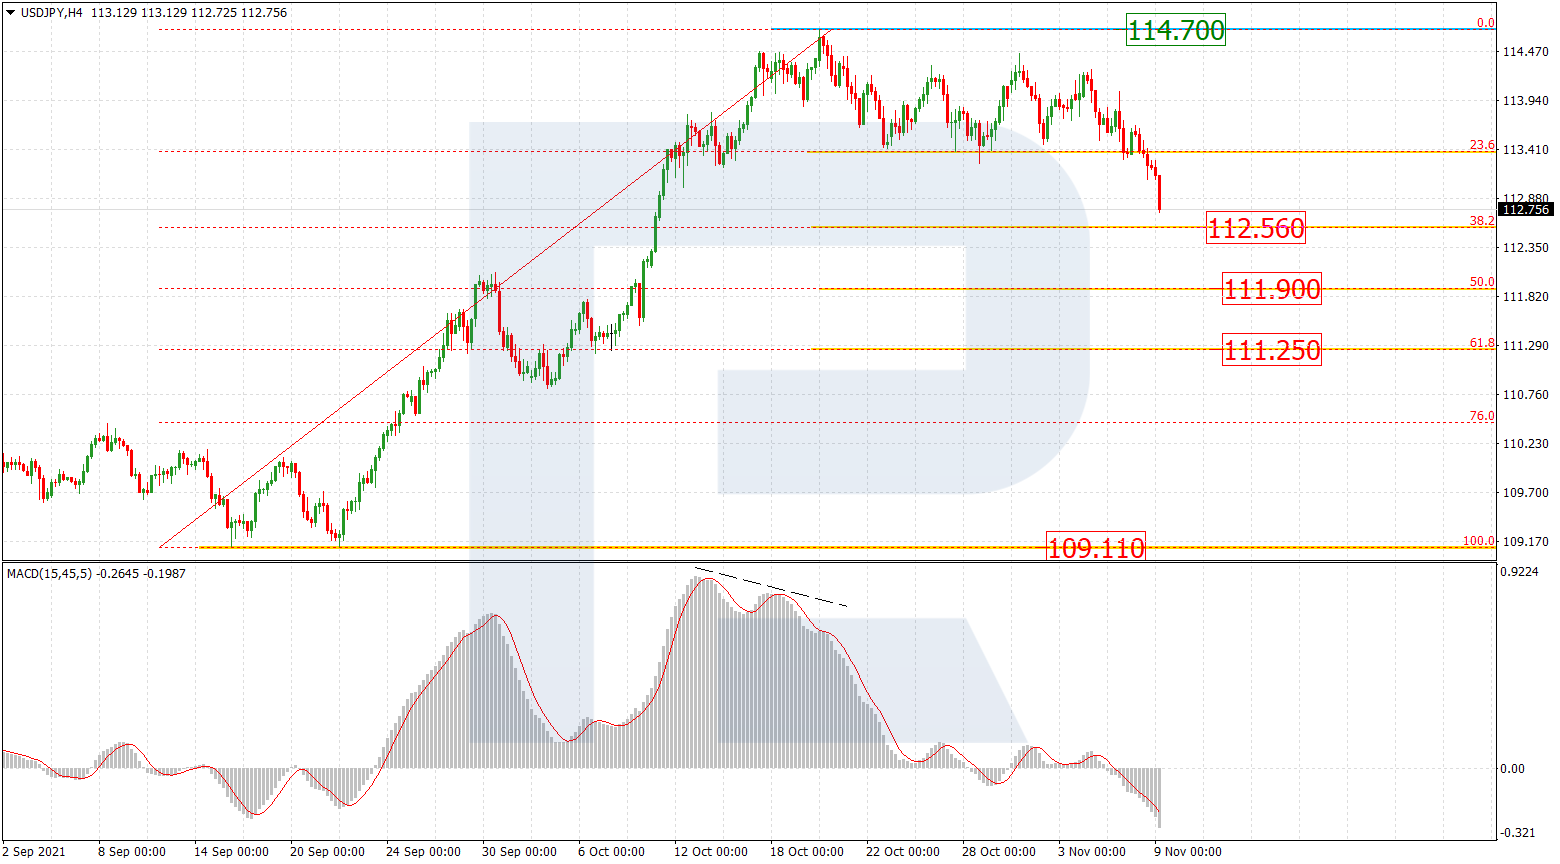
On H4, there is a correctional decline to the last wave of growth. By now, the quotations have come over 23.6% and are aiming at 38.2% (112.56) Fibo. After coming over this level, the decline might continue to 50.0% (111.90) and 61.8% (111.25). The key medium-term support is 109.11.

USDJPY_H4

Article By RoboForex.com

Attention!
Forecasts presented in this section only reflect the author’s private opinion and should not be considered as guidance for trading. RoboForex LP bears no responsibility for trading results based on trading recommendations described in these analytical reviews.

Yen is growing extremely fast. Overview for 09.11.2021

Article By RoboForex.com

The Japanese yen is growing noticeably against the US dollar. The current quotation is 112.80.

It does not seem that the yen is growing thanks to the comments of monetary politicians or some statistics. The reason should be the market demand for safe-haven assets: investors are looking for a global foothold. On the whole, the market is now against the American dollar as long as it has got all the facts from the Fed and all the macrostatistics.

Anyway, macroeconomic reports give an idea of what is going on in the economy. We are most interested in inflation and everything around it. As soon as a miracle happens, and Japan finally conquers deflation, the Central Bank will start doing something with the public debt and stimulation programs. It will be interesting.

According to the statistics published today, average hourly wage in Japan in September grew by 0.2% y/y. This is inferior to the forecast (+0.6% y/y) and to the result from back in August. Companies fight less over workforce because have little trust in the financial future. This might be a problem.

The Japan Economy Watchers index in October grew to 55.5 points against 42.1 points in September and the forecasts 48.6 points. This is a good signal because might mean future interest in spending, and this is just what is needed.

Article By RoboForex.com

Attention!
Forecasts presented in this section only reflect the author’s private opinion and should not be considered as guidance for trading. RoboForex LP bears no responsibility for trading results based on trading recommendations described in these analytical reviews.