Article By RoboForex.com
EURUSD, “Euro vs US Dollar”
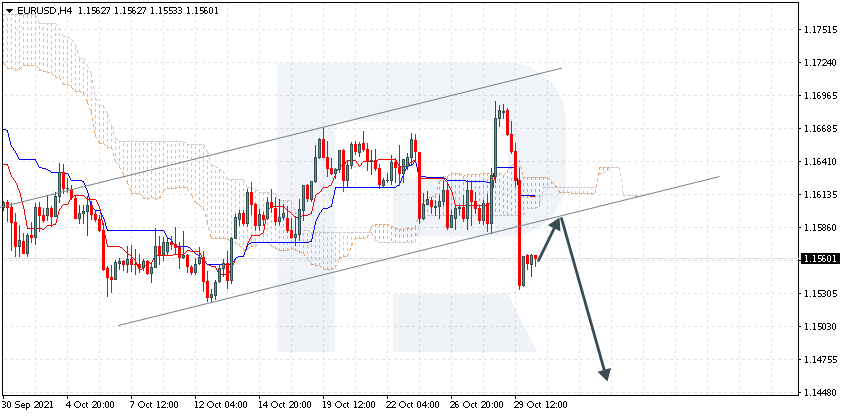
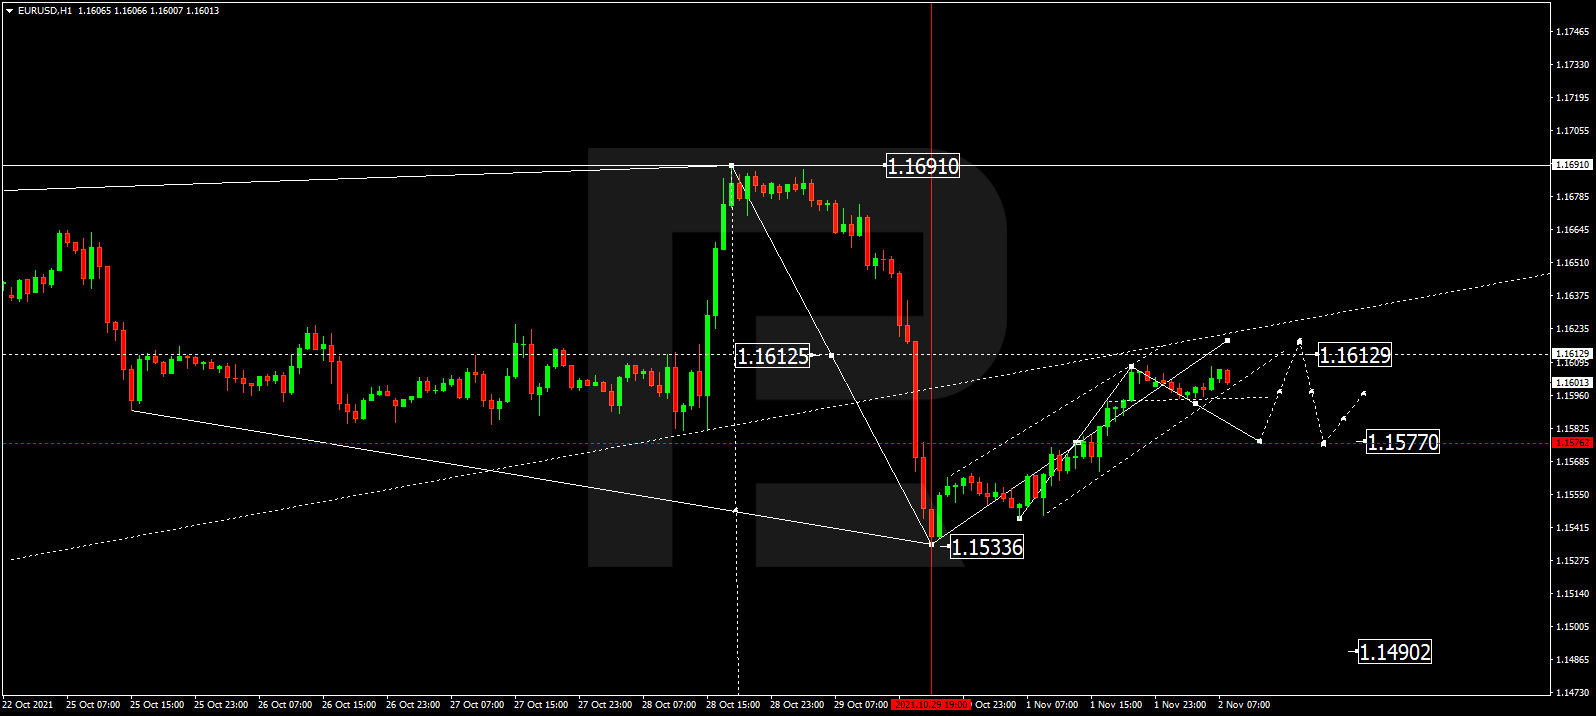
After forming a new consolidation range and breaking 1.1577 to the upside, EURUSD is still correcting towards 1.1612. Later, the market may fall to break 1.1533 and then continue trading downwards with the short-term target at 1.1490.

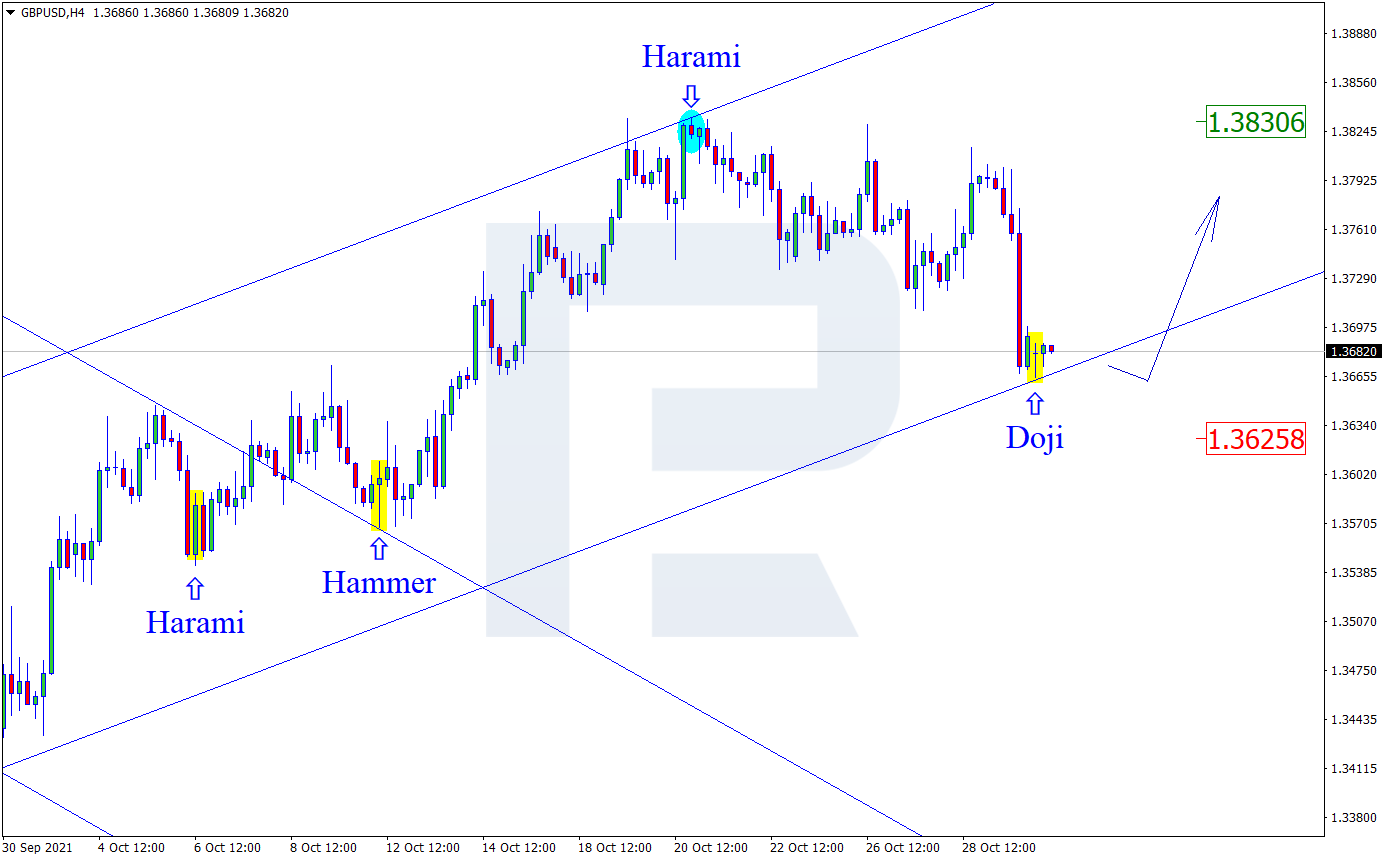
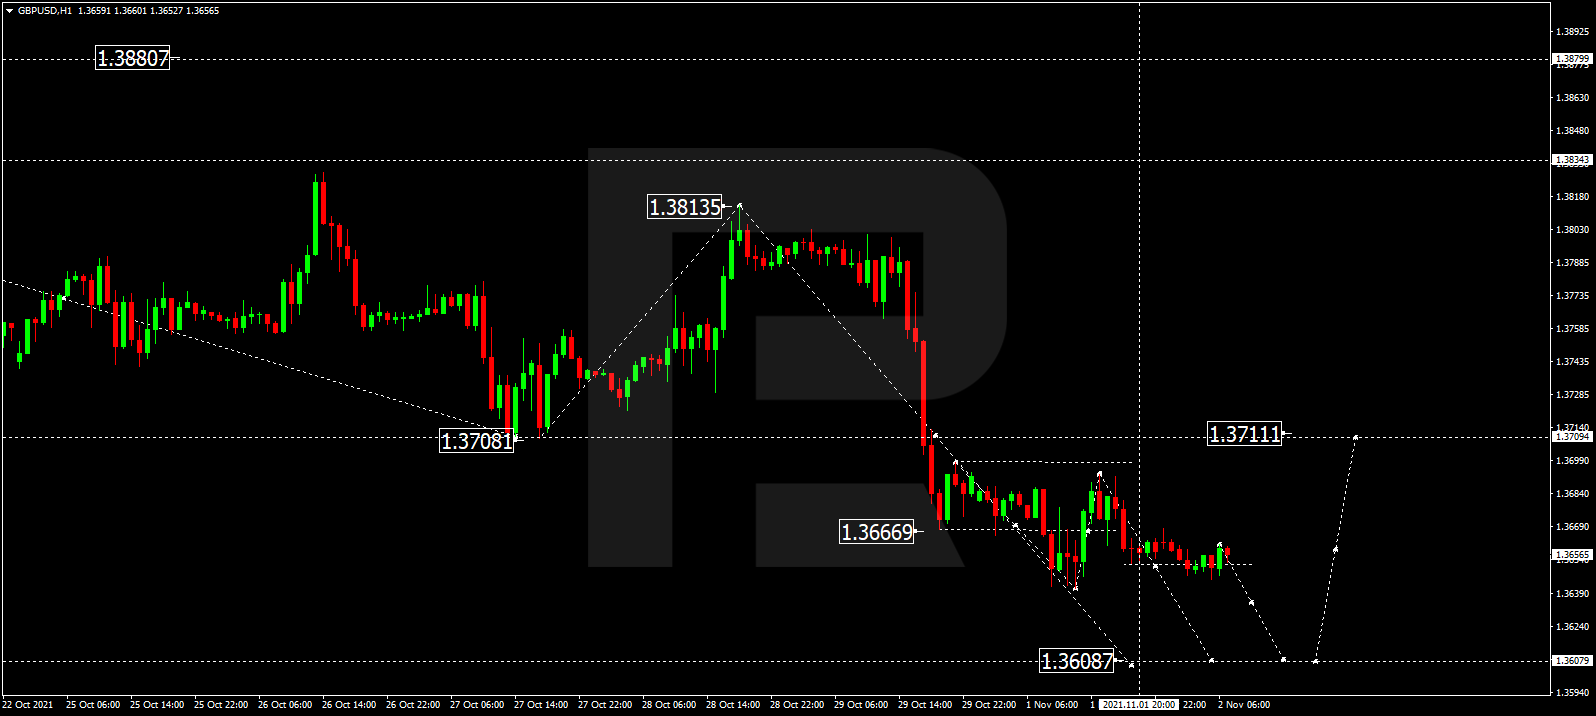
GBPUSD, “Great Britain Pound vs US Dollar”
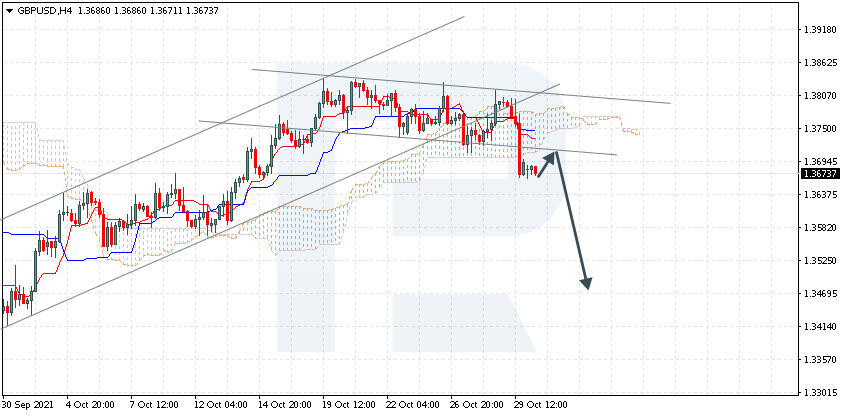
After forming a new consolidation rang around 1.3666 and breaking it to the downside, GBPUSD is expected to continue falling within the downtrend towards 1.3608. Later, the market may correct to test 1.3666 from below and then resume falling with the target at 1.3490.
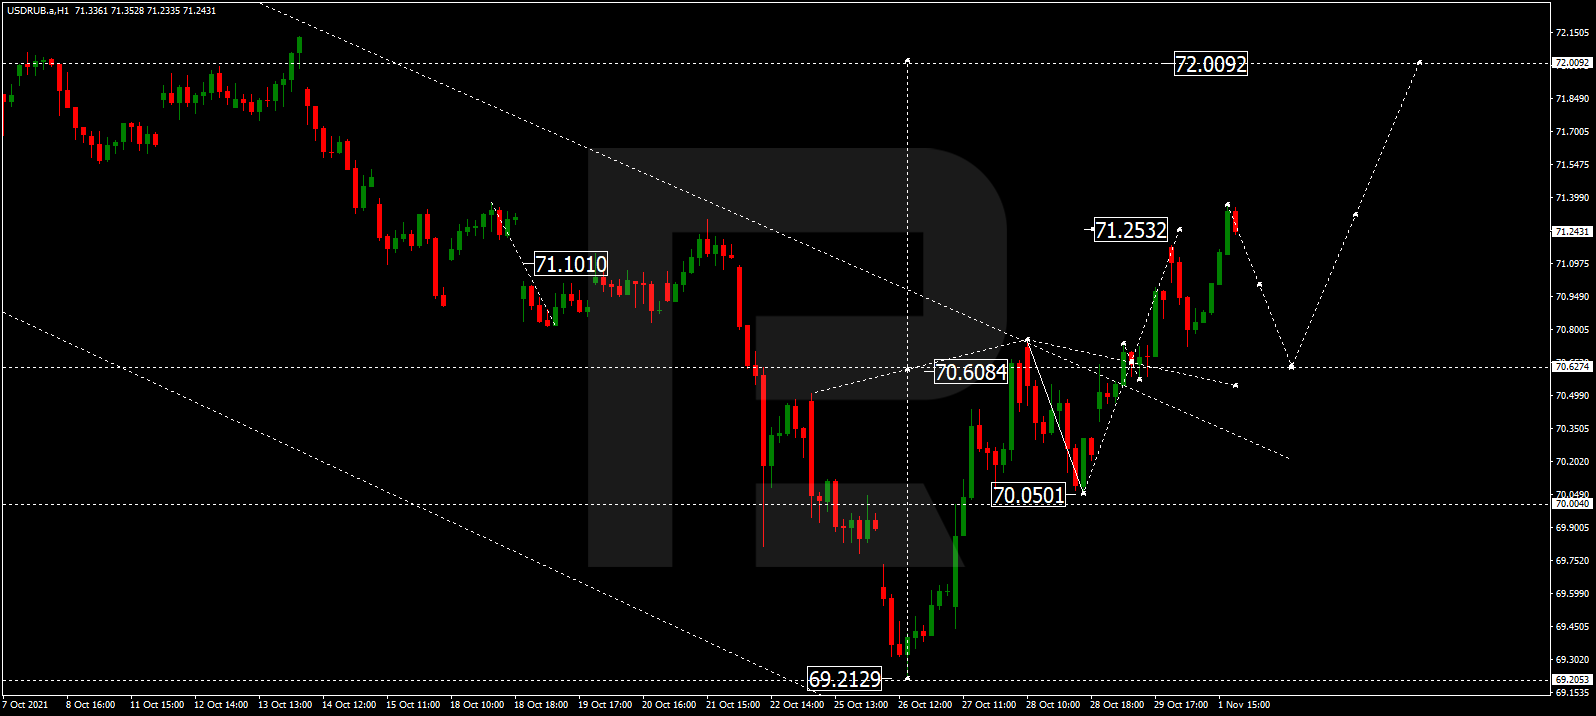
USDRUB, “US Dollar vs Russian Ruble”
After expanding the consolidation range up to 71.25, USDRUB is expected to resume falling towards 70.60 and may later form one more ascending structure with the target at 72.00 to complete the correction. Later, the market may start another decline to reach 69.20.
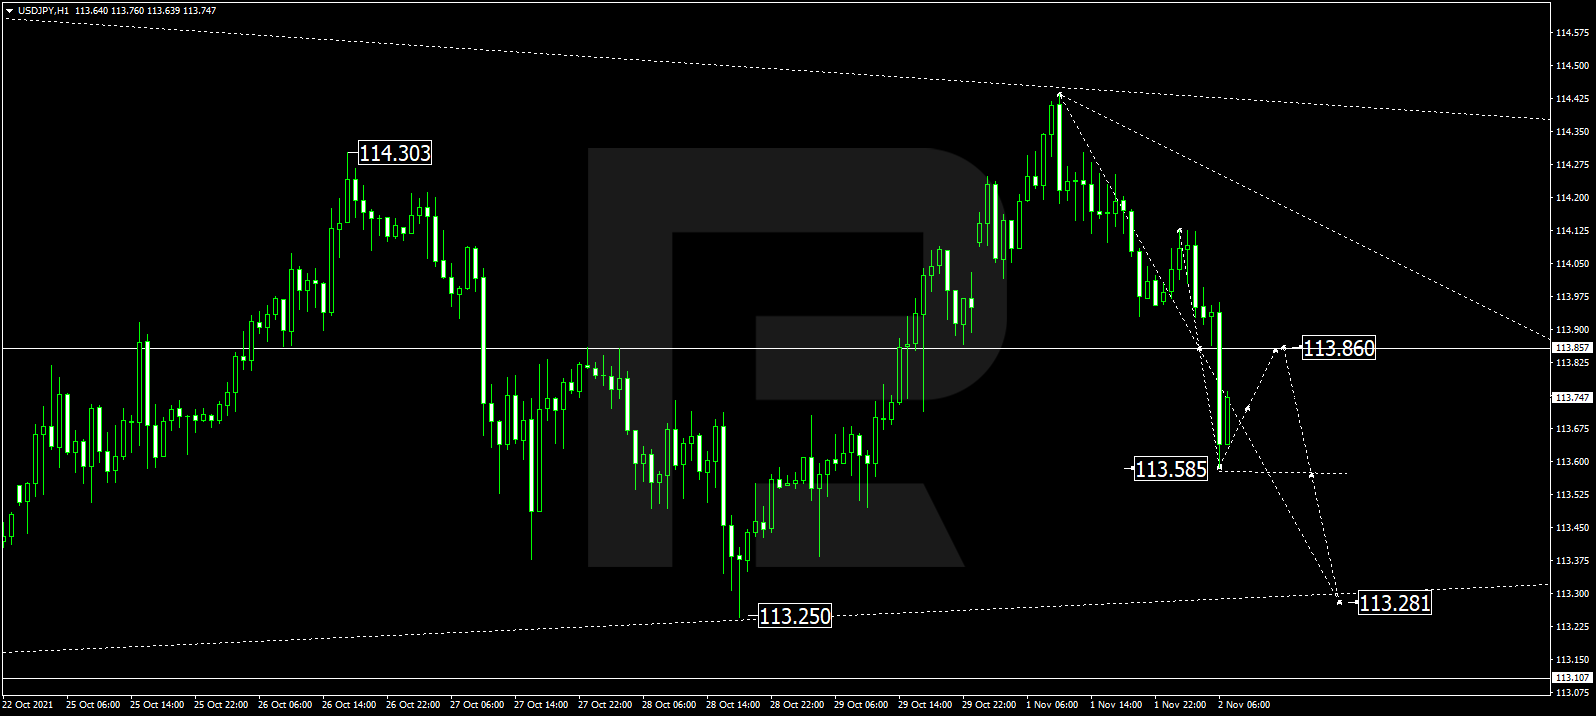
USDJPY, “US Dollar vs Japanese Yen”
After returning to 113.86, USDJPY is expected to consolidate around this level. If later the price breaks this range to the downside, the market may resume falling towards 113.28 and then start a new growth with the target at 113.86.
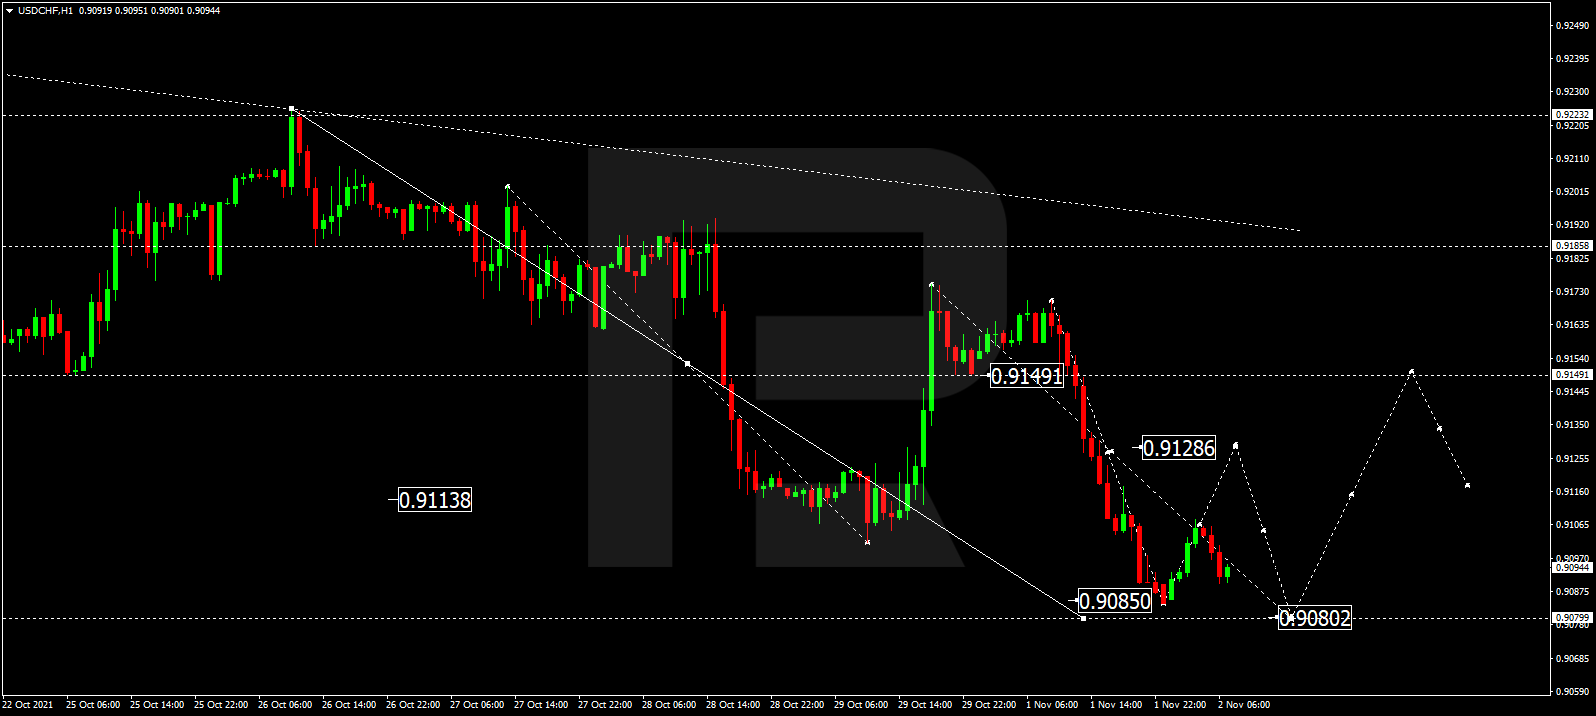
USDCHF, “US Dollar vs Swiss Franc”
After breaking 0.9128 and then reaching the short-term downside target at 0.9090, USDCHF is forming a new consolidation range above the latter level. If later the price breaks this range to the upside, the market may grow to reach 0.9128; if to the downside – resume falling to complete the descending wave at 0.9080 and then start another growth with the target at 0.9150.
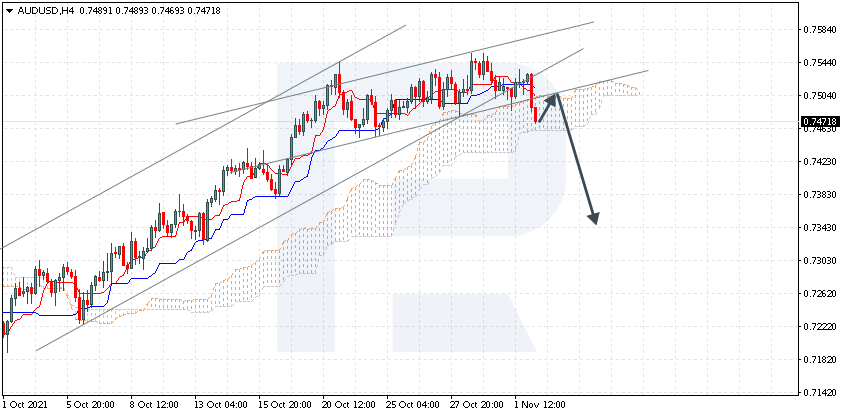
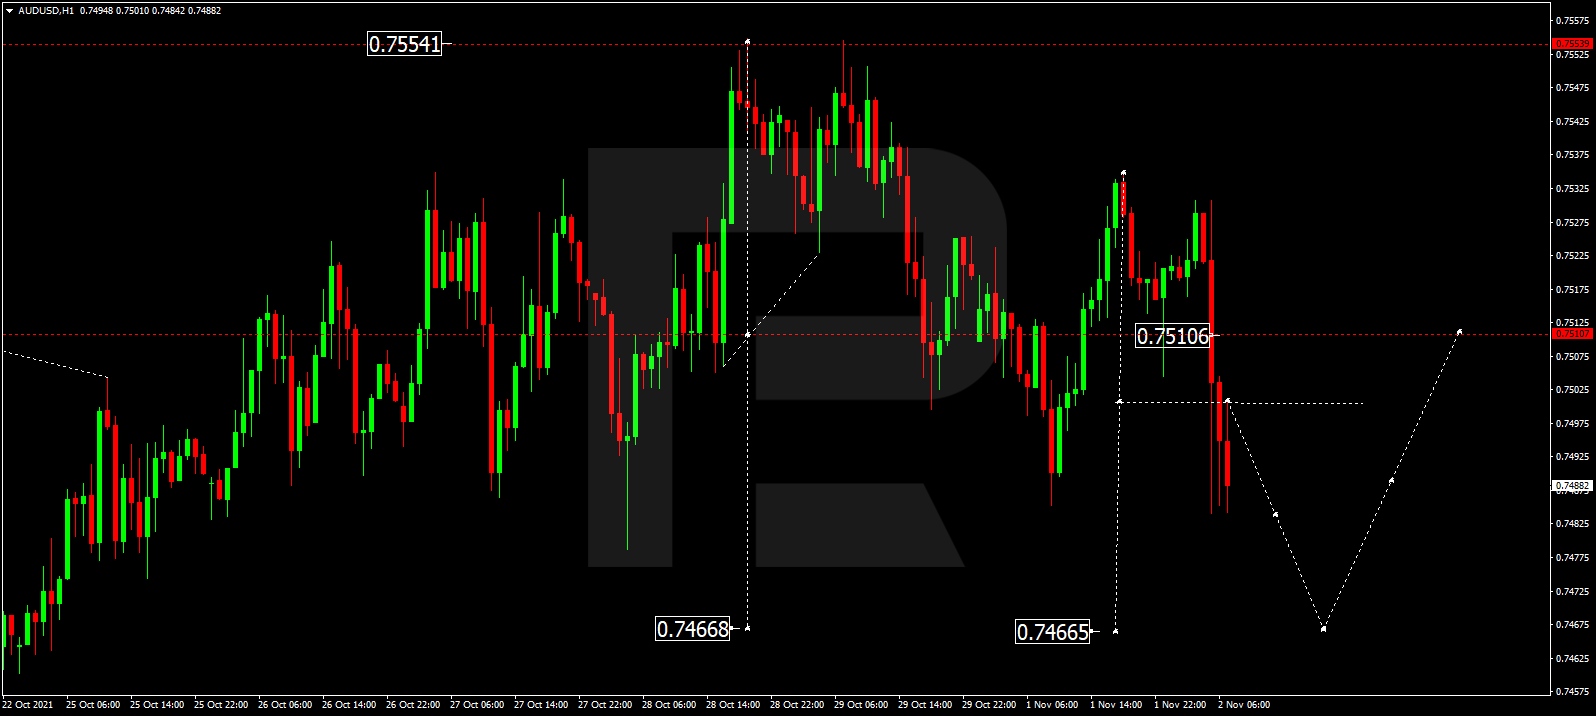
AUDUSD, “Australian Dollar vs US Dollar”
AUDUSD continues forming the descending wave towards 0.7466. After that, the instrument may correct to reach 0.7511 and resume trading downwards with the target at 0.7400.
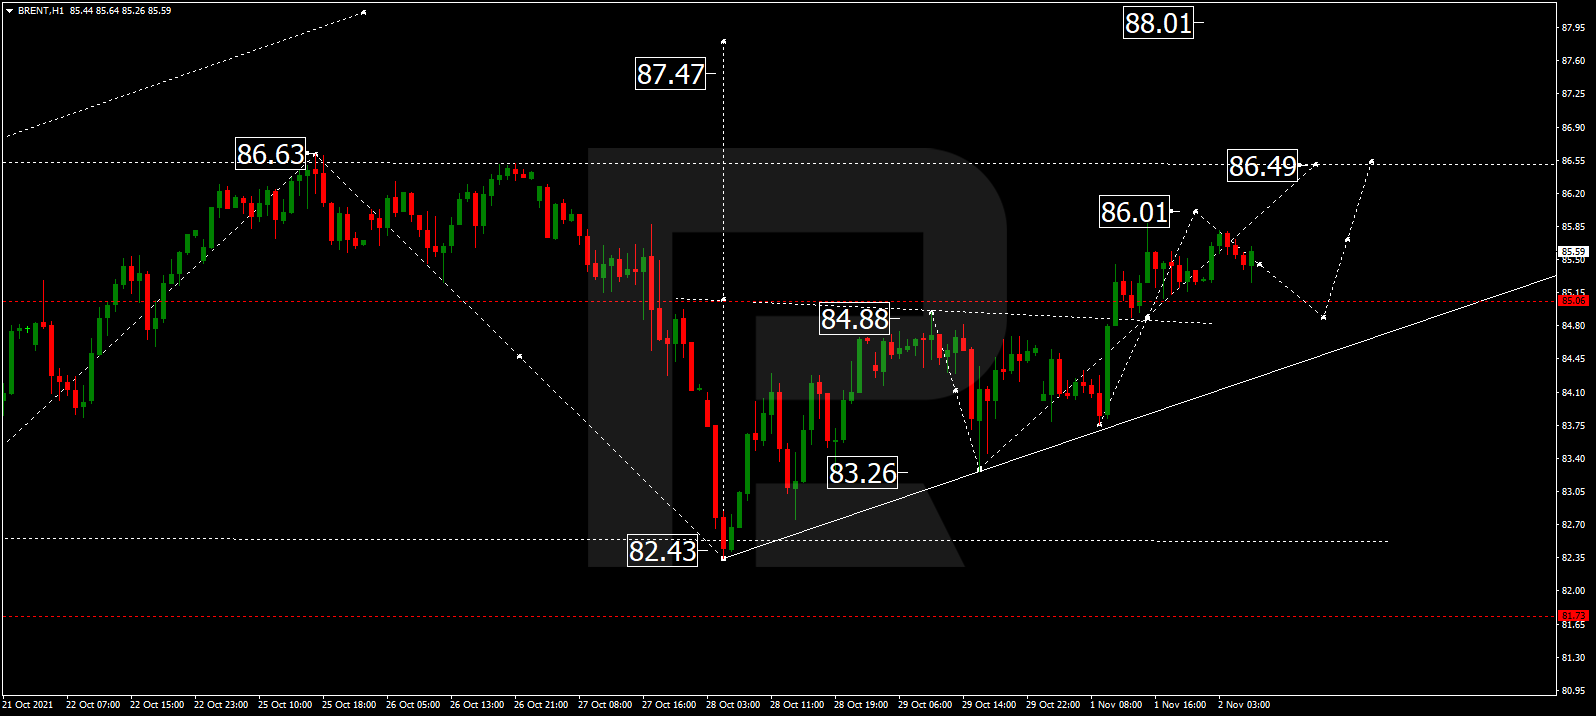
BRENT
After breaking 85.05 to the upside, Brent is expected to continue growing and reach 86.50. After that, the instrument may correct to return to 85.05 and then resume trading upwards with the target at 88.00.
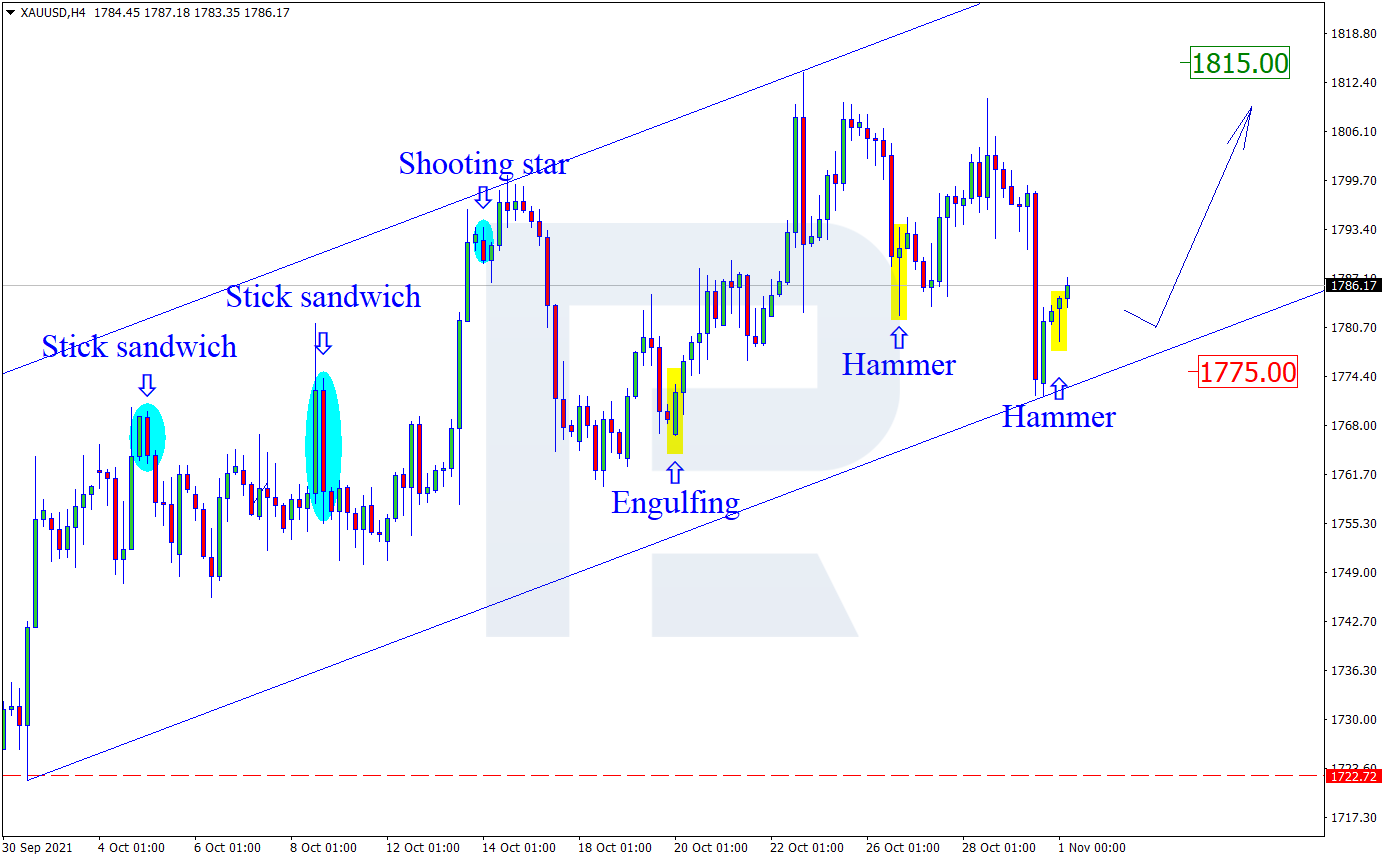
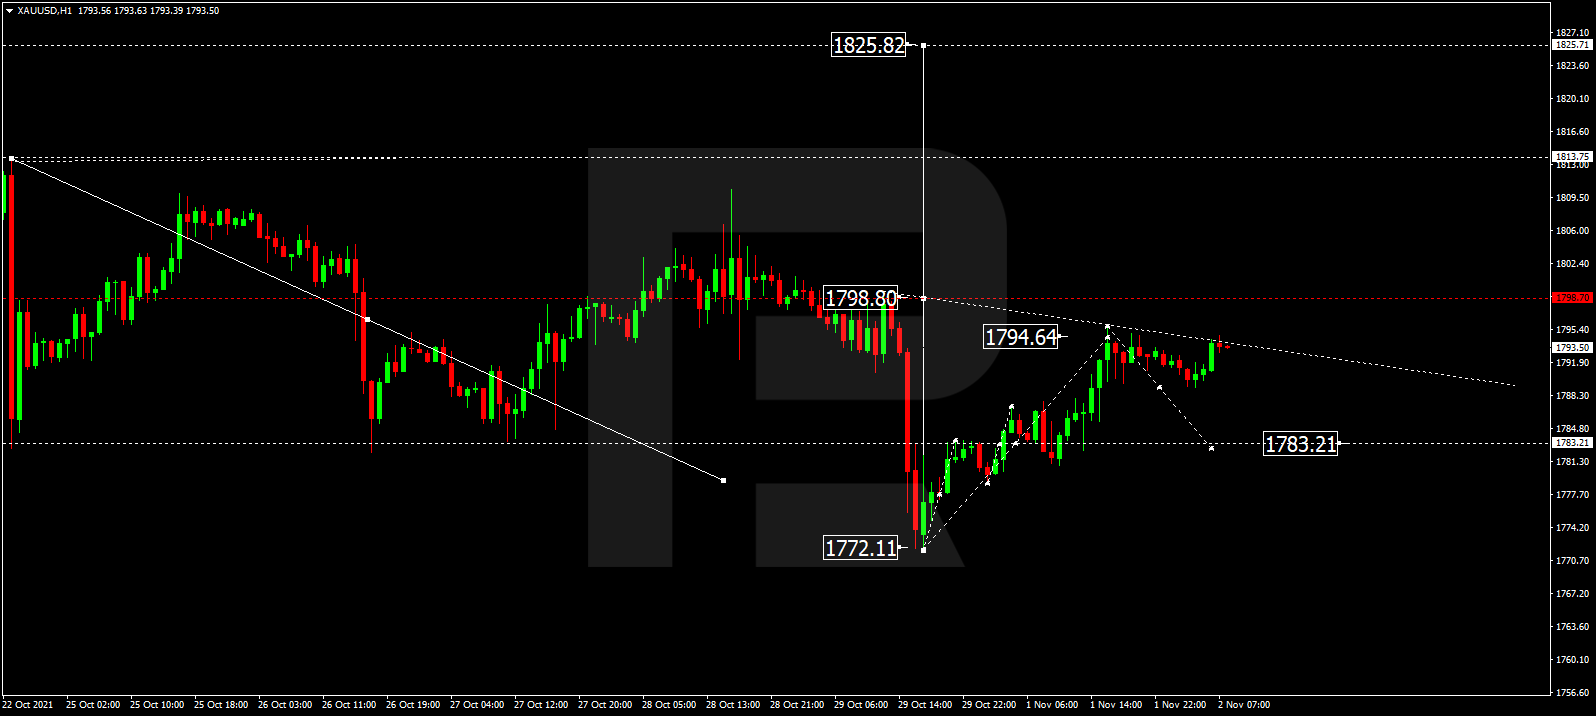
XAUUSD, “Gold vs US Dollar”
Gold has broken 1784.60; right now, it is still growing towards 1798.00. After that, the instrument may correct to return to 1785.00 and then resume trading upwards with the target at 1825.80.
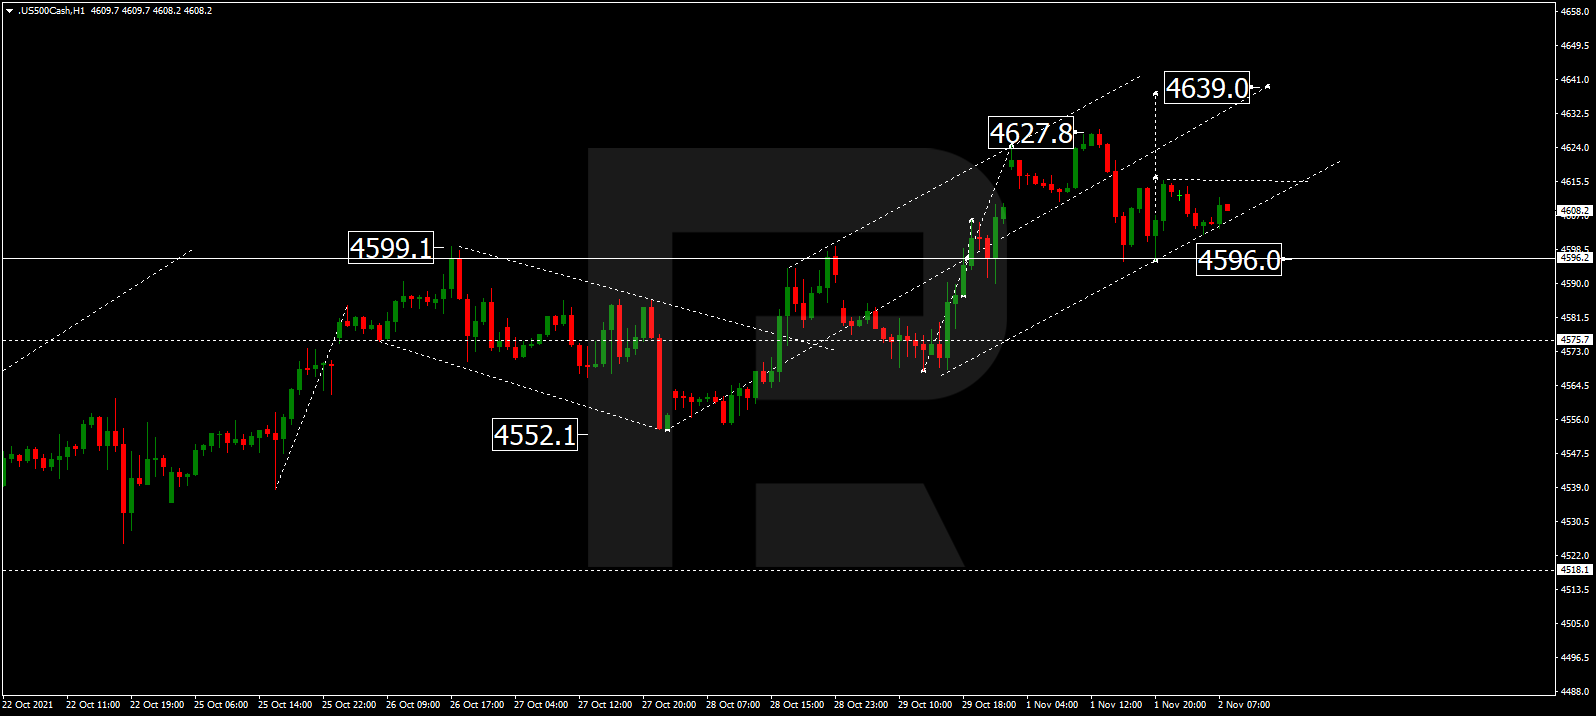
S&P 500
After completing the ascending structure at 4627.8 along with the correction towards 4596.0, the S&P index is consolidating above the latter level. Later, the market may break the range to the upside and start another growth towards with the target at 4639.0.
Article By RoboForex.com
Attention!
Forecasts presented in this section only reflect the author’s private opinion and should not be considered as guidance for trading. RoboForex LP bears no responsibility for trading results based on trading recommendations described in these analytical reviews.