Archive for Forex and Currency News – Page 205

Fibonacci Retracement Analysis 12.11.2021 (AUDUSD, USDCAD)

Article By RoboForex.com

AUDUSD, “Australian Dollar vs US Dollar”

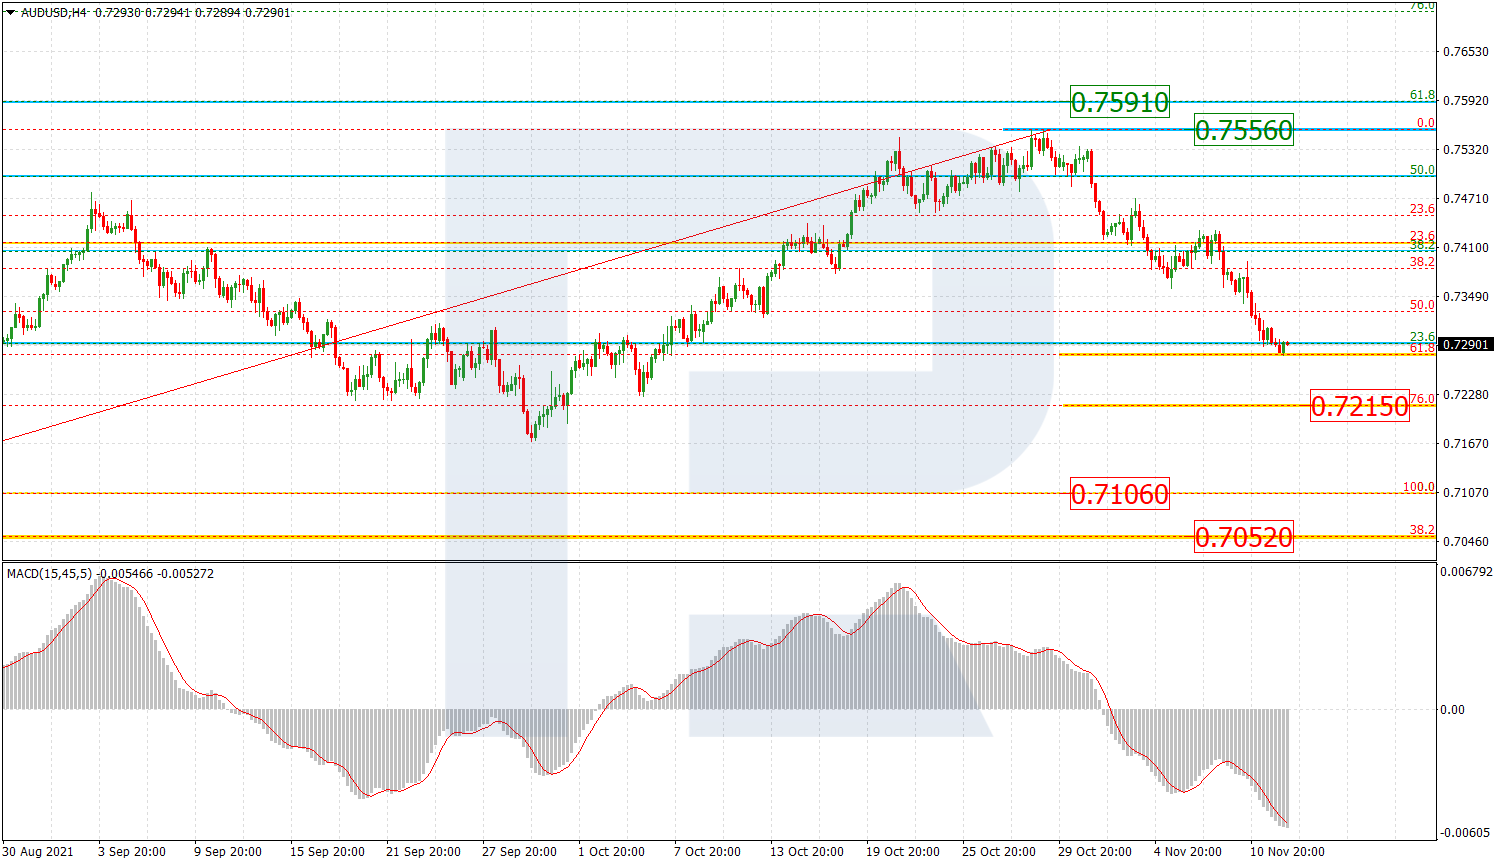
On H4, a phase of correctional growth stopped above 50.0%, failing just a bit to reach 61.8% (0.7591) Fibo. Now a new wave of decline is aiming at the last low of 0.7106. After a breakaway, the quotations can head for the medium-term level of 38.2% (0.7052).

AUDUSD_H4
Risk Warning: the result of previous trading operations do not guarantee the same results in the future

On H1, a wave of decline is testing 61.8% and can go over it to 76.0% (0.7215) Fibo. With such a technical picture, note a convergence forming on the MACD, which might indicate a short-term pullback after the target level is reached. The main resistance is at the high of 0.7556.

AUDUSD_H1
Risk Warning: the result of previous trading operations do not guarantee the same results in the future

USDCAD, “US Dollar vs Canadian Dollar”

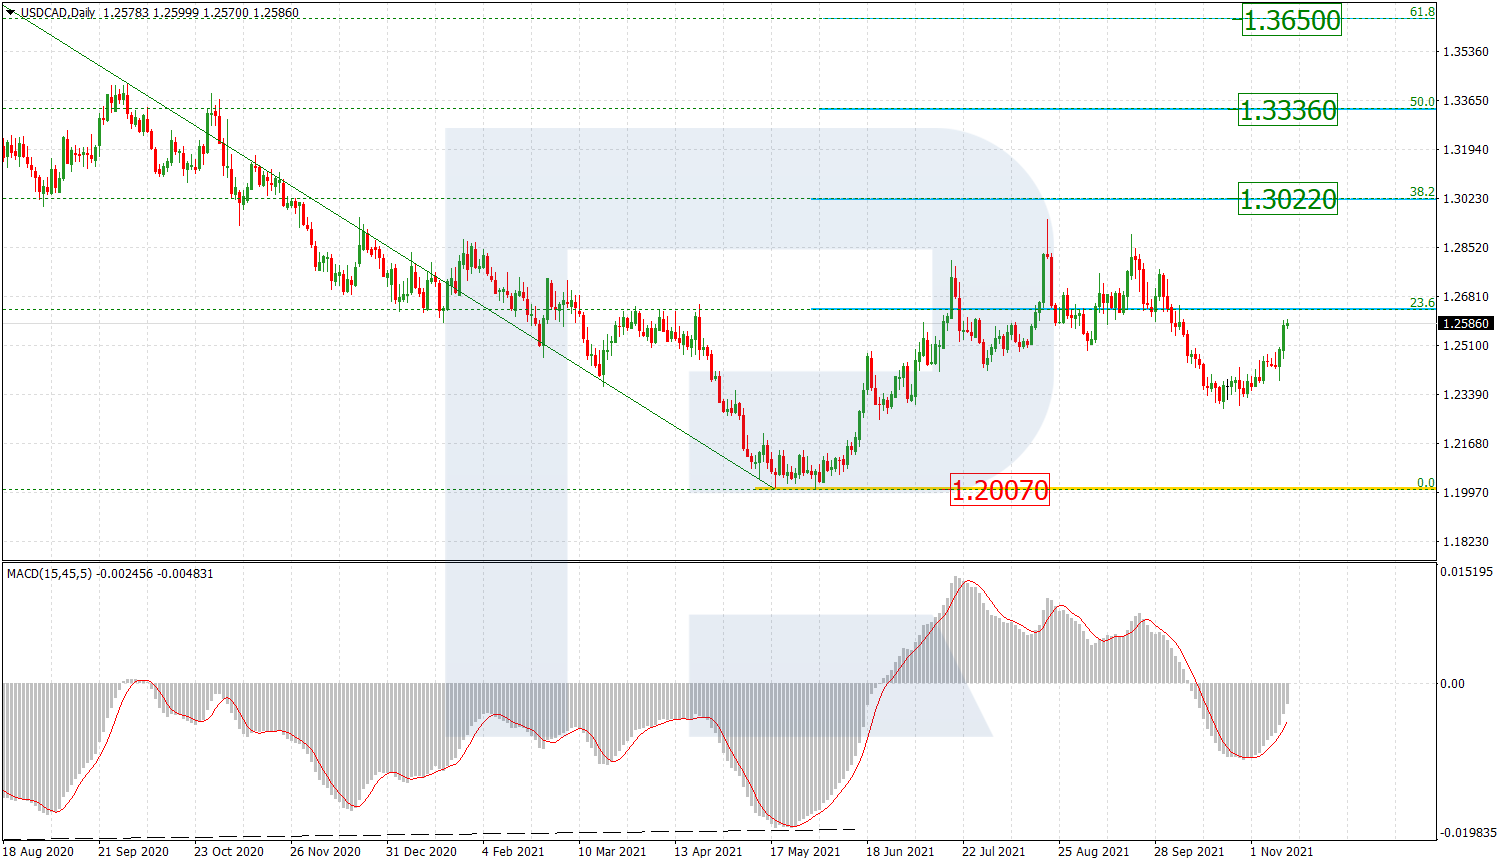
On D1, there is another wave of the bullish phase after a correctional decline. The aims of the new wave will be 38.2% (1.3022), 50.0% (1.3336), and 61.8% (1.3650) Fibo. Support is at the low of 1.2007.

USDCAD_D1
Risk Warning: the result of previous trading operations do not guarantee the same results in the future

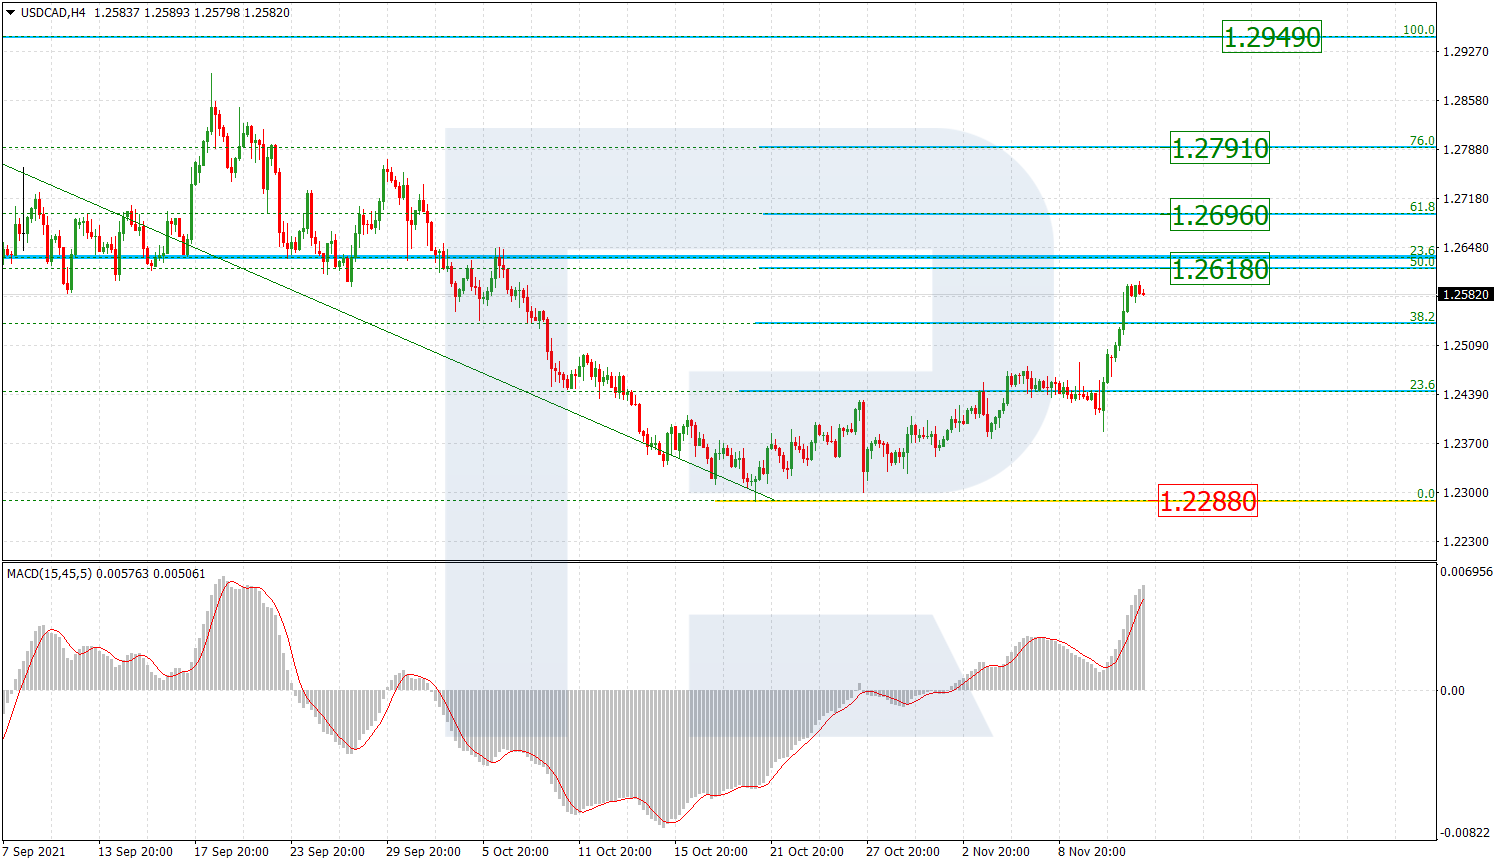
On H4, the upward movement can be seen in more detail after a convergence on the MACD. By now, the quotations have come over 38.2% Fibo and are nearing 50.0% (1.2618). Leaving these levels behind, the pair can reach 61.8% (1.2696) and 76.0% (1.2791), while the high of 1.2949 can act as the main resistance level. Local support is at the low of 1.2288.

USDCAD_H1

Article By RoboForex.com

Attention!
Forecasts presented in this section only reflect the author’s private opinion and should not be considered as guidance for trading. RoboForex LP bears no responsibility for trading results based on trading recommendations described in these analytical reviews.

Intraday Market Analysis – USD Keeps Bullish Momentum

By Orbex

GBPUSD buried in bearish territory

GBPUSD

The pound continues to retreat after Britain’s growth fell short of expectations in Q3. A break below September’s low at 1.3420 has invalidated the latest rebound, putting buyers on the defensive once again.

The RSI’s double bottom in the oversold area may ease the bearish push momentarily. A bounce could be an opportunity to sell into strength.

1.3500 is the immediate resistance. On the downside, renewed momentum would drive price action towards last December’s lows around 1.3200.

AUDUSD struggles for support

AUDUSD

The Australian dollar came under pressure after the unemployment rate returned above 5% last month.

The sell-off continued after a brief pause over the 30-day moving average near 0.7390, turning the latter into a fresh resistance. The lack of support suggests increasingly downbeat sentiment.

The base of October’s bullish breakout at 0.7240 is the next support. The RSI’s oversold situation may cause a limited rebound from the round number at 0.7300, though it is likely to turn out to be a dead cat bounce.

US 100 tests demand zone

US100

The Nasdaq 100 suffers losses as high inflation dents risk appetite.

An RSI divergence showed a deceleration in the uptrend, a sign that the rally has overheated. Subsequently, a drop below 16200 has prompted leveraged buyers to exit for fear of a correction.

As the RSI inched into the oversold territory, the index saw bids near the breakout zone (15900) from earlier this month. The support-turned-resistance at 16200 is the first hurdle. Then the bulls will need to clear 16400 before the rally can resume.


Orbex-LogoArticle by Orbex

Orbex is a fully licensed broker that was established in 2011. Founded with a mission to serve its traders responsibly and provides traders with access to the world’s largest and most liquid financial markets. www.orbex.com

Ichimoku Cloud Analysis 12.11.2021 (GBPUSD, USDJPY, USDCAD)

Article By RoboForex.com

GBPUSD, “Great Britain Pound vs US Dollar”

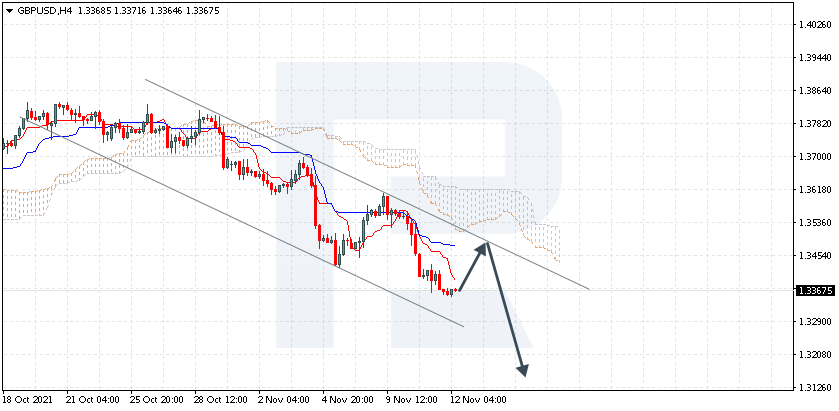
The currency pair is trading at 1.3367 under the Ichimoku Cloud, suggesting a downtrend. A test of the signal lines of the indicator at 1.3455 is expected, followed by falling to 1.3145. An additional signal confirming the decline might become a bounce off the upper border of the descending channel. The scenario can be canceled by a breakaway of the upper border of the Cloud and securing above 1.3635, which will mean further growth to 1.3725.

GBPUSD
Risk Warning: the result of previous trading operations do not guarantee the same results in the future

USDJPY, “US Dollar vs Japanese Yen”

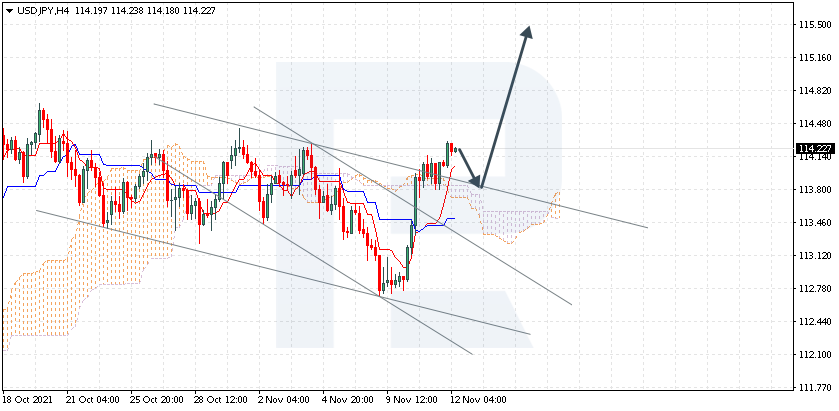
The currency pair is trading at 114.22 above the Ichimoku Cloud, suggesting an uptrend. A test of the upper border of the Cloud at 113.80 is expected, followed by growth to 115.50. An additional signal confirming the growth might become a bounce off the upper border of the descending channel. The scenario can be canceled by a breakaway of the lower border of the Cloud and securing under 113.05, which will mean further falling to 112.15. The growth can be confirmed by a breakaway of the resistance area and securing above 114.50: this level has been tested several times, yet buyers failed to break through it.

USDJPY
Risk Warning: the result of previous trading operations do not guarantee the same results in the future

USDCAD, “US Dollar vs Canadian Dollar”

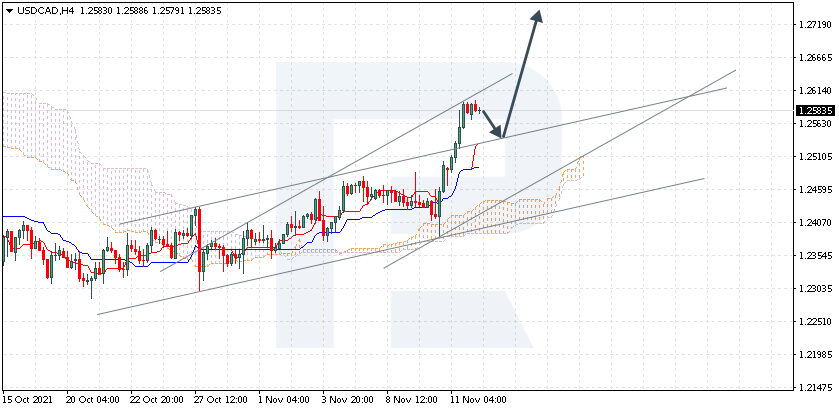
The currency pair is trading at 1.2583 above the Ichimoku Cloud, suggesting an uptrend. A test of the signal lines of the indicator at 1.2525 is expected, followed by growth to 1.2740. An additional signal confirming the growth might become a bounce off the upper border of the ascending channel. The scenario can be canceled by a breakaway of the lower border of the Cloud and securing under 1.2345, which will mean further falling to 1.2255.

USDCAD

Article By RoboForex.com

Attention!
Forecasts presented in this section only reflect the author’s private opinion and should not be considered as guidance for trading. RoboForex LP bears no responsibility for trading results based on trading recommendations described in these analytical reviews.

The Analytical Overview of the Main Currency Pairs on 2021.11.12

by JustForex

The EUR/USD currency pair

Technical indicators of the currency pair:
  • Prev Open: 1.1475
  • Prev Close: 1.1449
  • % chg. over the last day: -0.23%

Europe’s GDP forecasts continue to fall as the economic recovery slows and the number of Covid cases reaches an all-time high. The German government’s economic advisory group lowered its 2021 economic growth forecast to 2.7%. Eurozone inflation could exceed forecasts if supply chain disruptions persist.

Trading recommendations
  • Support levels: 1.1436
  • Resistance levels: 1.1535, 1.1573, 1.1613, 1.1645, 1.1667, 1.1717, 1.1772

From the technical point of view, the EUR/USD on the hour time frame is bearish. The MACD indicator has become negative, but there is a divergence on the higher time frames. Under such market conditions, traders should consider sell positions from the resistance levels near the moving average, as the price has deviated strongly from the averages. Buy trades should be considered only from the support levels of the higher time frame, given the buyer’s initiative.

Alternative scenario: if the price breaks out through the 1.1573 resistance level and fixes above, the mid-term uptrend will likely resume.

EUR/USD
News feed for 2021.11.12:
  • – Eurozone Industrial Production (m/m) at 12:00 (GMT+2);
  • – US JOLTs Job Openings (m/m) at 17:00 (GMT+2);
  • – US Michigan Consumer Sentiment (m/m) at 17:00 (GMT+2);
  • – US FOMC Member Williams’s Speech at 19:10 (GMT+2).

The GBP/USD currency pair

Technical indicators of the currency pair:
  • Prev Open: 1.3403
  • Prev Close: 1.3365
  • % chg. over the last day: -0.28%

UK GDP growth for the quarter was only 1.3% (forecast 1.5%, previous 5.5%). Industrial production data also showed a decline in activity. All these factors indicate a clear slowdown in the economy.

Trading recommendations
  • Support levels: 1.3360
  • Resistance levels: 1.3508, 1.3616, 1.3685, 1.3748, 1.3780, 1.3831, 1.3886

On the hourly time frame, the trend on GBP/USD is bearish. The MACD indicator has become negative, but there is a divergence on the higher time frames. Under such market conditions, traders should consider sell positions from the resistance levels near the moving average, as the price has deviated strongly from the averages. Buy trades should be considered only from the support levels of the higher time frame, given the buyer’s initiative.

Alternative scenario: if the price breaks out through the 1.3617 resistance level and consolidates above, the bullish scenario will likely resume.

GBP/USD
There is no news feed for today.

The USD/JPY currency pair

Technical indicators of the currency pair:
  • Prev Open: 113.90
  • Prev Close: 114.06
  • % chg. over the last day: +0.14%

At the moment, there are no fundamental reasons for the USD/JPY quotes to go down in the mid-term, as the Bank of Japan has kept its monetary policy soft until the end of the year. At the same time, the Fed is already cutting QE and is likely to accelerate cuts due to a sharp rise in inflation. Also, Japan’s new government will present a new tens of billions of dollars stimulus program in the coming days, which will eventually lead to a lower national exchange rate.

Trading recommendations
  • Support levels: 113.42, 112.95, 112.30, 111.53, 110.99, 110.65
  • Resistance levels: 114.48, 115.15

The global trend on the USD/JPY currency pair is bullish. The local trend has also changed to upward. But the MACD indicator shows a divergence, which suggests that a technical correction downwards should be expected soon. Under such market conditions, it’s better to look for buy positions from the buyers’ initiative zone near the moving average. Sell positions should be considered from the resistance levels of higher time frames, given there is sellers’ initiative, but only with short targets.

Alternative scenario: if the price falls below 112.30, the uptrend will likely be broken.

USD/JPY
There is no news feed for today.

The USD/CAD currency pair

Technical indicators of the currency pair:
  • Prev Open: 1.2493
  • Prev Close: 1.2579
  • % chg. over the last day: +0.69%

The Canadian dollar is a commodity currency, so the USD/CAD currency pair highly depends on the dynamics of the dollar index and oil prices. Against the inflation growth in the USA, the dollar index is increasing, while oil quotes are decreasing. As a result, the USD/CAD are showing steady growth.

Trading recommendations
  • Support levels: 1.2564, 1.2496, 1.2456, 1.2417, 1.2388
  • Resistance levels: 1.2628, 1.2729, 1.2774

From a technical point of view, the trend of the USD/CAD currency is bullish. The MACD indicator is in the positive zone, but there are signs of overbought. Under such market conditions, it is better to look for buy trades from the support levels near the moving average, as the price has deviated strongly from its averages. Sell deals should be considered from the resistance levels of the higher time frame.

Alternative scenario: if the price breaks down through the 1.2388 support level and fixes below, the downtrend will likely resume.

USD/CAD
There is no news feed for today.

by JustForex


This article reflects a personal opinion and should not be interpreted as an investment advice, and/or offer, and/or a persistent request for carrying out financial transactions, and/or a guarantee, and/or a forecast of future events.

What a week for the buck!

By The Market Research Team, ForexTime

The hot US CPI print is still reverberating around markets. US bond markets were closed yesterday for Veteran’s Day. That means there will be some focus on treasury markets on the last trading of the week. Weekly closes are always important, especially after such a major data shock.

The dollar has continued its ascent, rising to 16-month highs and is poised for its best week in almost five months. This has seen oil prices dip as it grapples with a stronger dollar. Other commodities like copper are also lower. A stronger dollar makes greenback-priced metals more expensive to holders of other currencies.

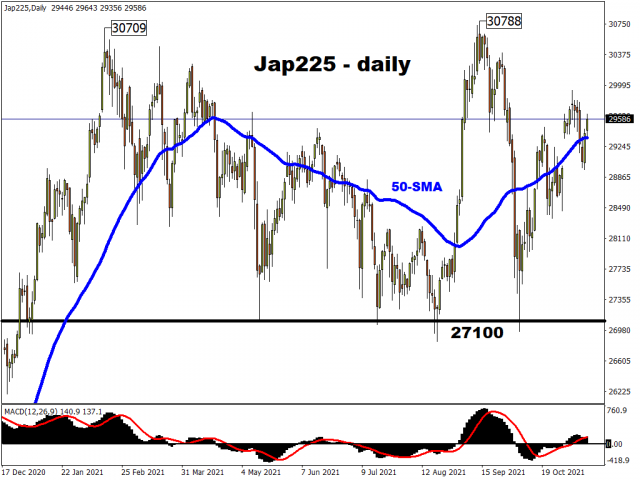
Stock markets closed mixed on Wall Street, while Asian indices are also closing the week in a similar fashion. Evergrande concerns are weighing on Chinese markets, but the Nikkei has ended higher underpinned by tech stocks and brisk earnings.  Japanese shares have lagged behind global market and their valuations are low compared with other countries.


Gold bugs enjoying the limelight

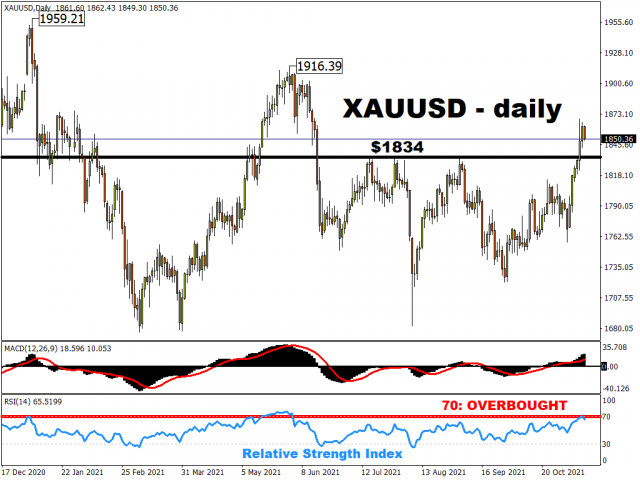
After gold smashed through resistance at $1834, prices remain near the recent highs around $1860. Major support has come in the form of US 10-year real yields falling to record lows at minus 1.25%. Of course, the bumper US inflation has also seen the dollar surge, with traders raising US rate hike expectations for next year.

The precious metal has pull backed overnight. Momentum oscillators are nearing overbought territory so a healthy pause for breath should be constructive. The key upside target is the June high at $1916.


Crude oil falls again

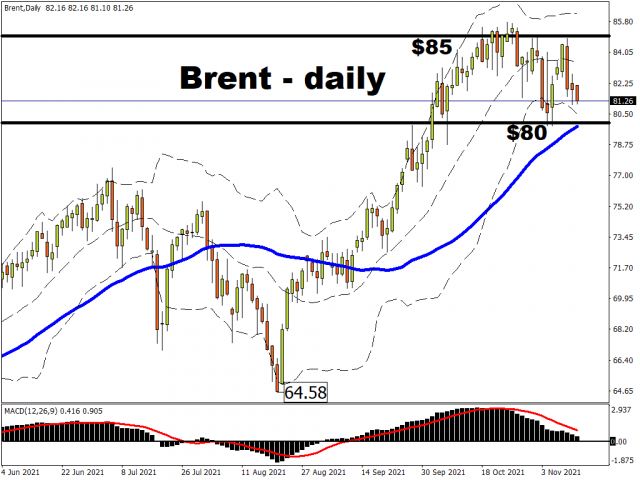
After finding resistance near the recent highs, both WTI and Brent look like they are settling into a wide range. The latest weakness has been driven by President Biden’s statement that reversing inflation has become a top priority, especially in energy. Measures that could be introduced include the release of US Strategic Petroleum Reserves and even banning exports. Lower gas prices in Europe, as Russia finally increases supply, are also adding to downside pressures. This is likely to reduce gas-to-oil demand.

Lows around $80 should hold prices while the top of the recent range comes in at $85.77. OPEC released its latest monthly market report yesterday. This saw only marginal changes to supply and demand estimates for both this year and next. As a result, the report was fairly neutral for the market.


Disclaimer: The content in this article comprises personal opinions and should not be construed as containing personal and/or other investment advice and/or an offer of and/or solicitation for any transactions in financial instruments and/or a guarantee and/or prediction of future performance. ForexTime (FXTM), its affiliates, agents, directors, officers or employees do not guarantee the accuracy, validity, timeliness or completeness, of any information or data made available and assume no liability as to any loss arising from any investment based on the same.


Forex-Time-LogoArticle by ForexTime

ForexTime Ltd (FXTM) is an award winning international online forex broker regulated by CySEC 185/12 www.forextime.com

A sharp increase in the dollar index may provoke capital outflows from stock and bond markets and weaken other currencies

by JustForex

The US stock indices traded yesterday without a single trend. The Dow Jones index decreased by 0.44%, the S&P 500 added 0.06% and the Nasdaq technology increased by 0.52%. The dollar is strengthening due to the expectation of a rate hike soon after the Fed ends its stimulative bond buying cuts. This risks triggering capital outflows from emerging market assets, while negatively affecting stocks, bonds, and other currencies.

On Thursday, US President Joe Biden signed a law preventing companies such as Huawei Technologies Co and ZTE Corp, considered security threats, from getting licenses for their new equipment from US regulators.

Major European stock indexes mostly rose yesterday. The British FTSE 100 increased by 0.6%, Germany’s DAX and France’s CAC 40 added 0.1%, and 0.2%, Italy’s FTSE MIB increased by 0.3%, only Spain’s IBEX decreased by 0.5%.

According to the survey of economists, the inflation rate in the Eurozone is expected to be 3.1% in the 1st quarter, 2.7% in the 2nd quarter, and 2.1% in the 3rd quarter of 2022 (against 2.5%, 2.2%, and 1.6% in the previous forecast, respectively). Inflation in the Eurozone may exceed forecasts if supply chain disruptions persist.

The European Union is discussing imposing sanctions against Russian Aeroflot because of the migration crisis on the Belarusian-Polish border. The United States and the United Kingdom may join the restrictive measures.

Gold increased to $1,865 an ounce Thursday, its highest since mid-June, as traders continue to buy gold actively as a hedge against inflation. But many analysts don’t see any further upside for gold as tighter monetary policy drives up government bond yields, which as a rule, tend to decrease precious metal prices.

Commercial oil inventories increased by 18.5 million barrels in September but were still 163 million barrels lower than 2015-2019. According to Bloomberg analysts, Russia and the US will increase oil supplies in 2022.

Yesterday, Asian stock indexes traded flat after Chinese real estate developer Evergrande could avoid default. China Evergrande Group must pay another $366 million in interest payments on its obligations. Evergrande was able to prevent default with payments at the last minute overdue bonds on Wednesday. However, Evergrande is far from successful as it strives to sell its own assets to try to get ahead of its payment schedule. The company raised $144 million in recent days by selling its stake in the Internet company Hengten Networks Group.

Hong Kong’s Hang Seng technology index Increased by 2% in morning trading. Shares of Alibaba in Hong Kong added 0.74% after orders rose to $84.54 billion in the 11.11 sale as compared to 74 billion dollars a year ago.

Goldman Sachs has become more optimistic about Chinese stocks affected by a series of regulatory shocks and the debt crisis of the real estate sector this year, as Beijing is going to ease regulatory pressure on the economy.

Main market quotes:

S&P 500 (F) 4,649.27 +2.56 (+0.055%)

Dow Jones 35,921.23 −158.71 (−0.40%)

DAX 16,083.11 +15.28 (+0.095%)

FTSE 100 7,384.18 +44.03 (+0.60%)

USD Index 95.18 +0.33 (+0.34%)

Important events for today:
  • – China Unemployment Rate (m/m) at 04:30 (GMT+2);
  • – Eurozone Industrial Production (m/m) at 12:00 (GMT+2);
  • – US JOLTs Job Openings (m/m) at 17:00 (GMT+2);
  • – US Michigan Consumer Sentiment (m/m) at 17:00 (GMT+2);
  • – US FOMC Member Williams’s Speech at 19:10 (GMT+2).

by JustForex


This article reflects a personal opinion and should not be interpreted as an investment advice, and/or offer, and/or a persistent request for carrying out financial transactions, and/or a guarantee, and/or a forecast of future events.

Forex Technical Analysis & Forecast 11.11.2021

Article By RoboForex.com

EURUSD, “Euro vs US Dollar”

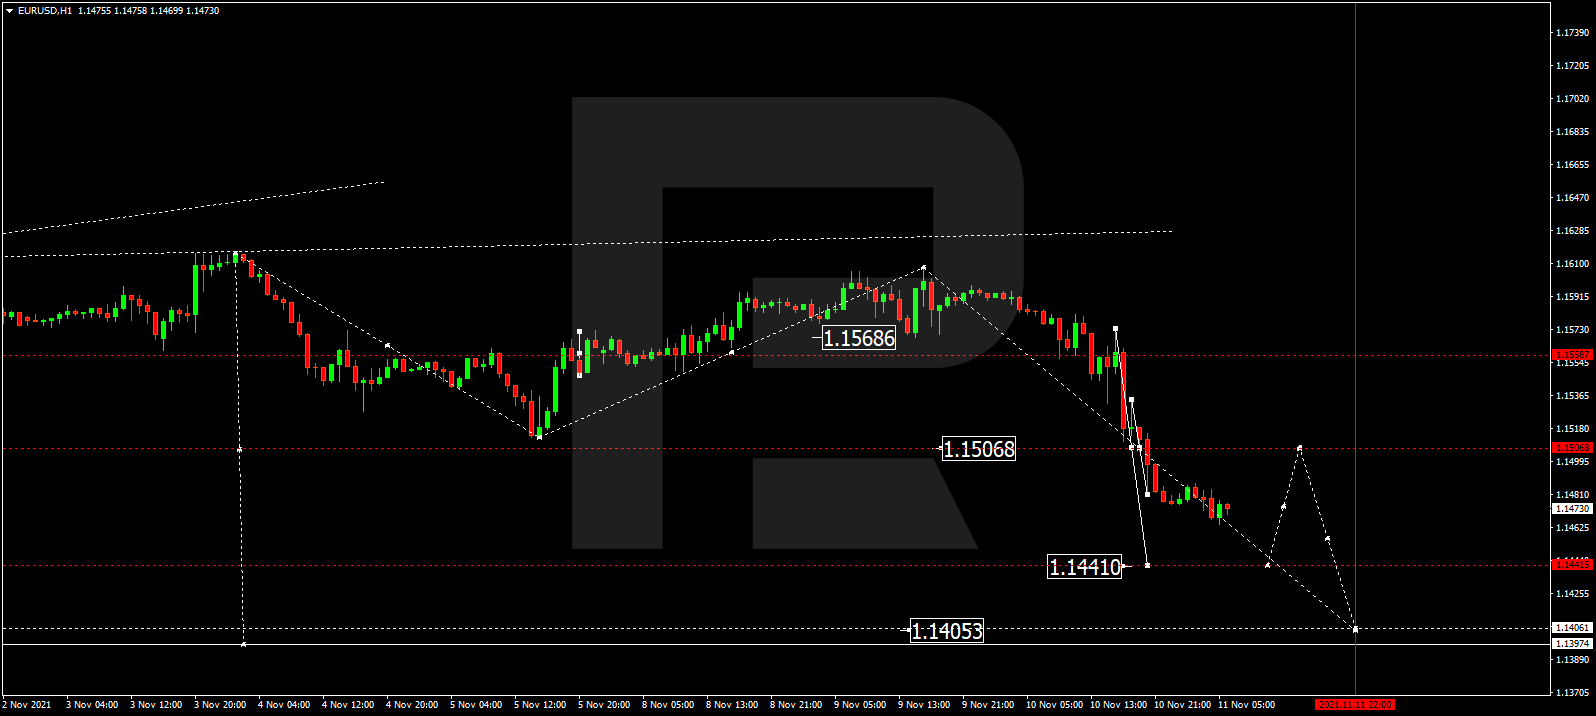
The currency pair has formed a consolidation range around 1.1560, and with an escape downwards, the wave of decline is likely to develop to 1.1441. After this level is reached, there might follow a link of correction to 1.1550 (a test from below). Then a decline to 1.1404 can follow.

EURUSD
Risk Warning: the result of previous trading operations do not guarantee the same results in the future

GBPUSD, “Great Britain Pound vs US Dollar”

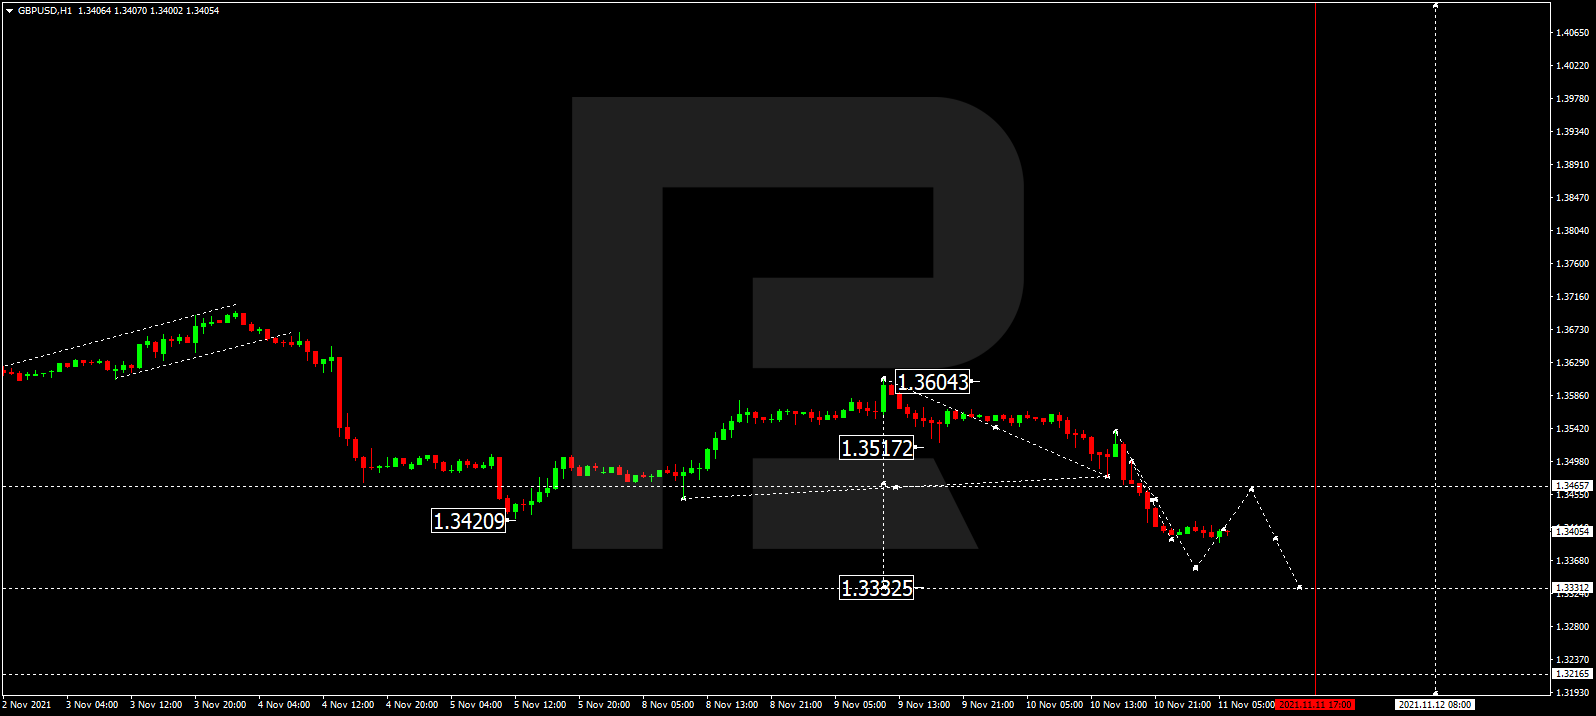
The currency pair has broken through 1.3484 and goes on developing a wave of decline to 1.1333. After this level is reached, a link of correction to 1.3480 might follow, then – a decline to 1.3220.

GBPUSD
Risk Warning: the result of previous trading operations do not guarantee the same results in the future

USDRUB, “US Dollar vs Russian Ruble”

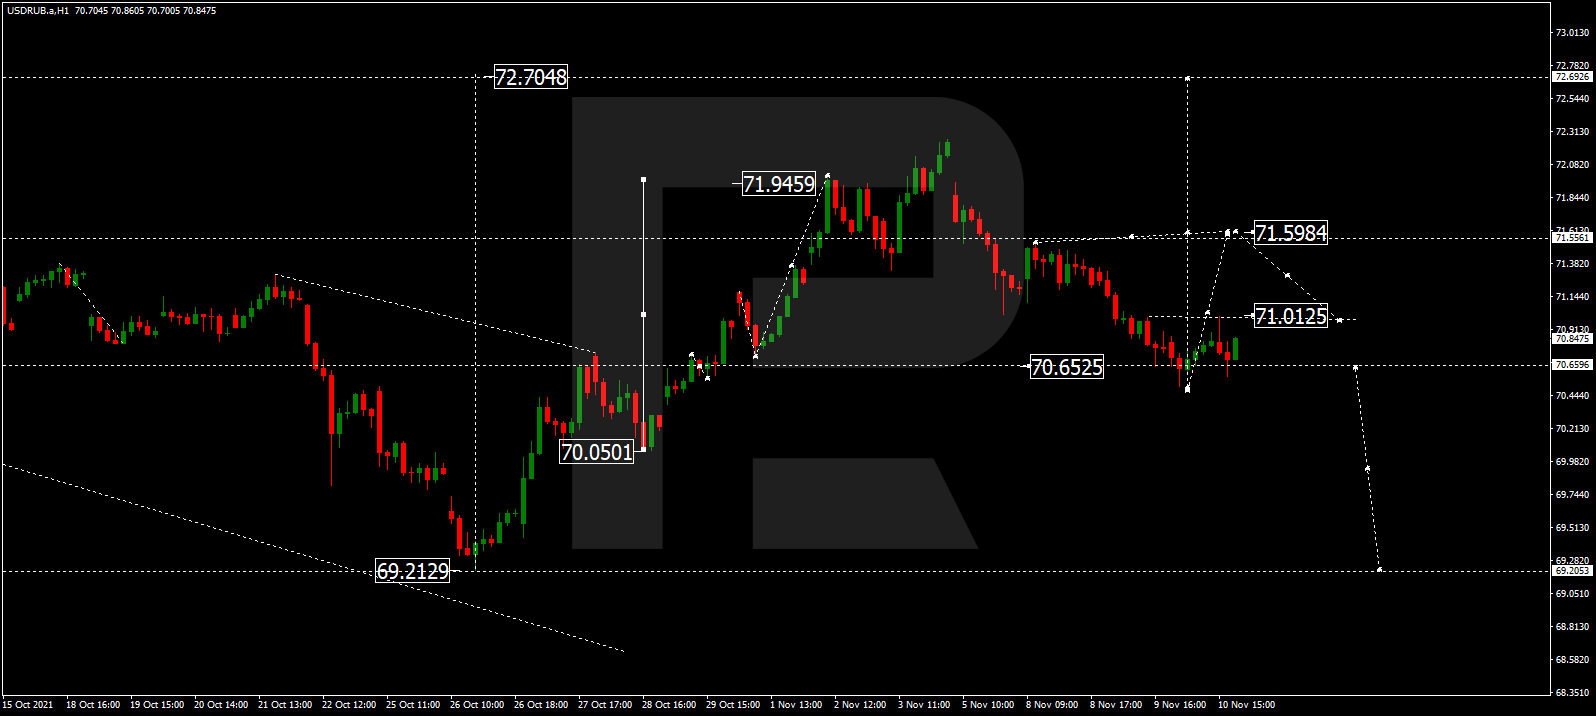
The currency pair formed a consolidation range around 70.65. Today it can grow to 71.60, then decline to 71.00. At these levels, a new consolidation range is to form. With an escape upwards, growth to 72.70 can follow. With an escape downwards – a pathway to 69.22.

USDRUB
Risk Warning: the result of previous trading operations do not guarantee the same results in the future

USDJPY, “US Dollar vs Japanese Yen”

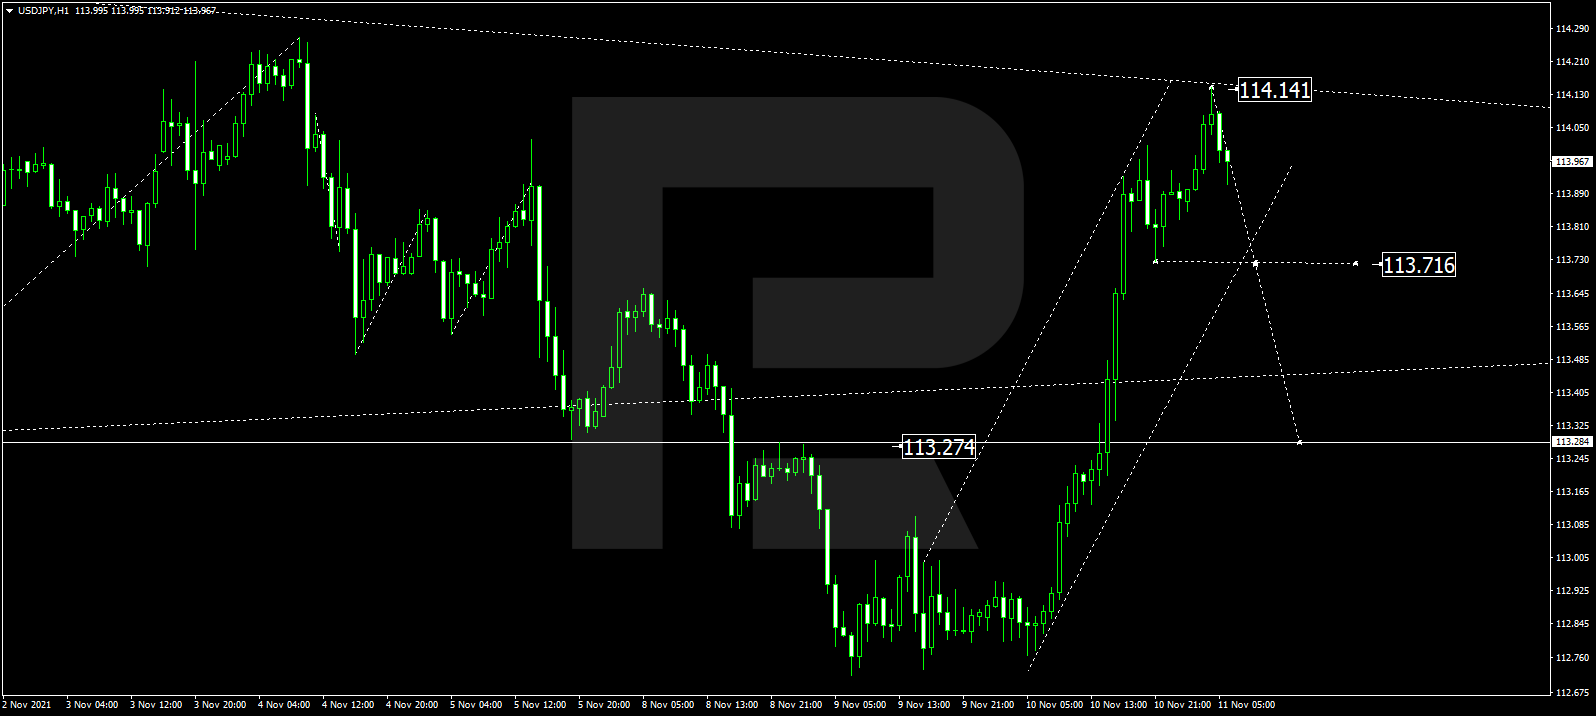
The currency pair completed a wave of growth to 114.14. Today a wave of decline is to develop towards 113.71, followed by growth to 113.90. Practically, a new consolidation range is to form at these levels. With an escape downwards, the quotations can fall to 112.80. With an escape upwards, a pathway to 115.50 can open.

USDJPY
Risk Warning: the result of previous trading operations do not guarantee the same results in the future

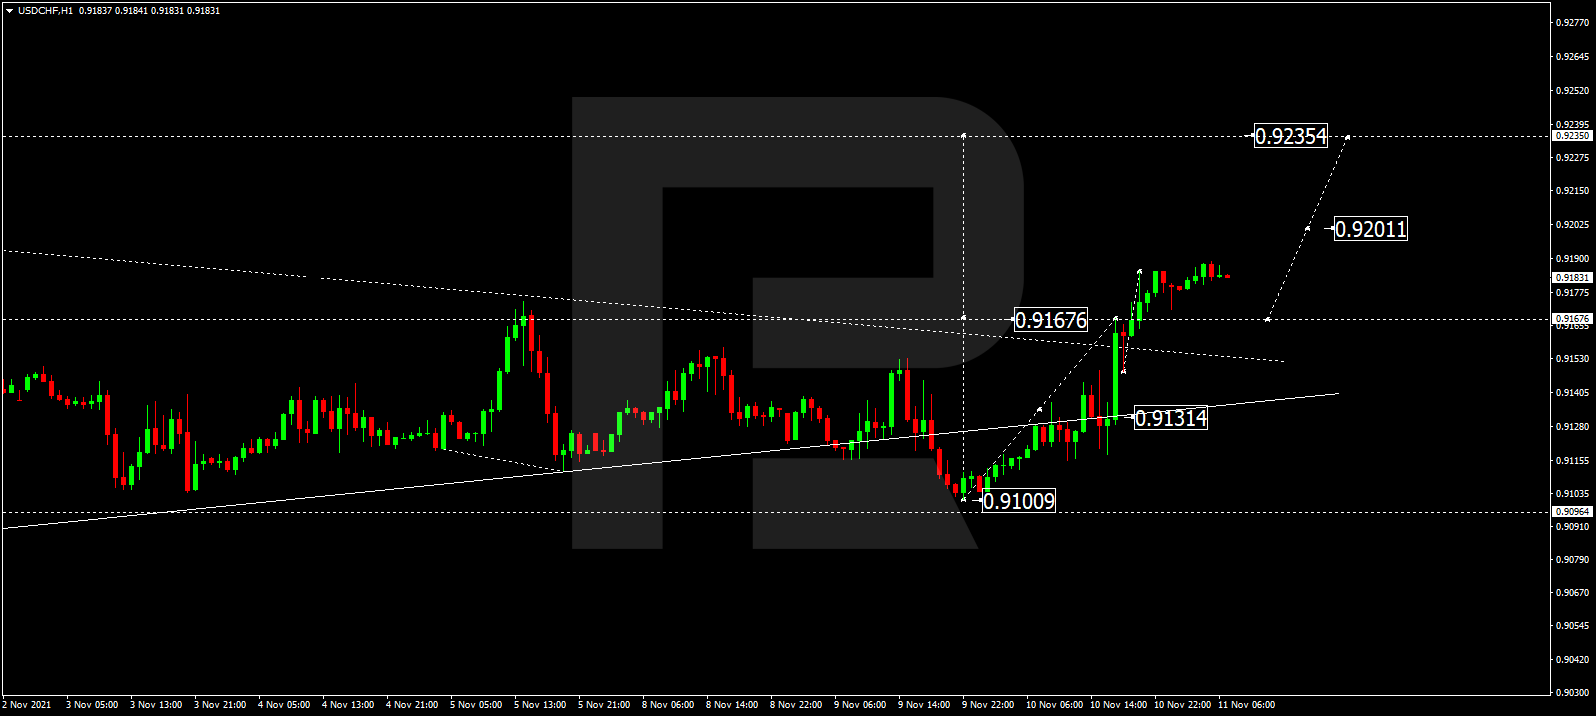
USDCHF, “US Dollar vs Swiss Franc”

The currency pair has completed a wave of growth to 0.9187. A consolidation range formed around this level. With an escape upwards, a pathway to 0.9200 will open. With a breakaway of this level upwards, the trend can continue to 0.9235.

USDCHF
Risk Warning: the result of previous trading operations do not guarantee the same results in the future

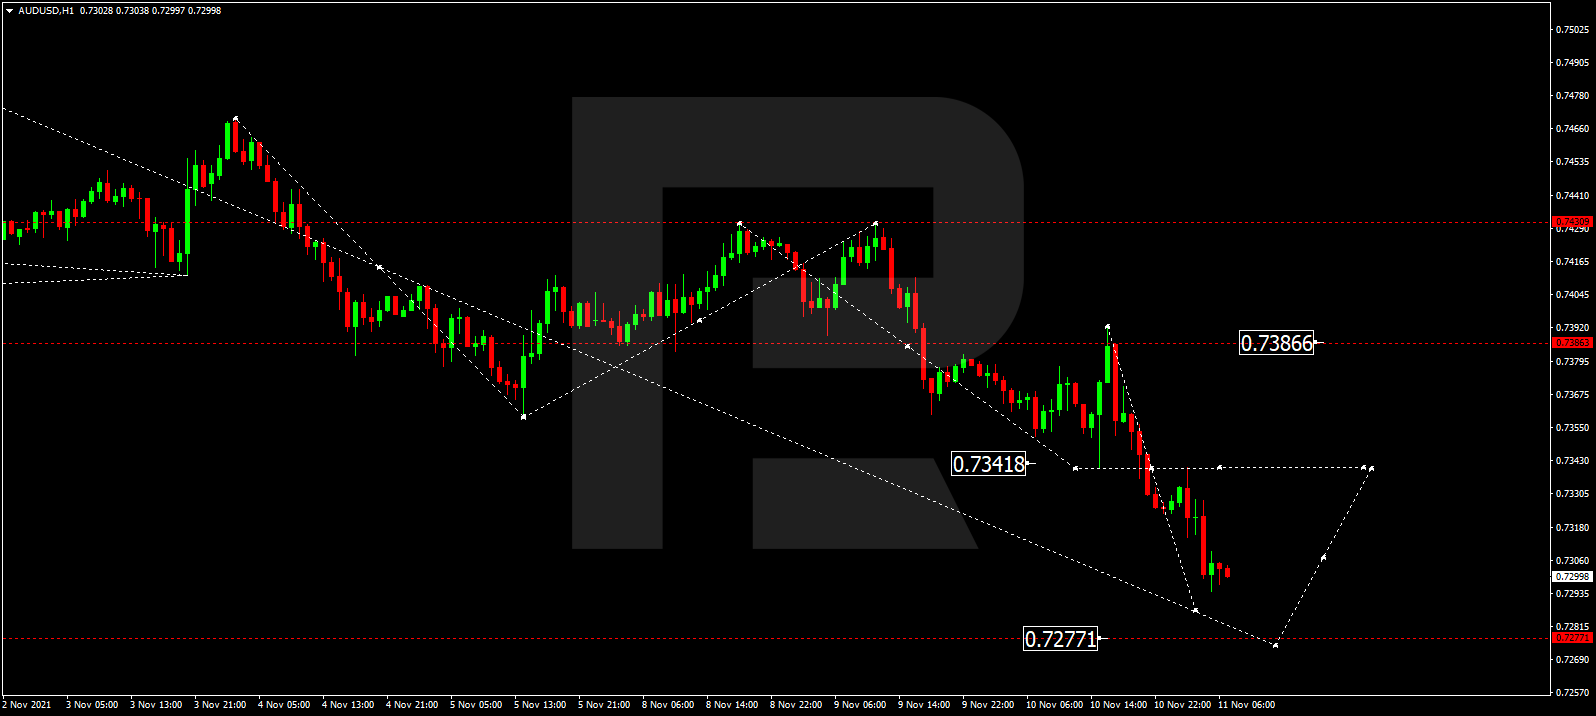
AUDUSD, “Australian Dollar vs US Dollar”

The currency pair bounced off 0.7386 downwards and is trading in a wave of decline to 0.7277. After this level is reached, a correction to 0.7343 can begin.

AUDUSD
Risk Warning: the result of previous trading operations do not guarantee the same results in the future

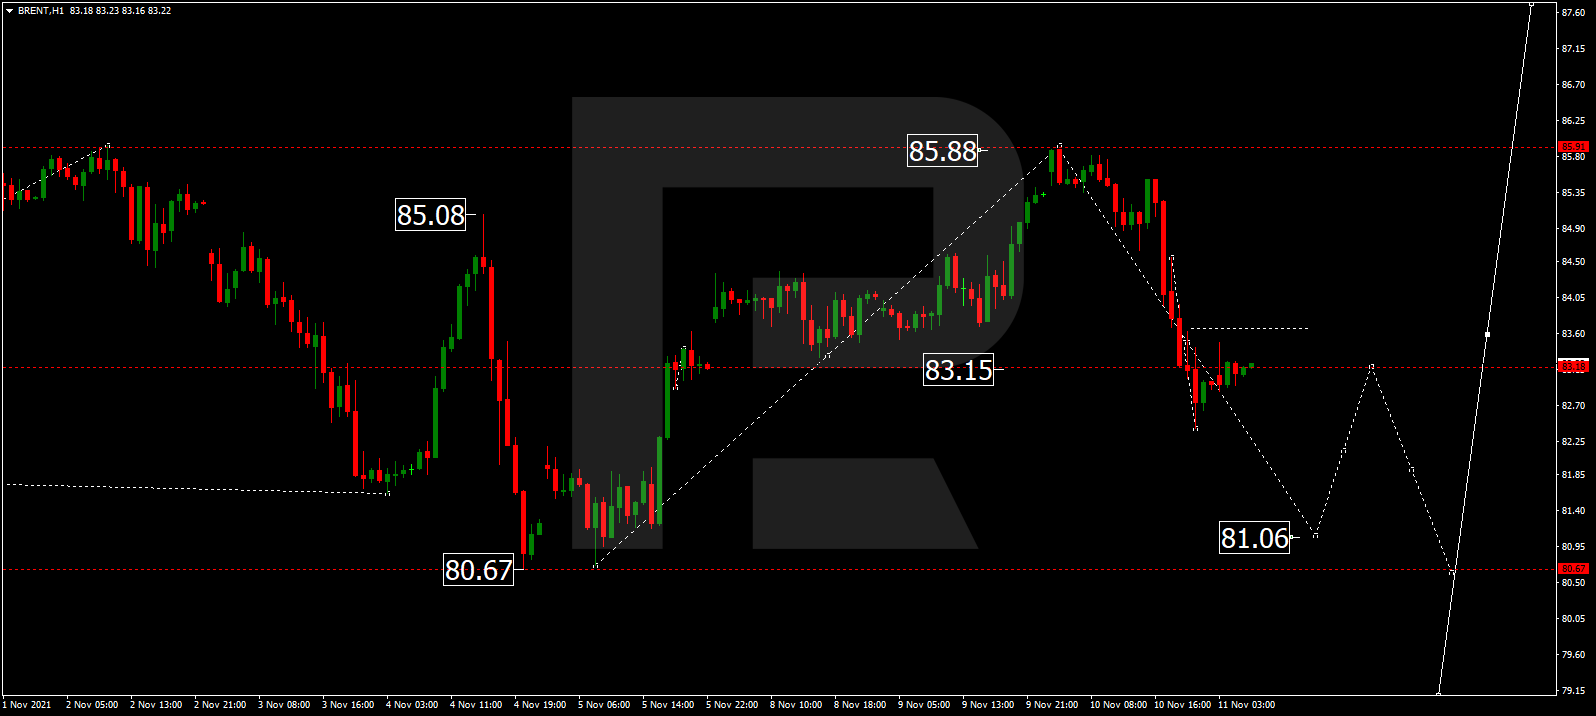
BRENT

Oil performed a wave of decline to 83.15. Today the pair is trading in a consolidation range around this level. With an escape downwards, a pathway to 81.06 can open. Then a link of correction to 83.15 can follow, and then – a decline to 79.00.

BRENT
Risk Warning: the result of previous trading operations do not guarantee the same results in the future

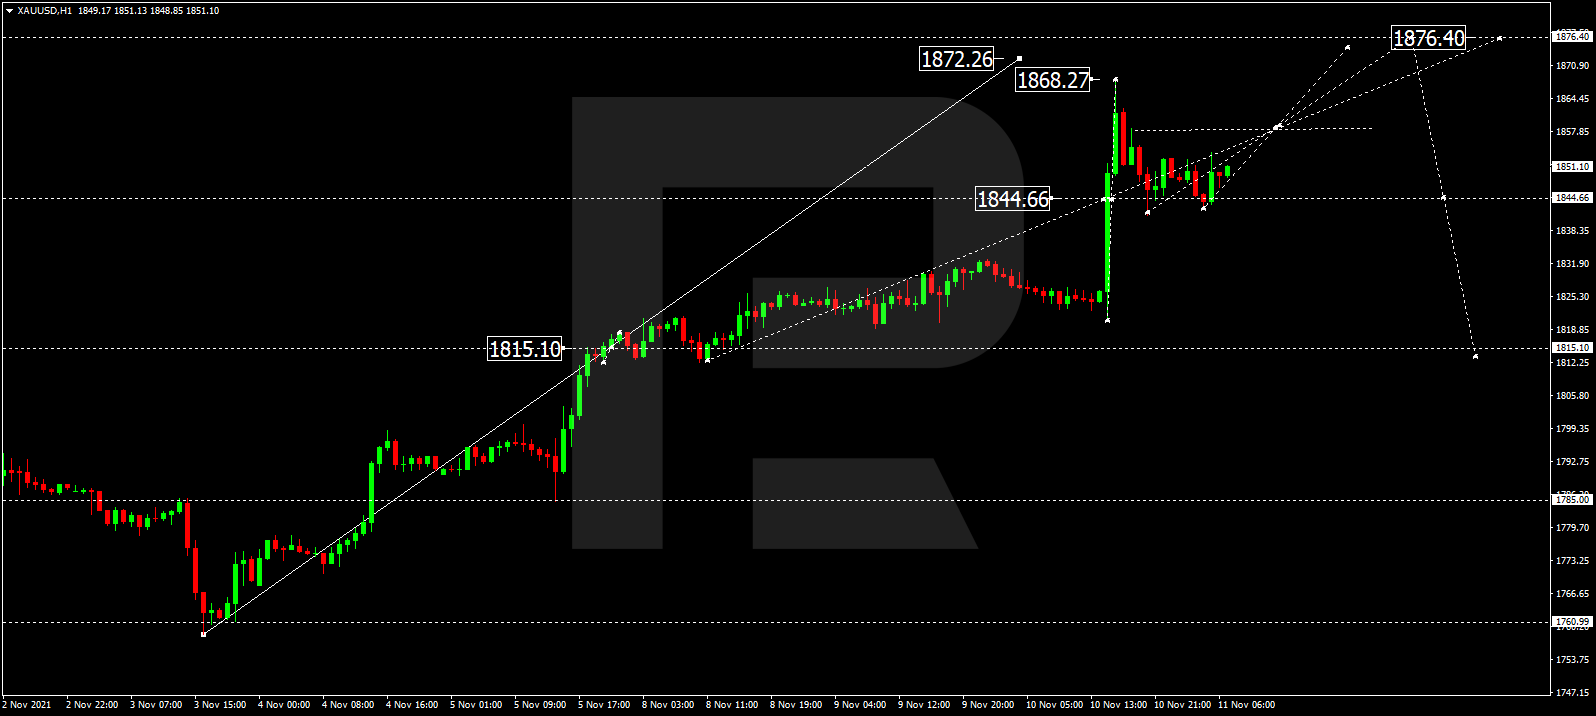
XAUUSD, “Gold vs US Dollar”

Gold performed a wave of growth to 1868.26 and a correction to 1844.66. Today a link of growth to 1857.85 can follow. If this level is broken away upwards, growth to 1876.40 can happen. An in case of a decline and a breakaway of 1844.00 downwards, a pathway to 1815.00 can happen.

GOLD
Risk Warning: the result of previous trading operations do not guarantee the same results in the future

S&P 500

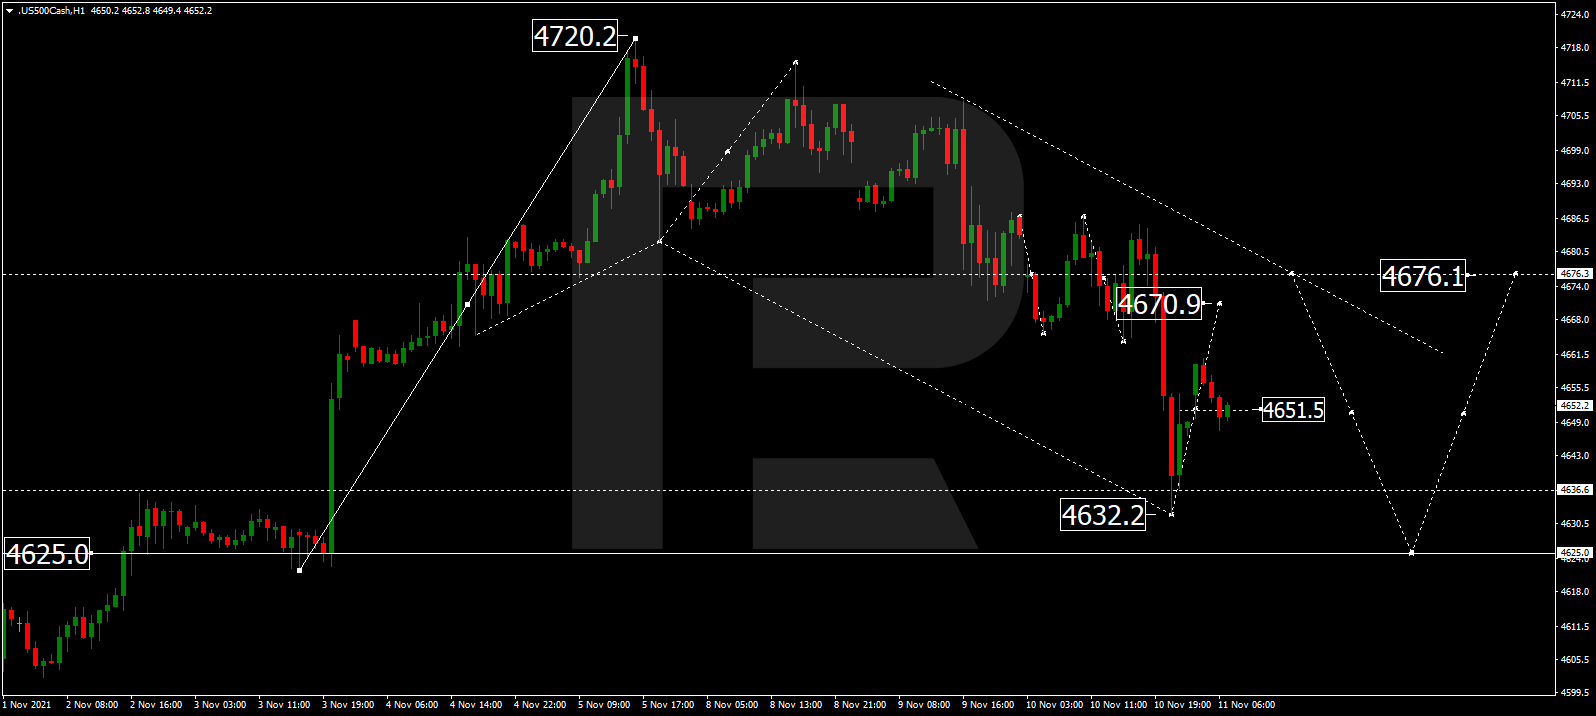
The stock index performed a wave of decline to 4632.2. Today the market performed a wave of growth to 4651.5. At a moment, the market is forming a consolidation range around it. We expect a link of growth to 4676.0 and then – a link of decline to 4625.0.

S&P 500

Article By RoboForex.com

Attention!
Forecasts presented in this section only reflect the author’s private opinion and should not be considered as guidance for trading. RoboForex LP bears no responsibility for trading results based on trading recommendations described in these analytical reviews.

Fibonacci Retracement Analysis 11.11.2021 (Brent, Dow Jones)

Article By RoboForex.com

Brent

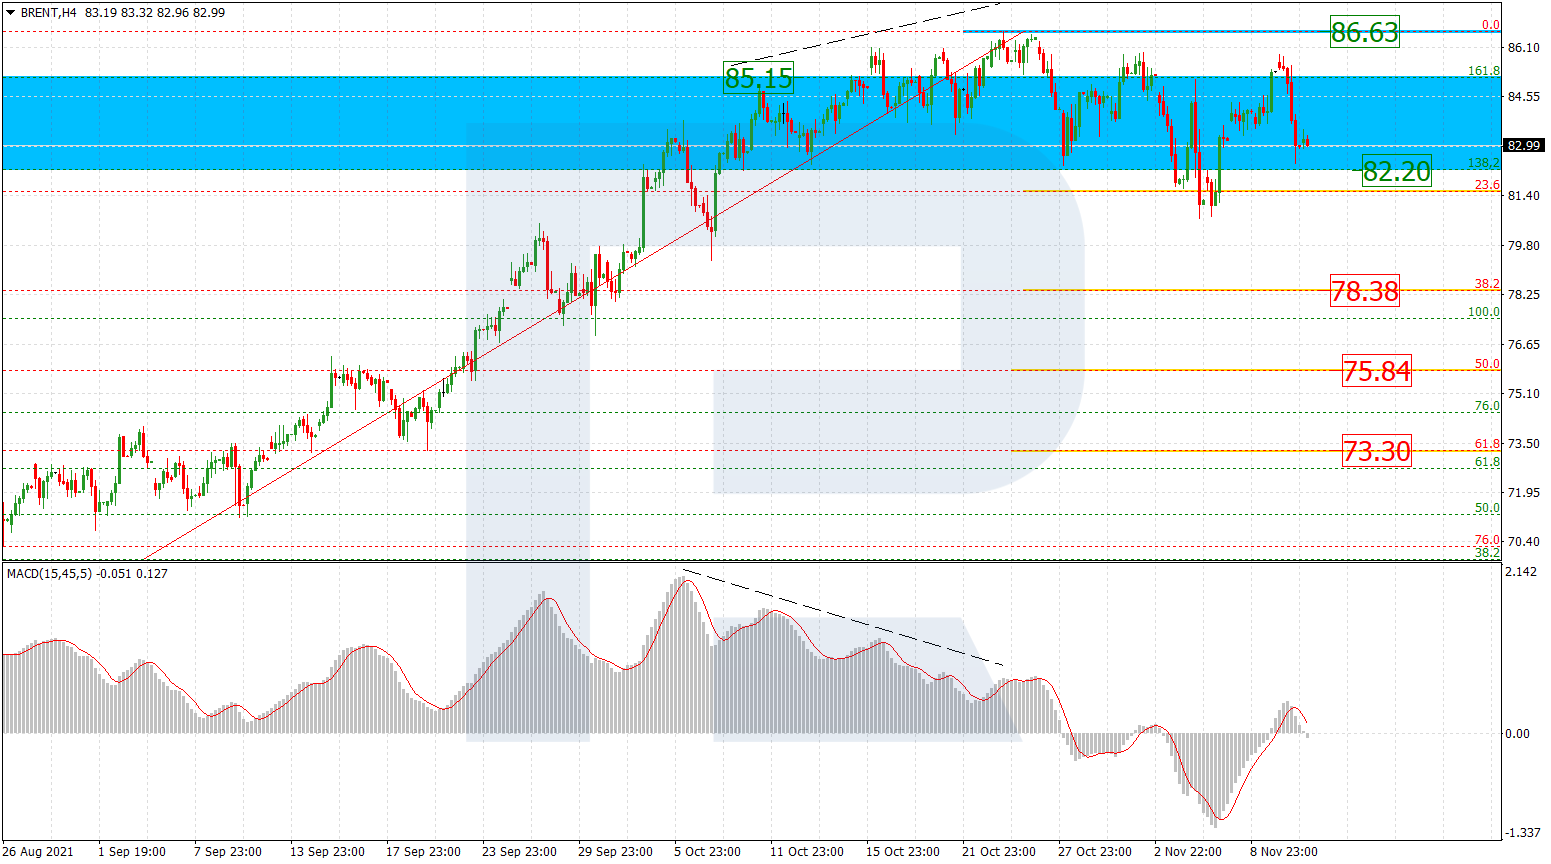
On H4, after the quotations rose to the post-correctional extension area of 138.2-161.8% (82.20-85.15) Fibo, a divergence formed. This divergence signals about a pullback, and the first wave of the correctional decline already reached 23.6%. Subsequent growth tried to bring the quotations to 86.63, but the market was not powerful enough to accomplish it. The new impulse of decline can head for 38.2% (78.38), 50.0% (75.84), and 61.8% (73.30).

BRENT_H4
Risk Warning: the result of previous trading operations do not guarantee the same results in the future

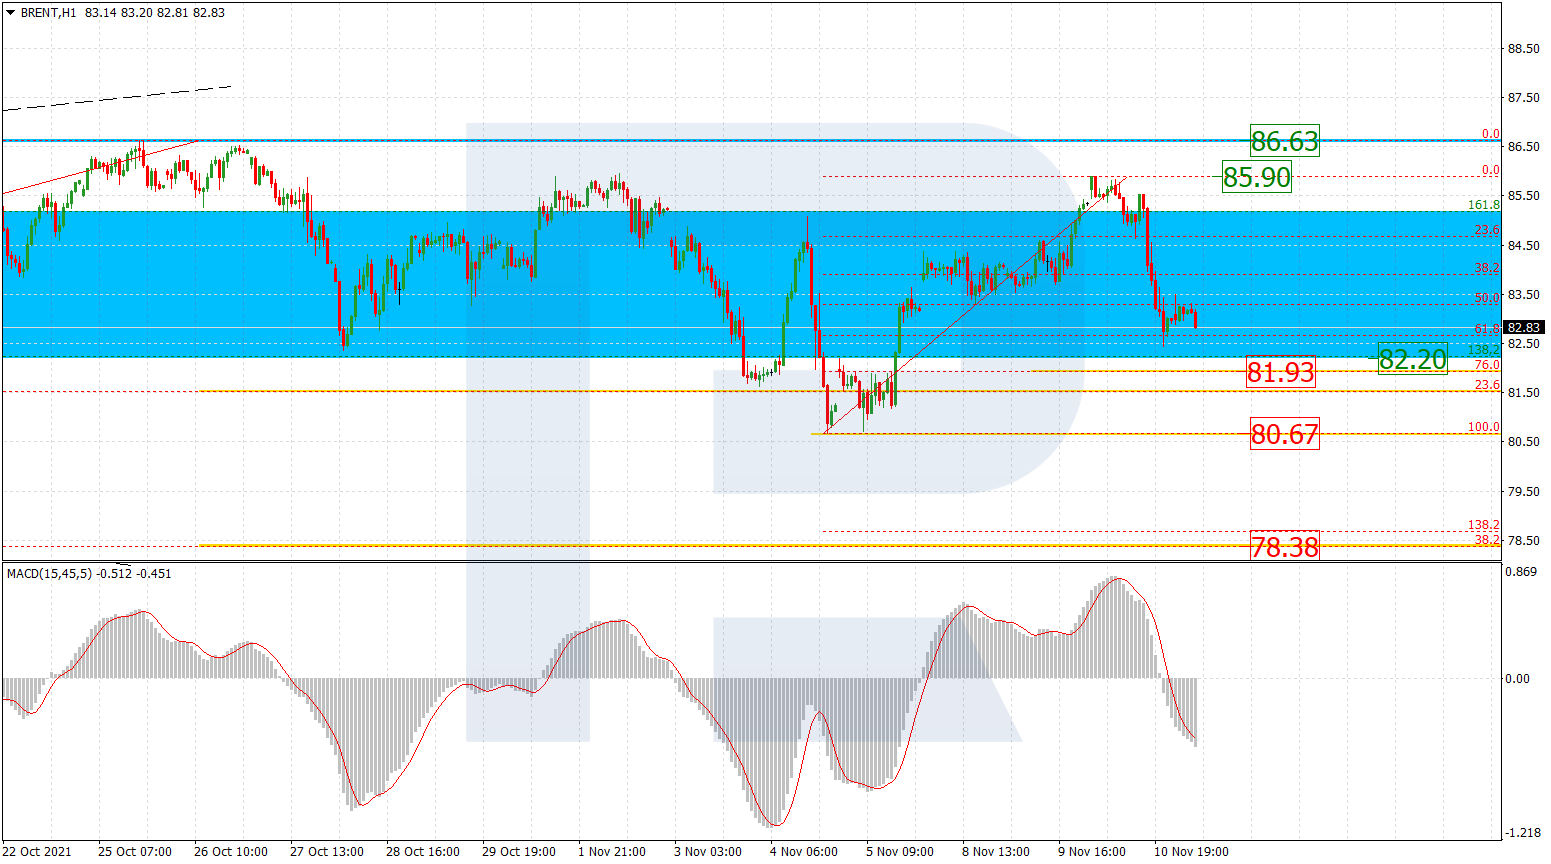
On H1, the decline after growth can be seen in more details. The quotations tested 61.8% and can drop to 76.0% (81.93) Fibo. However, the main goal will be the local low of 80.67. A breakaway of the low will open a pathway to medium-term goals.

BRENT_H1
Risk Warning: the result of previous trading operations do not guarantee the same results in the future

Dow Jones

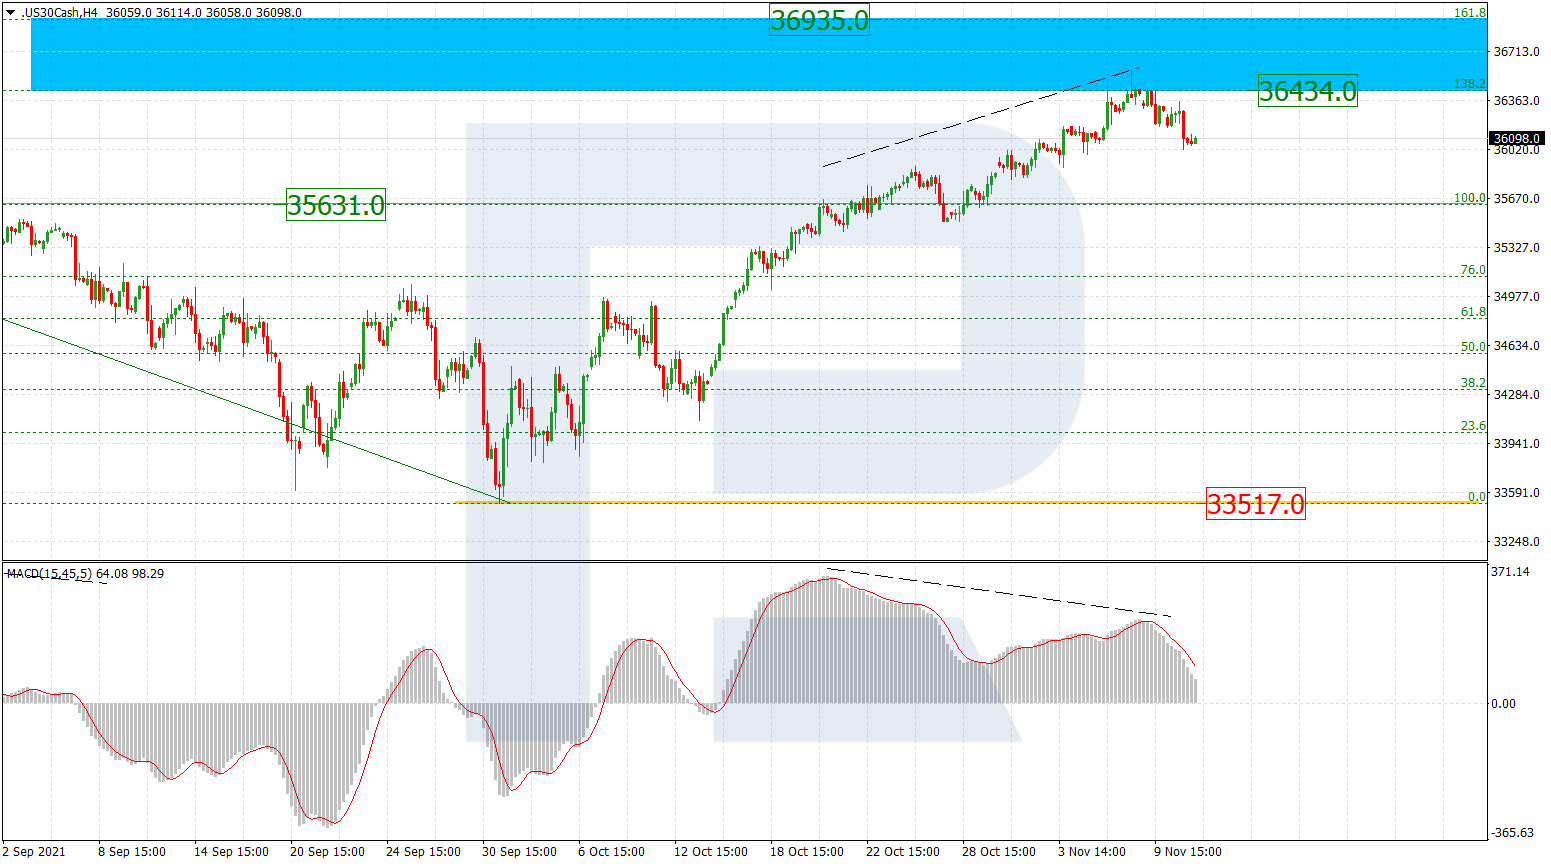
On H4, upon testing the lower border of the post-correctional extension area of 138.2-161.8% (36434.0-36935.0) Fibo, a divergence on the MACD formed, as a signal for a pullback. The fractal low of 33517.0 is the main support.

US30CASH_H4
Risk Warning: the result of previous trading operations do not guarantee the same results in the future

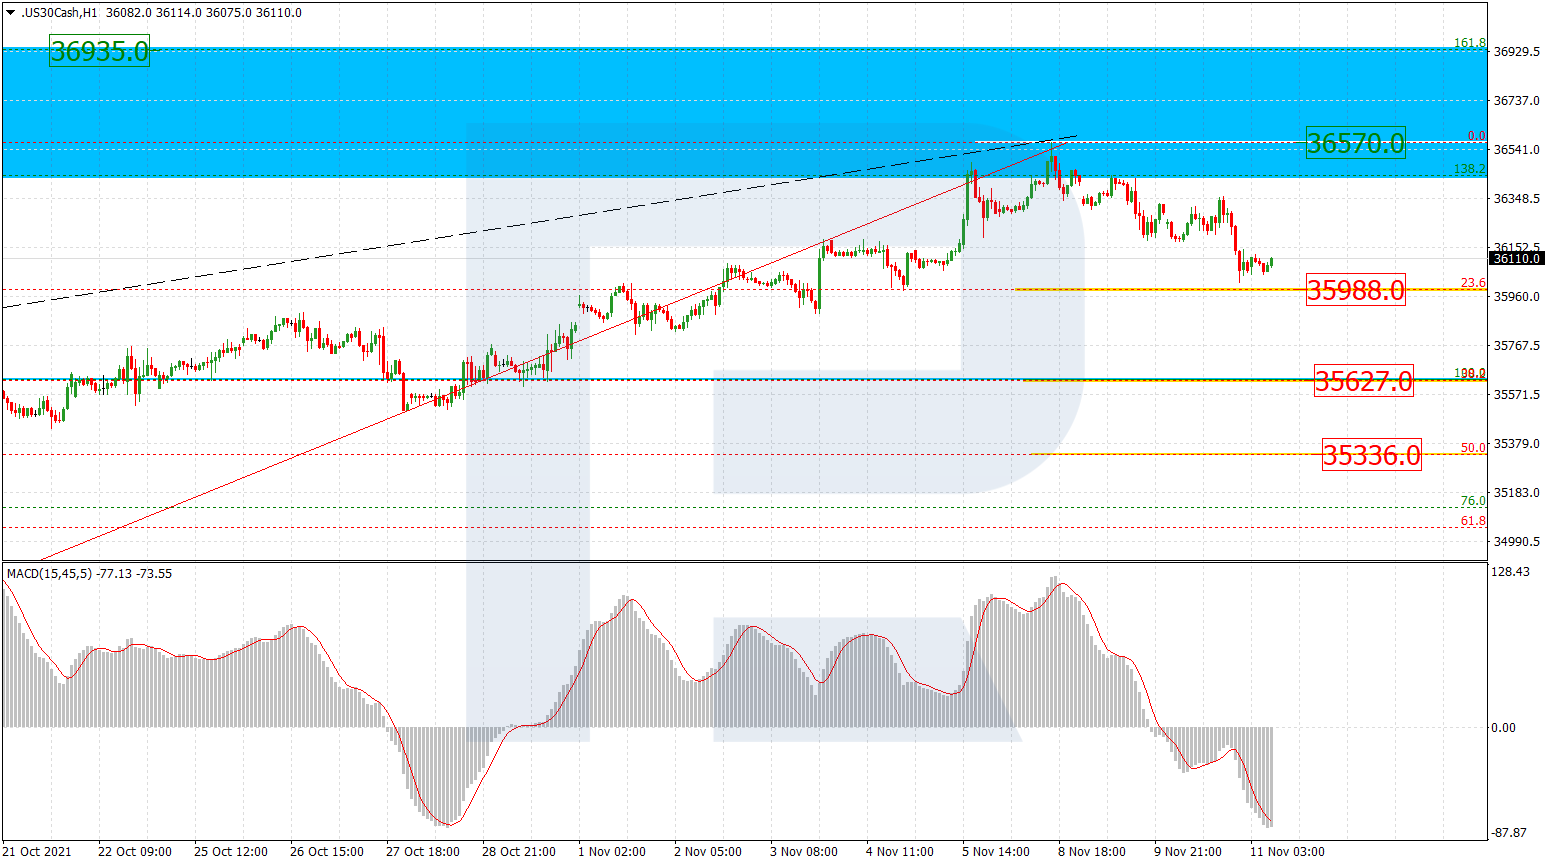
On H1, the goals of the decline after the divergence on the MACD are visible. The declining wave is ready to test 23.6% (35988.0), and after a breakaway, it can head for 38.2% (35627.0) and 50.0% (35336.0) Fibo. A breakaway of the current high of 36570.0 will signal the continuation of the uptrend.

DJI

Article By RoboForex.com

Attention!
Forecasts presented in this section only reflect the author’s private opinion and should not be considered as guidance for trading. RoboForex LP bears no responsibility for trading results based on trading recommendations described in these analytical reviews.

The Analytical Overview of the Main Currency Pairs on 2021.11.11

by JustForex

The EUR/USD currency pair

Technical indicators of the currency pair:
  • Prev Open: 1.1592
  • Prev Close: 1.1476
  • % chg. over the last day: -1.16%

The consumer price index in Germany increased to 4.6% in annual terms. And with a sharp rise in inflation in the US, the dollar index sharply increased, which had a negative impact on the European currency. It’s a bank holiday in the United States today, which will allow the market to calm down a bit, and the volatility in the American session will sharply decrease.

Trading recommendations
  • Support levels: 1.1453
  • Resistance levels: 1.1535, 1.1573, 1.1613, 1.1645, 1.1667, 1.1717, 1.1772

From the technical point of view, the EUR/USD on the hour time frame is bearish. The MACD indicator has become negative, but there is a divergence on the higher time frames. Under such market conditions, traders should consider sell positions from the resistance levels near the moving average, as the price has deviated strongly from the averages. Buy trades should be considered only from the support levels of the higher timeframe, given the buyer’s initiative.

Alternative scenario: if the price breaks out through the 1.1573 resistance level and fixes above, the mid-term uptrend will likely resume.

EUR/USD
News feed for 2021.11.11:
  • – ECB Economic Forecasts at 12:00 (GMT+2).

The GBP/USD currency pair

Technical indicators of the currency pair:
  • Prev Open: 1.3556
  • Prev Close: 1.3402
  • % chg. over the last day: -1.14%

According to Uswitch, more than half of UK households will be unable to pay their winter energy bills and are at risk to have their heating turned off. The fuel supply crisis and high gas prices have hit consumers hard. The Bank of England’s borrowing data shows a surge in consumer lending. All of this suggests that consumer inflation will continue to rise through the winter. And this is a serious reason for the Bank of England to raise interest rates.

Trading recommendations
  • Support levels: 1.3360
  • Resistance levels: 1.3508, 1.3616, 1.3685, 1.3748, 1.3780, 1.3831, 1.3886

On the hourly time frame, the trend on GBP/USD is bearish. The MACD indicator has become negative, but there is a divergence on the higher time frames. Under such market conditions, traders should consider sell positions from the resistance levels near the moving average, as the price has deviated strongly from the averages. Buy trades should be considered only from the support levels of the higher timeframe, given the buyer’s initiative.

Alternative scenario: if the price breaks out through the 1.3617 resistance level and consolidates above, the bullish scenario will likely resume.

GBP/USD
News feed for 2021.11.11:
  • – UK GDP (q/q) at 09:00 (GMT+2);
  • – UK Industrial Production (m/m) at 09:00 (GMT+2);
  • – UK Manufacturing Production (m/m) at 09:00 (GMT+2).

The USD/JPY currency pair

Technical indicators of the currency pair:
  • Prev Open: 112.83
  • Prev Close: 113.90
  • % chg. over the last day: +0.95%

At the moment, there are no fundamental reasons for the USDJPY quotes to go down in the mid-term. It’s caused by that the Bank of Japan has kept its monetary policy soft until the end of the year. In addition, the Fed has been already cutting QE and is likely to accelerate cuts due to a sharp rise in inflation.

Trading recommendations
  • Support levels: 113.42, 112.95, 112.30, 111.53, 110.99, 110.65
  • Resistance levels: 114.48, 115.15

The global trend on the USD/JPY currency pair is bullish. The local trend has also changed to upward. Under such market conditions, it’s better to look for buy positions from the buyers’ initiative zone around the moving average. Sell positions should be considered from the resistance levels of higher time frames, given there is sellers’ initiative.

Alternative scenario: if the price falls below 112.30, the uptrend will likely be broken.

USD/JPY
News feed for 2021.11.11:
  • – Japan Industrial Production (m/m) at 04:00 (GMT+2).

The USD/CAD currency pair

Technical indicators of the currency pair:
  • Prev Open: 1.2436
  • Prev Close: 1.2493
  • % chg. over the last day: +0.46%

The Canadian dollar is a commodity currency, so the USD/CAD currency pair highly depends on the dynamics of the dollar index and oil prices. Yesterday, the dollar index sharply increased against the background of the inflation growth in the USA, which led to the sharp growth of USD/CAD quotes. In the medium term, only a sharp increase in oil prices or an increase in interest rates by the Bank of Canada can neutralize the growth of USD/CAD quotes.

Trading recommendations
  • Support levels: 1.2465, 1.2417, 1.2388, 1.2306, 1.2260
  • Resistance levels: 1.2518, 1.2565, 1.2628, 1.2729, 1.2774

From a technical point of view, the trend of the USD/CAD currency is bullish. The MACD indicator has become positive, with no signs of reversal. Under such market conditions, it is better to look for buy trades from the support levels, given there is the buyers’ initiative. Sell deals should be considered from the resistance levels of the higher time frame.

Alternative scenario: if the price breaks down through the 1.2388 support level and fixes below, the downtrend will likely resume.

USD/CAD
There is no news feed for today.

by JustForex


This article reflects a personal opinion and should not be interpreted as an investment advice, and/or offer, and/or a persistent request for carrying out financial transactions, and/or a guarantee, and/or a forecast of future events.

Morning after the night before….

By The Market Research Team, ForexTime

Markets are waking up to inflation numbers the like of which many of us have never seen before. US stock indices sold off with the Tech sector getting hit, especially after Elon Musk sold $5bn worth of Tesla stock.

The broader S&P500 experienced its worst day in more than a month. It also marked the first back-to-back decline in a month, after the index closed at a record high to start the week.  Asian markets are mixed with the Nikkei is supported by the yen’s weakness. European markets are lower while US futures are modestly in the green.

Team Transitory licking its wounds

Is the battle between policymakers and many market watchers finally over?

We all know the argument by now – the former believe price pressures are temporary due to supply bottlenecks and lingering pandemic issues that will ease in time.

The “inflationistas” are finally enjoying their moment in the sun after multi-decade high US CPI numbers.

There are a multitude of statistics flying about. We like the one the Atlanta Fed produces on flexible and “sticky” inflation. Prices of some goods adjust quickly. Others which take months are hard to reverse and what central bankers certainly want to avoid. Last month saw the sharpest rise in “sticky” prices since January 1991.

Dollar breakout in full effect

It’s Veterans Day holiday in the US which suggest liquidity will be lower than normal. But a narrative of inflation staying high and potentially heading higher (7% anyone?!), along with further employment gains and a Fed exiting loose policy more quickly should keep the dollar bid.

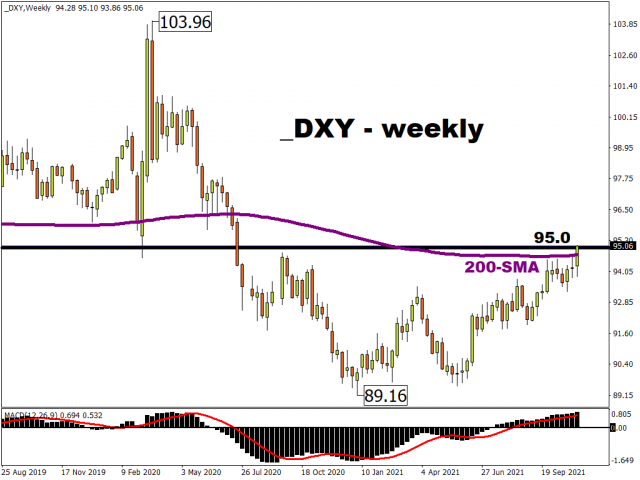
Trade weighted measures of the greenback have pushed to new highs for the year. The DXY has breached 95 having crossed the 200-week moving average.


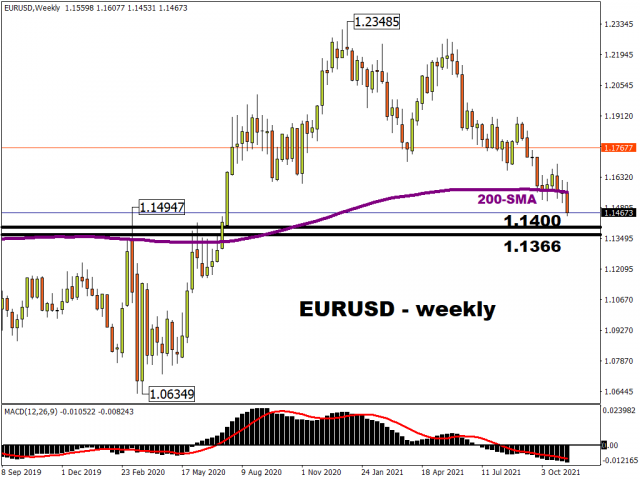
The five-month downtrend in EUR/USD has finally broken down through the 1.15 support zone. The failure below 1.16 had warned of further weakness. That support zone extends just below 1.15, with the March 2020 spike high at 1.14947.

Long-term levels below which sellers have their eyes on include 1.14 and then 1.1366. The weekly close will be key for an extended move like this to kick on.


Disclaimer: The content in this article comprises personal opinions and should not be construed as containing personal and/or other investment advice and/or an offer of and/or solicitation for any transactions in financial instruments and/or a guarantee and/or prediction of future performance. ForexTime (FXTM), its affiliates, agents, directors, officers or employees do not guarantee the accuracy, validity, timeliness or completeness, of any information or data made available and assume no liability as to any loss arising from any investment based on the same.


Forex-Time-LogoArticle by ForexTime

ForexTime Ltd (FXTM) is an award winning international online forex broker regulated by CySEC 185/12 www.forextime.com