
Article By RoboForex.com
Brent
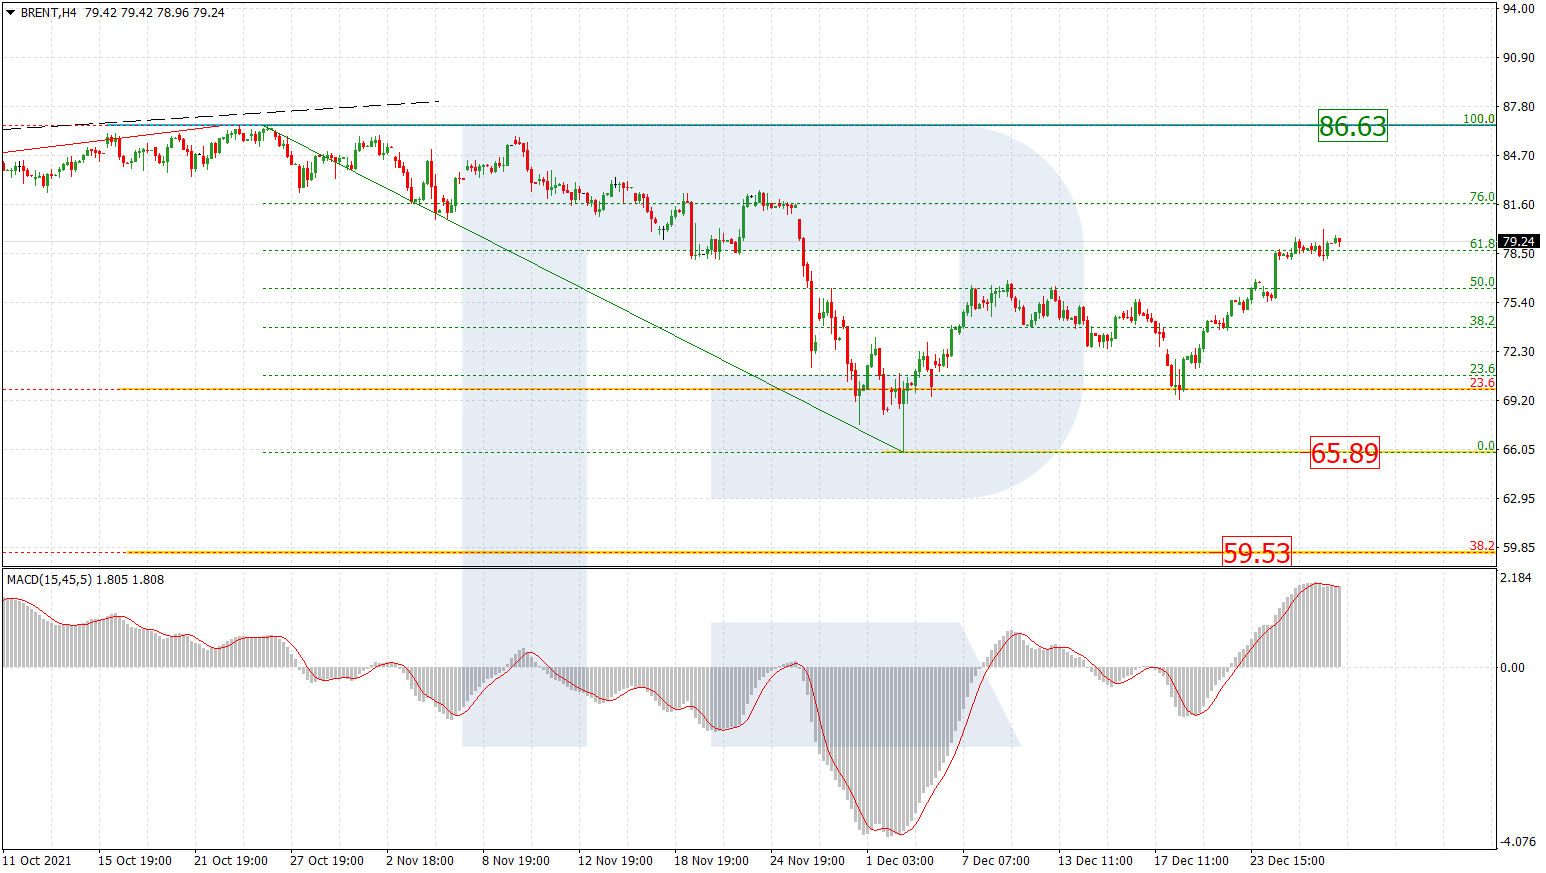
As we can see in the H4 chart, Brent is still moving upwards and may attempt to reach the high 86.63. If this wave fails to break the high and rebounds from it instead, the asset may start a new decline break the low at 65.89 and then continue falling towards long-term 38.2%, 50.0%, and 61.8% fibo at 59.53, 51.20, and 42.86 respectively.

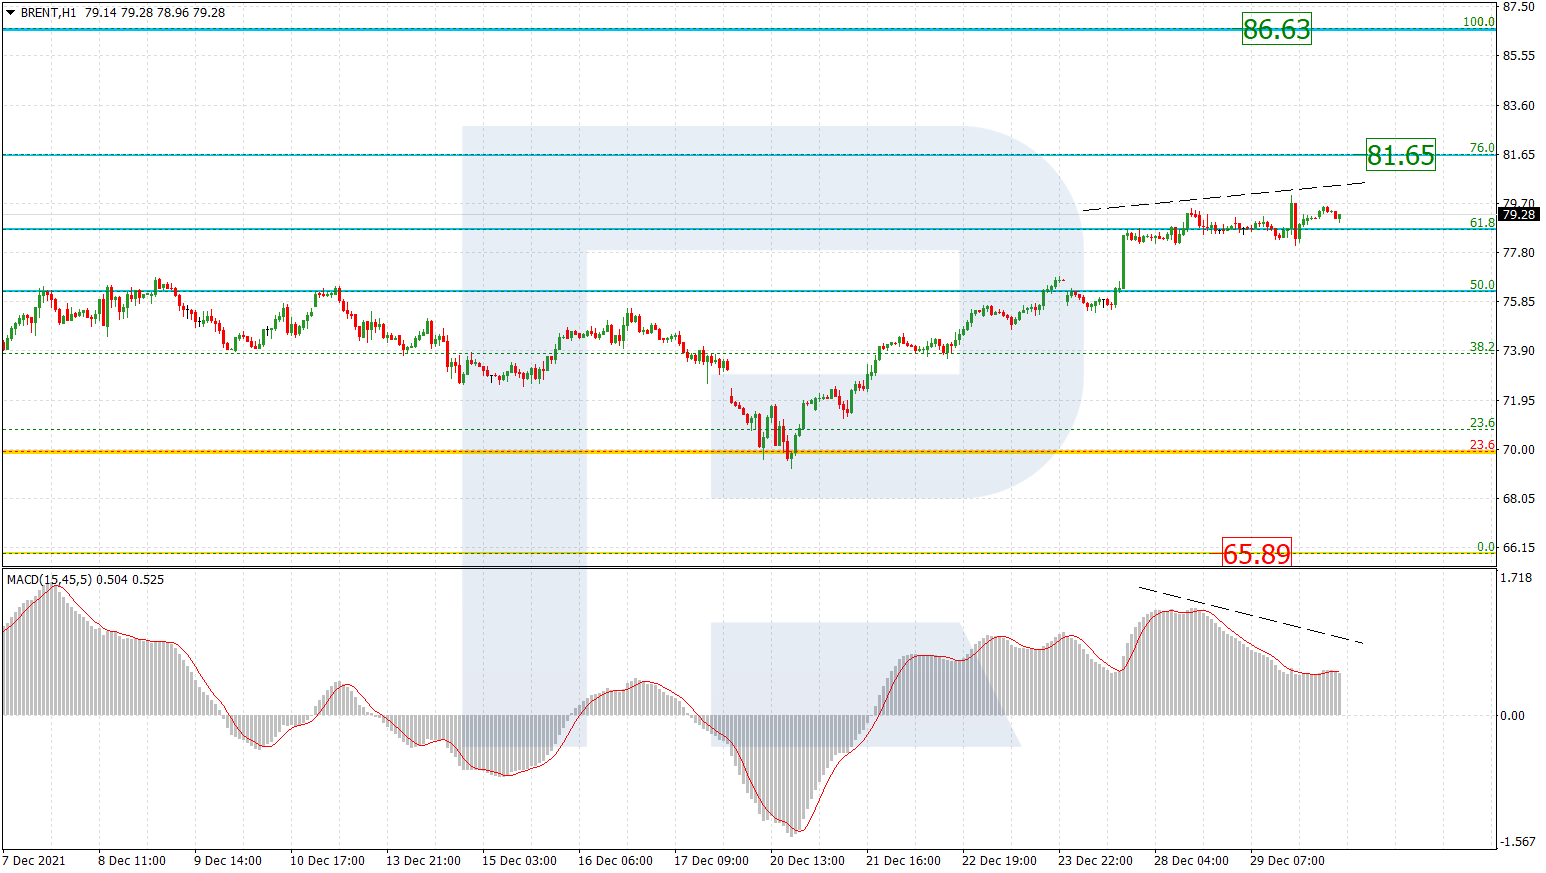
The H1 chart shows that the current rising impulse has reached 61.8% fibo, a breakout of which may lead to a further uptrend towards 76.0% fibo at 81.63 and then the high at 86.63. At the same time, there is divergence on MACD, which may hint at a possible reversal and a new decline to reach the low at 65.89.
Free Reports:
 Get our Weekly Commitment of Traders Reports - See where the biggest traders (Hedge Funds and Commercial Hedgers) are positioned in the futures markets on a weekly basis.
 Sign Up for Our Stock Market Newsletter – Get updated on News, Charts & Rankings of Public Companies when you join our Stocks Newsletter
Dow Jones
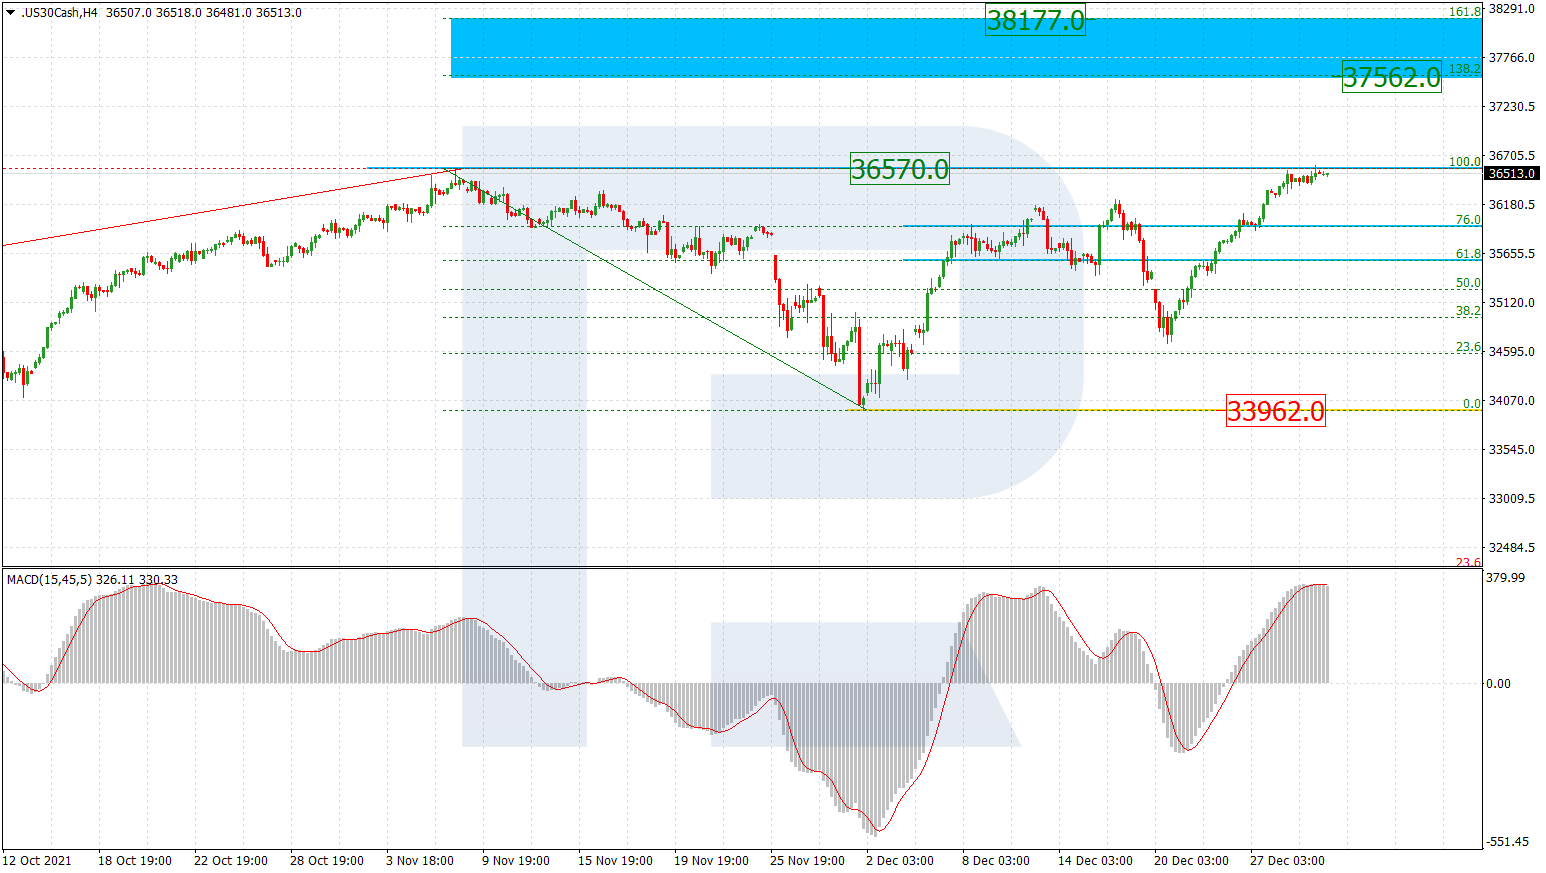
As we can see in the H4 chart, the index is testing the high at 36750.0 and trying to break it. If the asset succeeds, it may continue trading upwards to reach the post-correctional extension area between 138.2% and 161.8% fibo at 37562.0 and 38175.0 respectively. in the short-term, the price may slightly correct to the downside. The support remains at the local low at 33962.0.
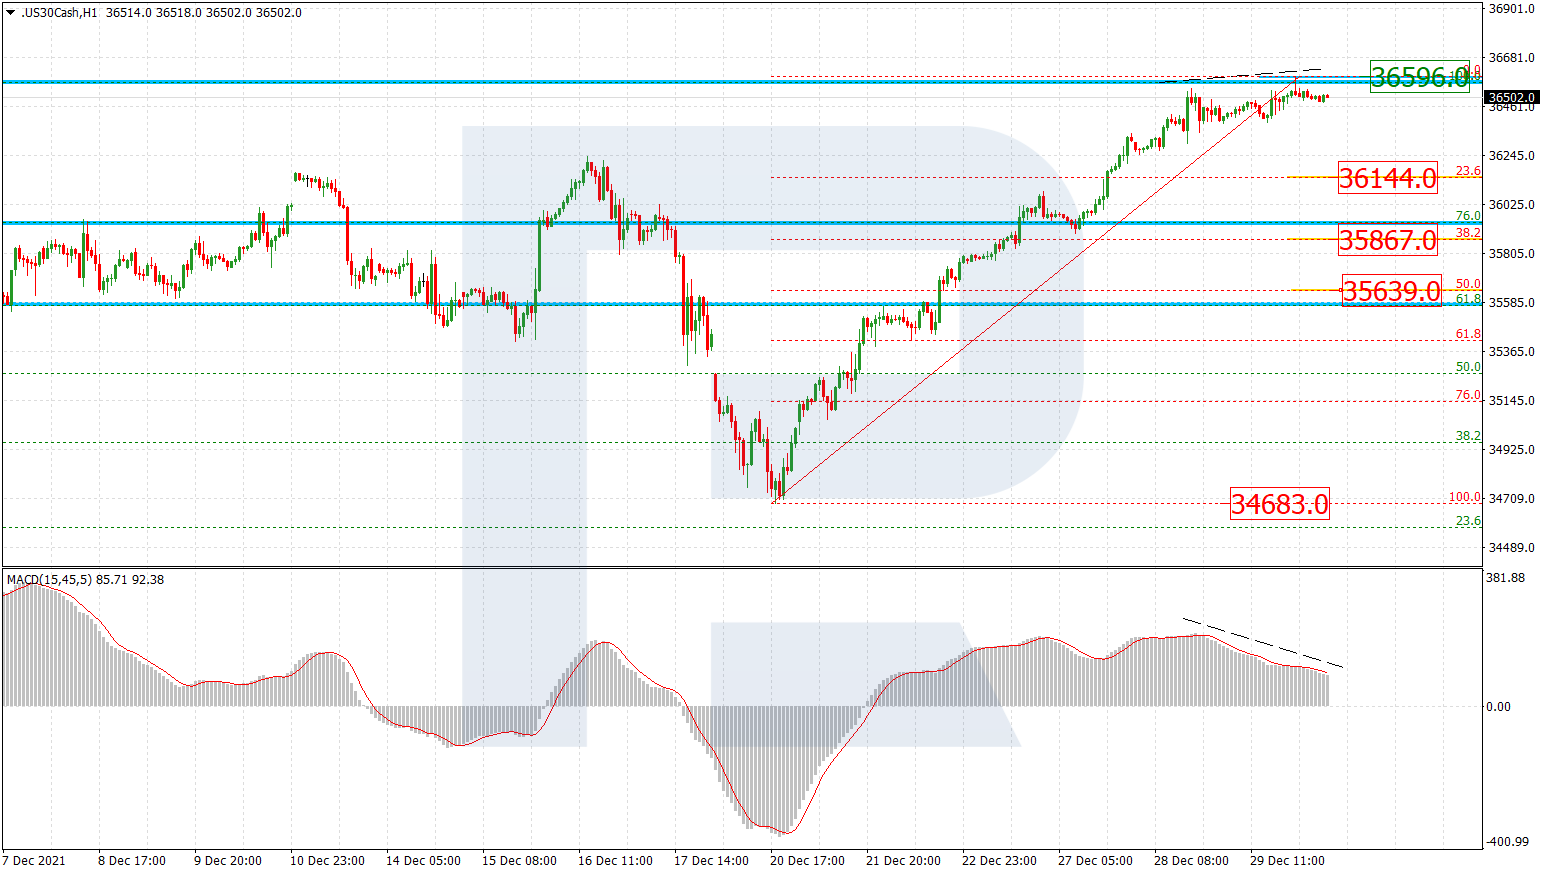
In the H1 chart, there is divergence on MACD, which may hint at a possible pullback. In this case, the correctional targets may be 23.6%, 38.2%, and 50.0% fibo at 36144.0, 35867.0, and 35639.0 respectively. The resistance is the high at 36596.0.
Article By RoboForex.com
Attention!
Forecasts presented in this section only reflect the author’s private opinion and should not be considered as guidance for trading. RoboForex LP bears no responsibility for trading results based on trading recommendations described in these analytical reviews.

- COT Metals Charts: Weekly Speculator Changes led by Copper Jul 26, 2026
- COT Bonds Charts: Speculator Bets led by SOFR 3-Months & 5-Year Bonds Jul 26, 2026
- COT Energy Charts: Weekly Speculator Bets led by WTI Crude & Natural Gas Jul 26, 2026
- COT Soft Commodities Charts: Weekly Speculator Bets led by Corn & Soybeans Jul 26, 2026
- The US introduces new import tariffs for 60 countries. Brent crude surpasses $100 per barrel Jul 24, 2026
- USD/JPY Breaks Records: Nothing Slows the Yen’s Decline Jul 24, 2026
- Oil prices reached a 6‑week high. The AUD strengthened on the back of a strong labor‑market report Jul 23, 2026
- EUR/USD Recovers as Dollar Weakens Jul 23, 2026
- Bitcoin rose to $66,000. The New Zealand dollar continues to strengthen Jul 22, 2026
- Inflationary pressure is easing in Canada. In New Zealand, on the contrary, inflation is rising Jul 21, 2026