By InvestMacro | COT | Data Tables | COT Leaders | Downloads | COT Newsletter
Here are the latest charts and statistics for the Commitment of Traders (COT) data published by the Commodities Futures Trading Commission (CFTC).
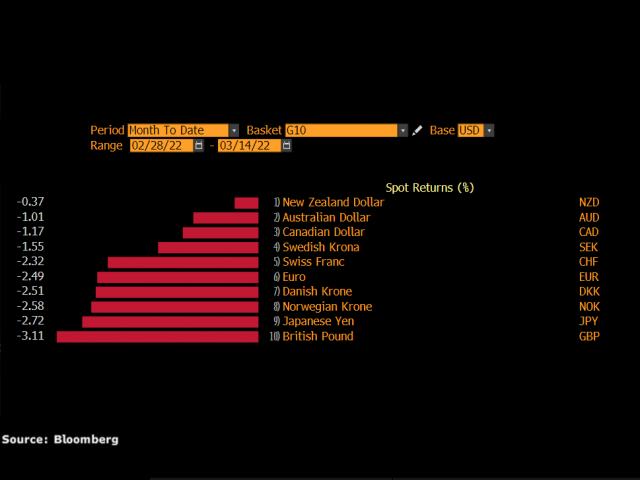
The latest COT data is updated through Tuesday March 8th and shows a quick view of how large traders (for-profit speculators and commercial entities) were positioned in the futures markets. All currency positions are in direct relation to the US dollar where, for example, a bet for the euro is a bet that the euro will rise versus the dollar while a bet against the euro will be a bet that the euro will decline versus the dollar.
Highlighting the COT currency data is the rising bullish sentiment in the Mexican Peso currency futures contracts. Peso speculators have boosted their bullish bets for six consecutive weeks and in nine out of the past ten weeks. Over the past six-week time-frame, Peso bets have gained by a total of +53.807 contracts, going from -790 net positions on January 25th to +53,017 net positions this week. This recent improvement in Peso positioning pushed the current net speculator standing (+53,017 contracts) to the most bullish level in the past one hundred and four weeks, dating back to March 10th of 2020.
Joining the Mexican peso (10,639 contracts) with positive changes this week were the Japanese yen (12,876 contracts), Brazil real (48 contracts), Swiss franc (5,538 contracts), New Zealand dollar (1,793 contracts), Australian dollar (141 contracts) and Bitcoin (185 contracts).
The currencies with declining bets were the US Dollar Index (-730 contracts), Euro (-6,095 contracts), British pound sterling (-12,189 contracts), Canadian dollar (-6,494 contracts) and the Russian ruble (-1,868 contracts).
| Mar-08-2022 | OI | OI-Index | Spec-Net | Spec-Index | Com-Net | COM-Index | Smalls-Net | Smalls-Index |
|---|
| USD Index | 62,447 | 95 | 34,044 | 85 | -37,890 | 12 | 3,846 | 59 |
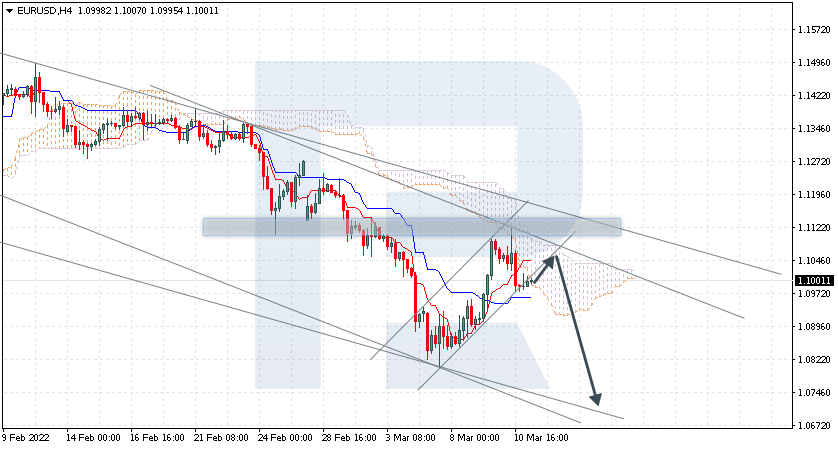
| EUR | 738,990 | 98 | 58,844 | 53 | -83,873 | 52 | 25,029 | 16 |
| GBP | 246,312 | 68 | -12,526 | 65 | 25,457 | 45 | -12,931 | 29 |
| JPY | 208,683 | 61 | -55,856 | 33 | 76,657 | 74 | -20,801 | 5 |
| CHF | 51,820 | 30 | -9,710 | 53 | 21,942 | 56 | -12,232 | 27 |
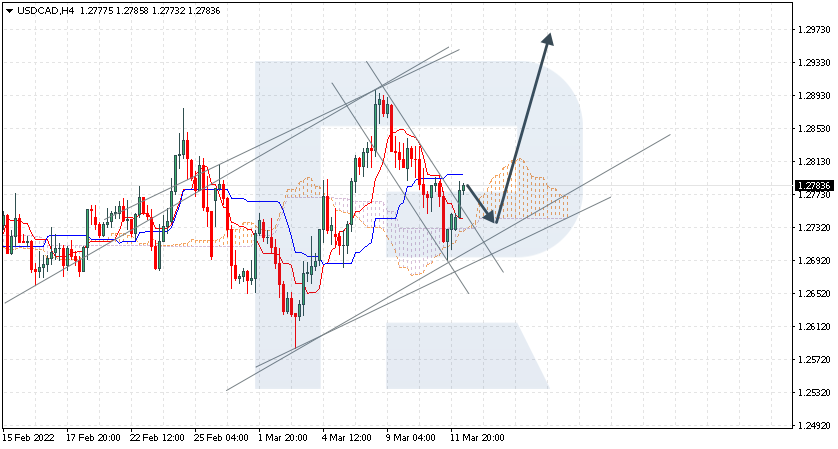
| CAD | 149,425 | 30 | 7,646 | 55 | -15,494 | 46 | 7,848 | 45 |
| AUD | 197,094 | 80 | -78,195 | 12 | 78,183 | 77 | 12 | 52 |
| NZD | 53,250 | 50 | -12,379 | 50 | 13,592 | 51 | -1,213 | 38 |
| MXN | 166,433 | 34 | 53,017 | 50 | -55,194 | 50 | 2,177 | 52 |
| RUB | 22,420 | 7 | 7,806 | 32 | -7,325 | 69 | -481 | 22 |
| BRL | 68,623 | 65 | 50,496 | 100 | -52,564 | 0 | 2,068 | 90 |
| Bitcoin | 9,591 | 48 | 265 | 100 | -422 | 0 | 157 | 17 |
US Dollar Index Futures:
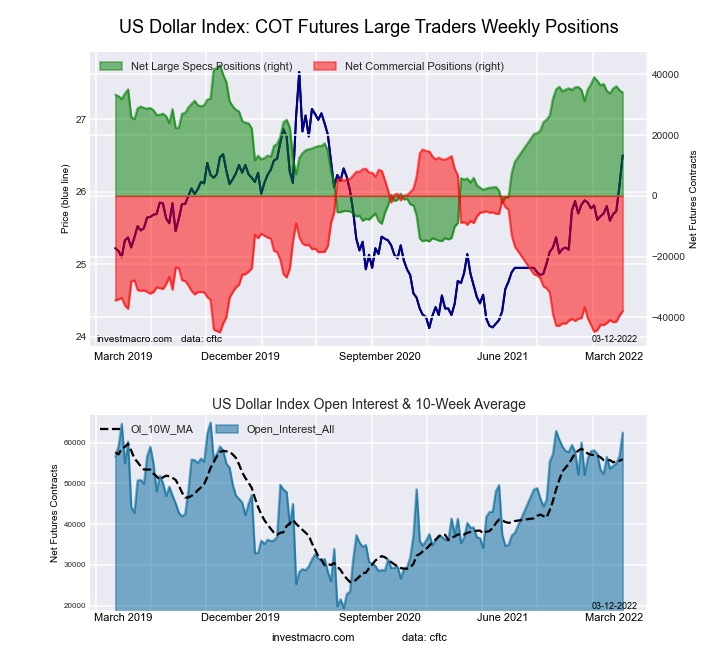 The US Dollar Index large speculator standing this week totaled a net position of 34,044 contracts in the data reported through Tuesday. This was a weekly decrease of -730 contracts from the previous week which had a total of 34,774 net contracts.
This week’s current strength score (the trader positioning range over the past three years, measured from 0 to 100) shows the speculators are currently Bullish-Extreme with a score of 84.5 percent. The commercials are Bearish-Extreme with a score of 11.6 percent and the small traders (not shown in chart) are Bullish with a score of 58.6 percent.
| US DOLLAR INDEX Statistics | SPECULATORS | COMMERCIALS | SMALL TRADERS |
| – Percent of Open Interest Longs: | 73.7 | 12.8 | 9.0 |
| – Percent of Open Interest Shorts: | 19.2 | 73.4 | 2.9 |
| – Net Position: | 34,044 | -37,890 | 3,846 |
| – Gross Longs: | 46,031 | 7,962 | 5,642 |
| – Gross Shorts: | 11,987 | 45,852 | 1,796 |
| – Long to Short Ratio: | 3.8 to 1 | 0.2 to 1 | 3.1 to 1 |
| NET POSITION TREND: | | | |
| – Strength Index Score (3 Year Range Pct): | 84.5 | 11.6 | 58.6 |
| – Strength Index Reading (3 Year Range): | Bullish-Extreme | Bearish-Extreme | Bullish |
| NET POSITION MOVEMENT INDEX: | | | |
| – 6-Week Change in Strength Index: | -4.9 | 7.7 | -19.7 |
Euro Currency Futures:
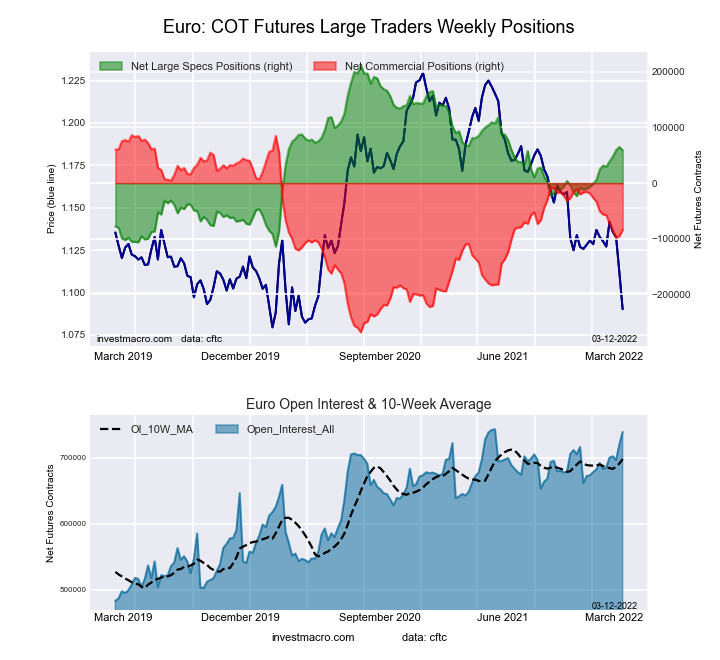 The Euro Currency large speculator standing this week totaled a net position of 58,844 contracts in the data reported through Tuesday. This was a weekly decline of -6,095 contracts from the previous week which had a total of 64,939 net contracts.
This week’s current strength score (the trader positioning range over the past three years, measured from 0 to 100) shows the speculators are currently Bullish with a score of 53.1 percent. The commercials are Bullish with a score of 52.0 percent and the small traders (not shown in chart) are Bearish-Extreme with a score of 15.9 percent.
| EURO Currency Statistics | SPECULATORS | COMMERCIALS | SMALL TRADERS |
| – Percent of Open Interest Longs: | 32.8 | 52.3 | 11.6 |
| – Percent of Open Interest Shorts: | 24.9 | 63.7 | 8.2 |
| – Net Position: | 58,844 | -83,873 | 25,029 |
| – Gross Longs: | 242,683 | 386,654 | 85,727 |
| – Gross Shorts: | 183,839 | 470,527 | 60,698 |
| – Long to Short Ratio: | 1.3 to 1 | 0.8 to 1 | 1.4 to 1 |
| NET POSITION TREND: | | | |
| – Strength Index Score (3 Year Range Pct): | 53.1 | 52.0 | 15.9 |
| – Strength Index Reading (3 Year Range): | Bullish | Bullish | Bearish-Extreme |
| NET POSITION MOVEMENT INDEX: | | | |
| – 6-Week Change in Strength Index: | 8.4 | -7.8 | 0.5 |
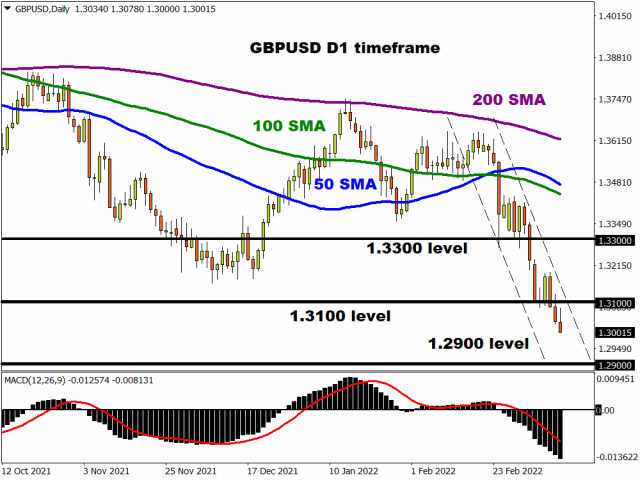
British Pound Sterling Futures:
 The British Pound Sterling large speculator standing this week totaled a net position of -12,526 contracts in the data reported through Tuesday. This was a weekly decrease of -12,189 contracts from the previous week which had a total of -337 net contracts.
This week’s current strength score (the trader positioning range over the past three years, measured from 0 to 100) shows the speculators are currently Bullish with a score of 65.0 percent. The commercials are Bearish with a score of 44.7 percent and the small traders (not shown in chart) are Bearish with a score of 28.9 percent.
| BRITISH POUND Statistics | SPECULATORS | COMMERCIALS | SMALL TRADERS |
| – Percent of Open Interest Longs: | 20.7 | 66.8 | 9.4 |
| – Percent of Open Interest Shorts: | 25.8 | 56.4 | 14.6 |
| – Net Position: | -12,526 | 25,457 | -12,931 |
| – Gross Longs: | 50,982 | 164,423 | 23,076 |
| – Gross Shorts: | 63,508 | 138,966 | 36,007 |
| – Long to Short Ratio: | 0.8 to 1 | 1.2 to 1 | 0.6 to 1 |
| NET POSITION TREND: | | | |
| – Strength Index Score (3 Year Range Pct): | 65.0 | 44.7 | 28.9 |
| – Strength Index Reading (3 Year Range): | Bullish | Bearish | Bearish |
| NET POSITION MOVEMENT INDEX: | | | |
| – 6-Week Change in Strength Index: | -3.4 | 5.1 | -8.0 |
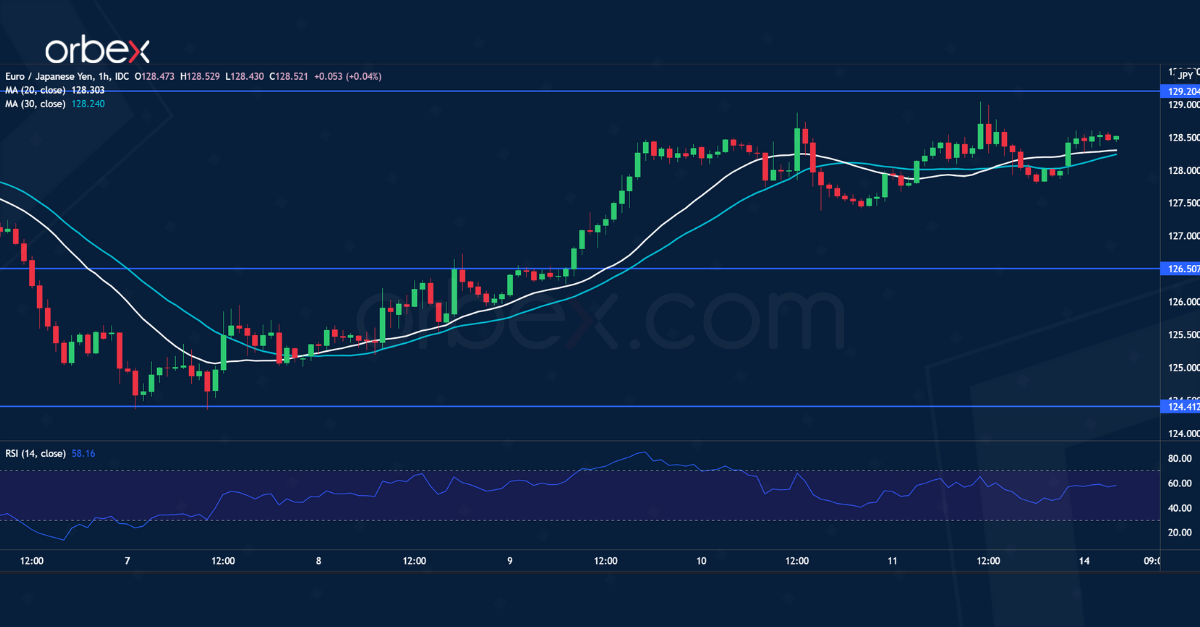
Japanese Yen Futures:
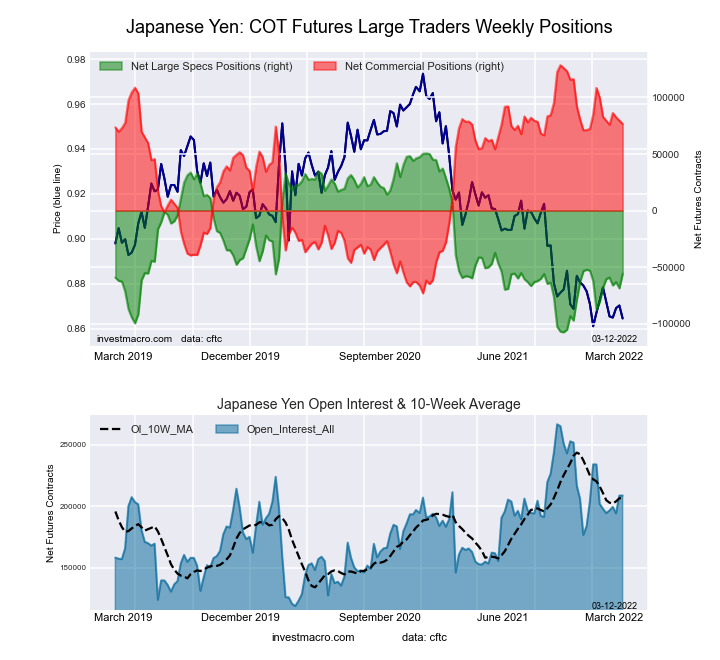 The Japanese Yen large speculator standing this week totaled a net position of -55,856 contracts in the data reported through Tuesday. This was a weekly boost of 12,876 contracts from the previous week which had a total of -68,732 net contracts.
This week’s current strength score (the trader positioning range over the past three years, measured from 0 to 100) shows the speculators are currently Bearish with a score of 32.7 percent. The commercials are Bullish with a score of 74.3 percent and the small traders (not shown in chart) are Bearish-Extreme with a score of 4.8 percent.
| JAPANESE YEN Statistics | SPECULATORS | COMMERCIALS | SMALL TRADERS |
| – Percent of Open Interest Longs: | 7.5 | 81.6 | 8.1 |
| – Percent of Open Interest Shorts: | 34.2 | 44.9 | 18.1 |
| – Net Position: | -55,856 | 76,657 | -20,801 |
| – Gross Longs: | 15,548 | 170,330 | 16,884 |
| – Gross Shorts: | 71,404 | 93,673 | 37,685 |
| – Long to Short Ratio: | 0.2 to 1 | 1.8 to 1 | 0.4 to 1 |
| NET POSITION TREND: | | | |
| – Strength Index Score (3 Year Range Pct): | 32.7 | 74.3 | 4.8 |
| – Strength Index Reading (3 Year Range): | Bearish | Bullish | Bearish-Extreme |
| NET POSITION MOVEMENT INDEX: | | | |
| – 6-Week Change in Strength Index: | 7.9 | -3.1 | -13.5 |
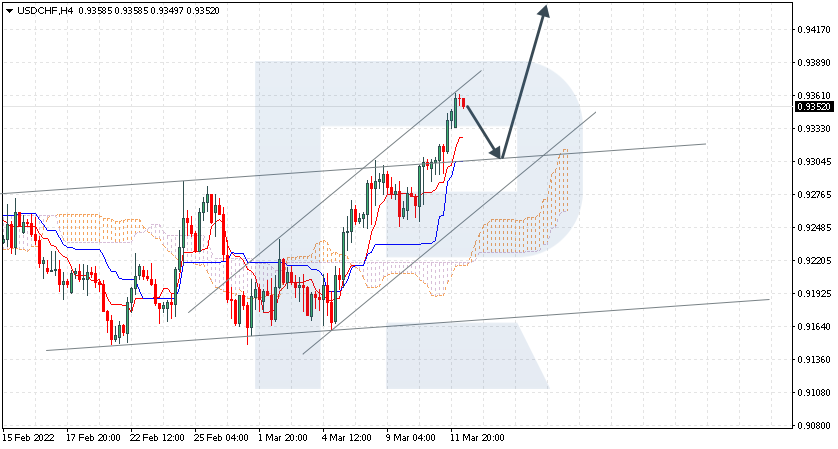
Swiss Franc Futures:
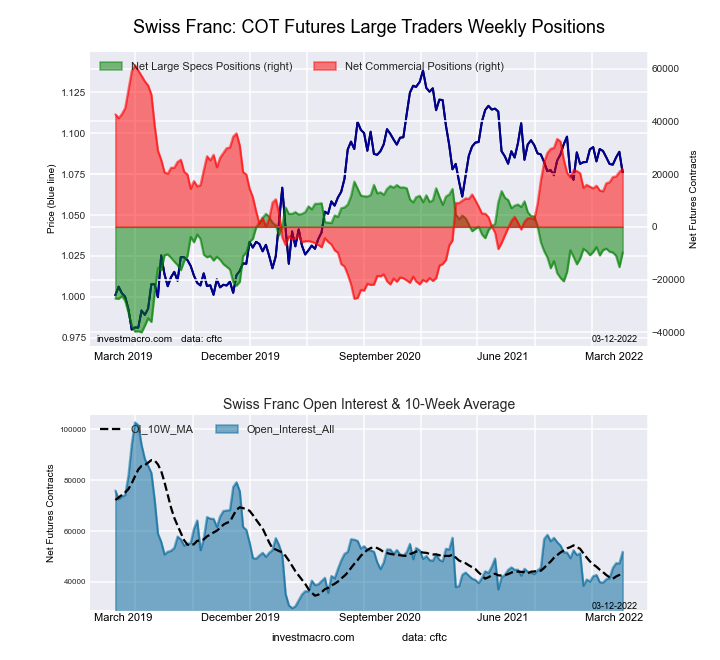 The Swiss Franc large speculator standing this week totaled a net position of -9,710 contracts in the data reported through Tuesday. This was a weekly boost of 5,538 contracts from the previous week which had a total of -15,248 net contracts.
This week’s current strength score (the trader positioning range over the past three years, measured from 0 to 100) shows the speculators are currently Bullish with a score of 53.0 percent. The commercials are Bullish with a score of 55.5 percent and the small traders (not shown in chart) are Bearish with a score of 27.4 percent.
| SWISS FRANC Statistics | SPECULATORS | COMMERCIALS | SMALL TRADERS |
| – Percent of Open Interest Longs: | 9.4 | 70.7 | 17.3 |
| – Percent of Open Interest Shorts: | 28.1 | 28.4 | 40.9 |
| – Net Position: | -9,710 | 21,942 | -12,232 |
| – Gross Longs: | 4,856 | 36,635 | 8,947 |
| – Gross Shorts: | 14,566 | 14,693 | 21,179 |
| – Long to Short Ratio: | 0.3 to 1 | 2.5 to 1 | 0.4 to 1 |
| NET POSITION TREND: | | | |
| – Strength Index Score (3 Year Range Pct): | 53.0 | 55.5 | 27.4 |
| – Strength Index Reading (3 Year Range): | Bullish | Bullish | Bearish |
| NET POSITION MOVEMENT INDEX: | | | |
| – 6-Week Change in Strength Index: | -1.6 | 9.6 | -22.1 |
Canadian Dollar Futures:
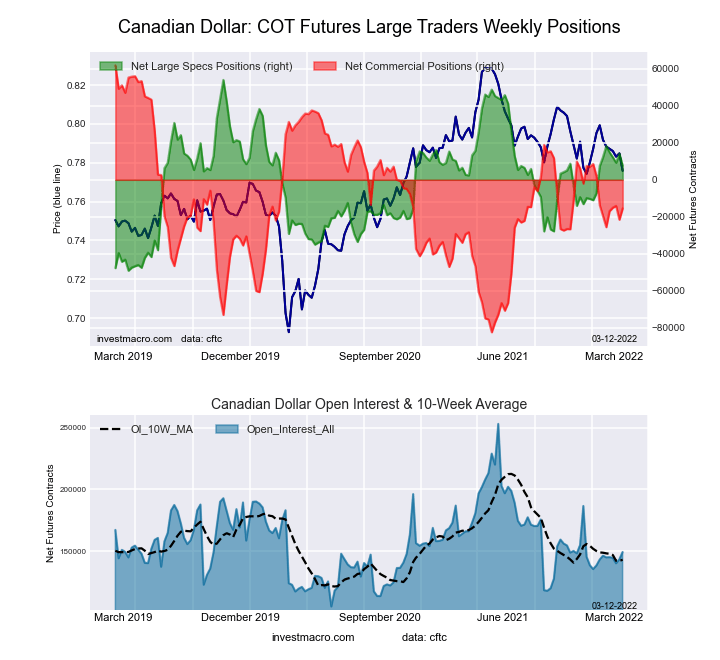 The Canadian Dollar large speculator standing this week totaled a net position of 7,646 contracts in the data reported through Tuesday. This was a weekly fall of -6,494 contracts from the previous week which had a total of 14,140 net contracts.
This week’s current strength score (the trader positioning range over the past three years, measured from 0 to 100) shows the speculators are currently Bullish with a score of 55.1 percent. The commercials are Bearish with a score of 46.4 percent and the small traders (not shown in chart) are Bearish with a score of 45.4 percent.
| CANADIAN DOLLAR Statistics | SPECULATORS | COMMERCIALS | SMALL TRADERS |
| – Percent of Open Interest Longs: | 32.5 | 41.7 | 22.7 |
| – Percent of Open Interest Shorts: | 27.3 | 52.1 | 17.5 |
| – Net Position: | 7,646 | -15,494 | 7,848 |
| – Gross Longs: | 48,492 | 62,360 | 33,951 |
| – Gross Shorts: | 40,846 | 77,854 | 26,103 |
| – Long to Short Ratio: | 1.2 to 1 | 0.8 to 1 | 1.3 to 1 |
| NET POSITION TREND: | | | |
| – Strength Index Score (3 Year Range Pct): | 55.1 | 46.4 | 45.4 |
| – Strength Index Reading (3 Year Range): | Bullish | Bearish | Bearish |
| NET POSITION MOVEMENT INDEX: | | | |
| – 6-Week Change in Strength Index: | -4.5 | 2.8 | 1.2 |
Australian Dollar Futures:
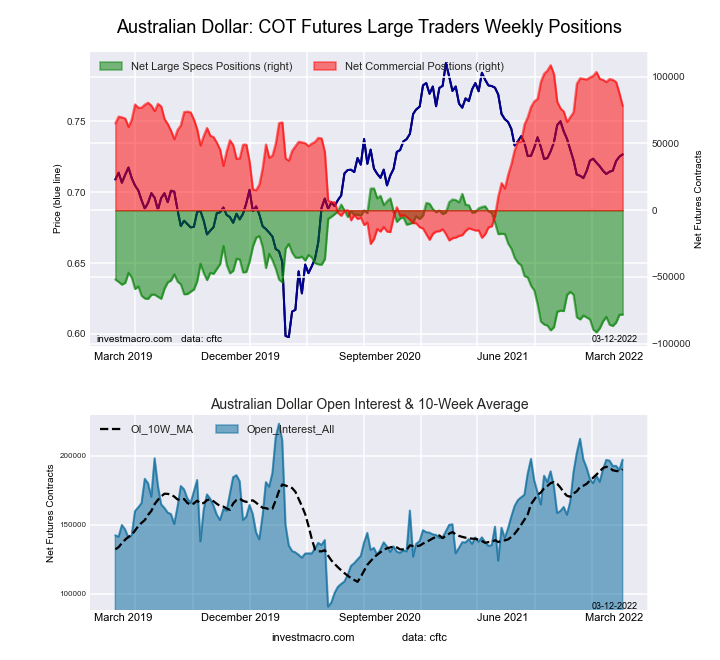 The Australian Dollar large speculator standing this week totaled a net position of -78,195 contracts in the data reported through Tuesday. This was a weekly advance of 141 contracts from the previous week which had a total of -78,336 net contracts.
This week’s current strength score (the trader positioning range over the past three years, measured from 0 to 100) shows the speculators are currently Bearish-Extreme with a score of 12.3 percent. The commercials are Bullish with a score of 77.2 percent and the small traders (not shown in chart) are Bullish with a score of 52.5 percent.
| AUSTRALIAN DOLLAR Statistics | SPECULATORS | COMMERCIALS | SMALL TRADERS |
| – Percent of Open Interest Longs: | 9.9 | 74.1 | 13.0 |
| – Percent of Open Interest Shorts: | 49.6 | 34.5 | 13.0 |
| – Net Position: | -78,195 | 78,183 | 12 |
| – Gross Longs: | 19,521 | 146,144 | 25,564 |
| – Gross Shorts: | 97,716 | 67,961 | 25,552 |
| – Long to Short Ratio: | 0.2 to 1 | 2.2 to 1 | 1.0 to 1 |
| NET POSITION TREND: | | | |
| – Strength Index Score (3 Year Range Pct): | 12.3 | 77.2 | 52.5 |
| – Strength Index Reading (3 Year Range): | Bearish-Extreme | Bullish | Bullish |
| NET POSITION MOVEMENT INDEX: | | | |
| – 6-Week Change in Strength Index: | 4.7 | -14.6 | 35.3 |
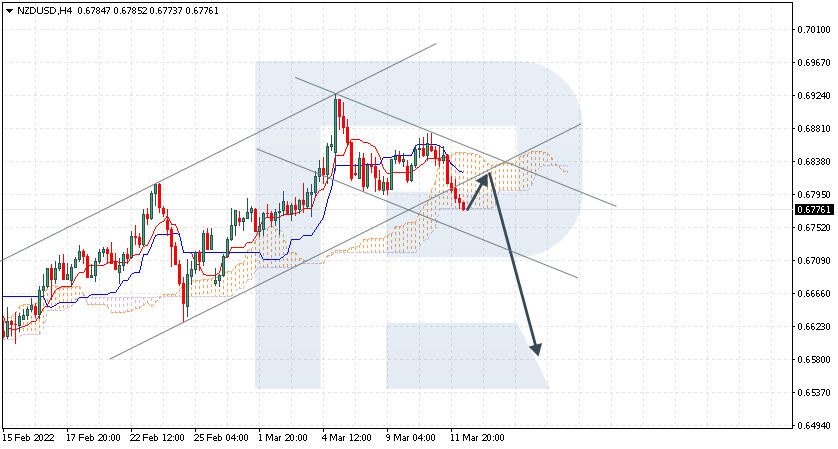
New Zealand Dollar Futures:
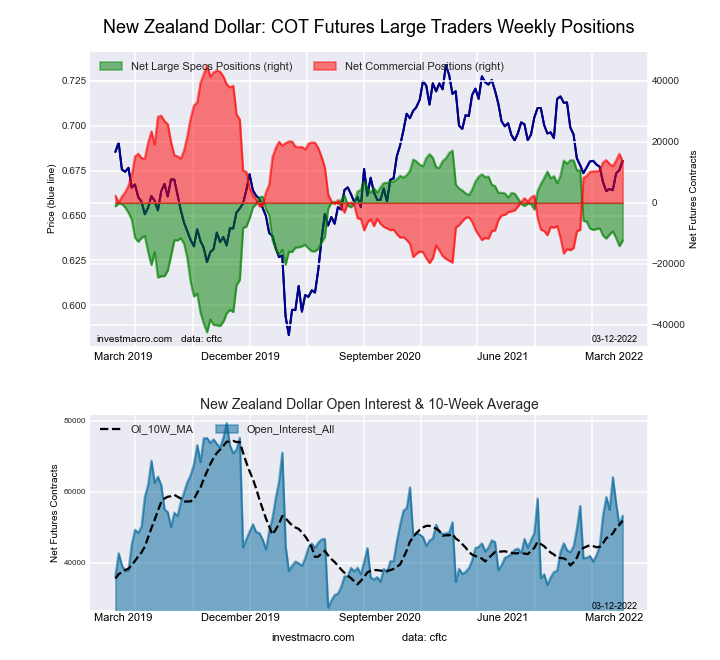 The New Zealand Dollar large speculator standing this week totaled a net position of -12,379 contracts in the data reported through Tuesday. This was a weekly rise of 1,793 contracts from the previous week which had a total of -14,172 net contracts.
This week’s current strength score (the trader positioning range over the past three years, measured from 0 to 100) shows the speculators are currently Bullish with a score of 50.5 percent. The commercials are Bullish with a score of 51.3 percent and the small traders (not shown in chart) are Bearish with a score of 37.9 percent.
| NEW ZEALAND DOLLAR Statistics | SPECULATORS | COMMERCIALS | SMALL TRADERS |
| – Percent of Open Interest Longs: | 29.6 | 62.0 | 5.2 |
| – Percent of Open Interest Shorts: | 52.9 | 36.5 | 7.5 |
| – Net Position: | -12,379 | 13,592 | -1,213 |
| – Gross Longs: | 15,775 | 33,005 | 2,792 |
| – Gross Shorts: | 28,154 | 19,413 | 4,005 |
| – Long to Short Ratio: | 0.6 to 1 | 1.7 to 1 | 0.7 to 1 |
| NET POSITION TREND: | | | |
| – Strength Index Score (3 Year Range Pct): | 50.5 | 51.3 | 37.9 |
| – Strength Index Reading (3 Year Range): | Bullish | Bullish | Bearish |
| NET POSITION MOVEMENT INDEX: | | | |
| – 6-Week Change in Strength Index: | -2.7 | 0.5 | 14.8 |
Mexican Peso Futures:
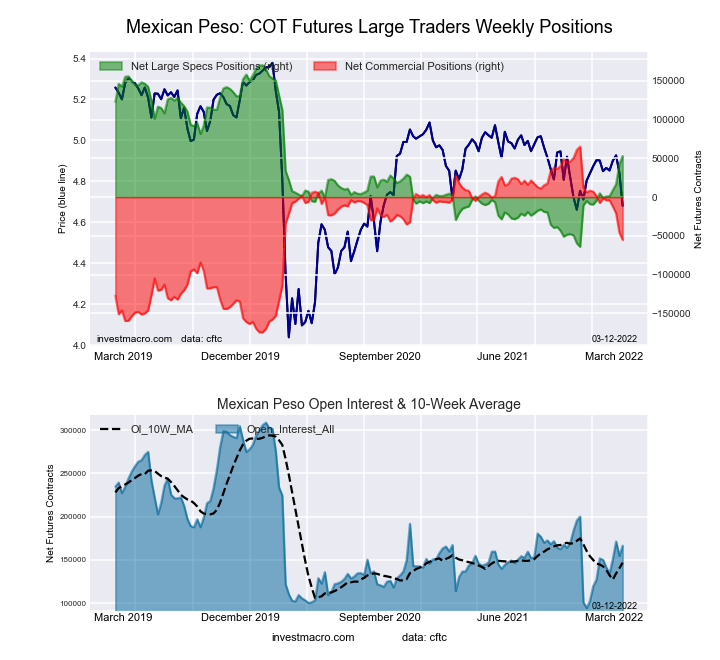 The Mexican Peso large speculator standing this week totaled a net position of 53,017 contracts in the data reported through Tuesday. This was a weekly lift of 10,639 contracts from the previous week which had a total of 42,378 net contracts.
This week’s current strength score (the trader positioning range over the past three years, measured from 0 to 100) shows the speculators are currently Bearish with a score of 50.0 percent. The commercials are Bearish with a score of 49.8 percent and the small traders (not shown in chart) are Bullish with a score of 52.3 percent.
| MEXICAN PESO Statistics | SPECULATORS | COMMERCIALS | SMALL TRADERS |
| – Percent of Open Interest Longs: | 45.7 | 36.4 | 3.4 |
| – Percent of Open Interest Shorts: | 13.8 | 69.5 | 2.1 |
| – Net Position: | 53,017 | -55,194 | 2,177 |
| – Gross Longs: | 76,020 | 60,537 | 5,674 |
| – Gross Shorts: | 23,003 | 115,731 | 3,497 |
| – Long to Short Ratio: | 3.3 to 1 | 0.5 to 1 | 1.6 to 1 |
| NET POSITION TREND: | | | |
| – Strength Index Score (3 Year Range Pct): | 50.0 | 49.8 | 52.3 |
| – Strength Index Reading (3 Year Range): | Bearish | Bearish | Bullish |
| NET POSITION MOVEMENT INDEX: | | | |
| – 6-Week Change in Strength Index: | 22.9 | -22.4 | -0.4 |
Brazilian Real Futures:
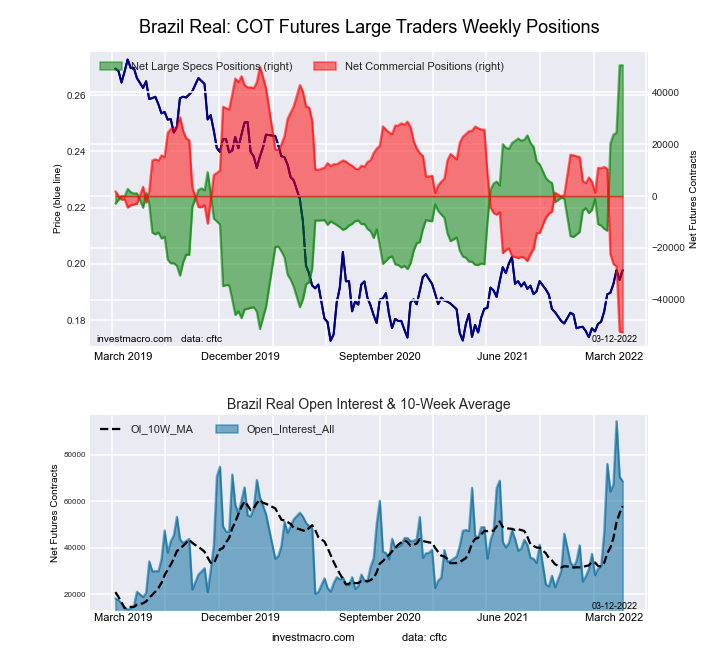 The Brazilian Real large speculator standing this week totaled a net position of 50,496 contracts in the data reported through Tuesday. This was a weekly lift of 48 contracts from the previous week which had a total of 50,448 net contracts.
This week’s current strength score (the trader positioning range over the past three years, measured from 0 to 100) shows the speculators are currently Bullish-Extreme with a score of 100.0 percent. The commercials are Bearish-Extreme with a score of 0.0 percent and the small traders (not shown in chart) are Bullish-Extreme with a score of 90.3 percent.
| BRAZIL REAL Statistics | SPECULATORS | COMMERCIALS | SMALL TRADERS |
| – Percent of Open Interest Longs: | 79.5 | 15.3 | 5.1 |
| – Percent of Open Interest Shorts: | 5.9 | 91.9 | 2.1 |
| – Net Position: | 50,496 | -52,564 | 2,068 |
| – Gross Longs: | 54,543 | 10,468 | 3,488 |
| – Gross Shorts: | 4,047 | 63,032 | 1,420 |
| – Long to Short Ratio: | 13.5 to 1 | 0.2 to 1 | 2.5 to 1 |
| NET POSITION TREND: | | | |
| – Strength Index Score (3 Year Range Pct): | 100.0 | 0.0 | 90.3 |
| – Strength Index Reading (3 Year Range): | Bullish-Extreme | Bearish-Extreme | Bullish-Extreme |
| NET POSITION MOVEMENT INDEX: | | | |
| – 6-Week Change in Strength Index: | 62.0 | -62.3 | 8.4 |
Russian Ruble Futures:
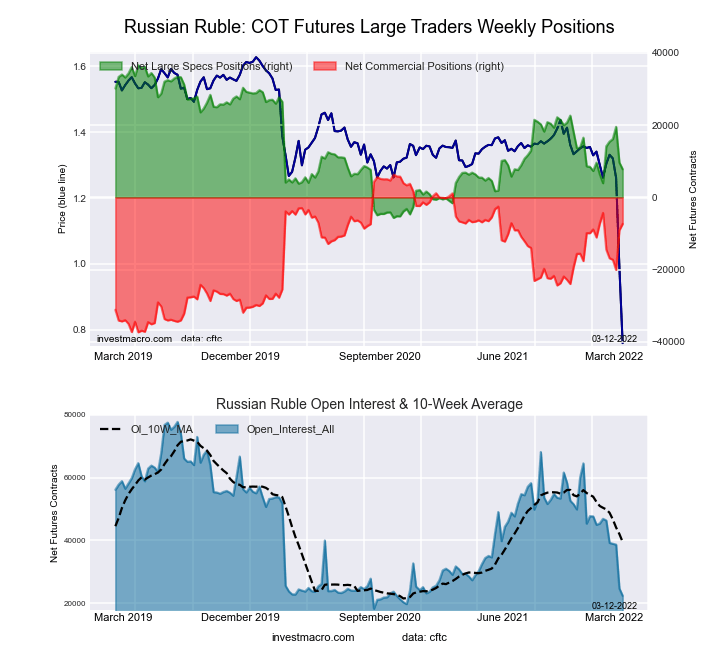 The Russian Ruble large speculator standing this week totaled a net position of 7,806 contracts in the data reported through Tuesday. This was a weekly fall of -1,868 contracts from the previous week which had a total of 9,674 net contracts.
This week’s current strength score (the trader positioning range over the past three years, measured from 0 to 100) shows the speculators are currently Bearish with a score of 31.9 percent. The commercials are Bullish with a score of 68.7 percent and the small traders (not shown in chart) are Bearish with a score of 21.5 percent.
| RUSSIAN RUBLE Statistics | SPECULATORS | COMMERCIALS | SMALL TRADERS |
| – Percent of Open Interest Longs: | 36.5 | 60.6 | 2.9 |
| – Percent of Open Interest Shorts: | 1.6 | 93.3 | 5.1 |
| – Net Position: | 7,806 | -7,325 | -481 |
| – Gross Longs: | 8,173 | 13,590 | 657 |
| – Gross Shorts: | 367 | 20,915 | 1,138 |
| – Long to Short Ratio: | 22.3 to 1 | 0.6 to 1 | 0.6 to 1 |
| NET POSITION TREND: | | | |
| – Strength Index Score (3 Year Range Pct): | 31.9 | 68.7 | 21.5 |
| – Strength Index Reading (3 Year Range): | Bearish | Bullish | Bearish |
| NET POSITION MOVEMENT INDEX: | | | |
| – 6-Week Change in Strength Index: | 9.1 | -7.0 | -22.4 |
Bitcoin Futures:
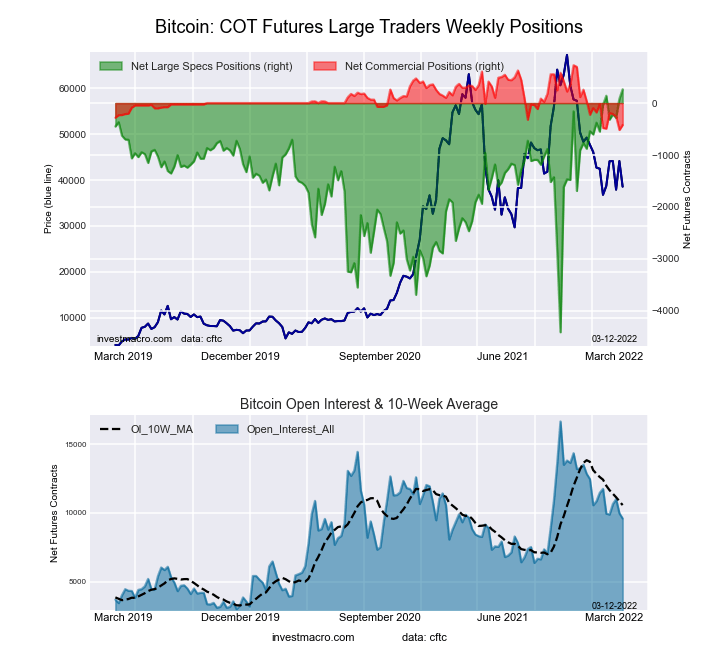 The Bitcoin large speculator standing this week totaled a net position of 265 contracts in the data reported through Tuesday. This was a weekly gain of 185 contracts from the previous week which had a total of 80 net contracts.
This week’s current strength score (the trader positioning range over the past three years, measured from 0 to 100) shows the speculators are currently Bullish-Extreme with a score of 100.0 percent. The commercials are Bearish-Extreme with a score of 7.6 percent and the small traders (not shown in chart) are Bearish-Extreme with a score of 16.5 percent.
| BITCOIN Statistics | SPECULATORS | COMMERCIALS | SMALL TRADERS |
| – Percent of Open Interest Longs: | 80.9 | 2.8 | 9.9 |
| – Percent of Open Interest Shorts: | 78.1 | 7.2 | 8.3 |
| – Net Position: | 265 | -422 | 157 |
| – Gross Longs: | 7,760 | 272 | 950 |
| – Gross Shorts: | 7,495 | 694 | 793 |
| – Long to Short Ratio: | 1.0 to 1 | 0.4 to 1 | 1.2 to 1 |
| NET POSITION TREND: | | | |
| – Strength Index Score (3 Year Range Pct): | 100.0 | 7.6 | 16.5 |
| – Strength Index Reading (3 Year Range): | Bullish-Extreme | Bearish-Extreme | Bearish-Extreme |
| NET POSITION MOVEMENT INDEX: | | | |
| – 6-Week Change in Strength Index: | 6.4 | 4.5 | -8.1 |
Article By InvestMacro – Receive our weekly COT Reports by Email
*COT Report: The COT data, released weekly to the public each Friday, is updated through the most recent Tuesday (data is 3 days old) and shows a quick view of how large speculators or non-commercials (for-profit traders) were positioned in the futures markets.
The CFTC categorizes trader positions according to commercial hedgers (traders who use futures contracts for hedging as part of the business), non-commercials (large traders who speculate to realize trading profits) and nonreportable traders (usually small traders/speculators) as well as their open interest (contracts open in the market at time of reporting).See CFTC criteria here.


