By JustForex
The EUR/USD currency pair
- Prev Open: 1.0298
- Prev Close: 1.0319
- % chg. over the last day: +0.20%
Data on Thursday showed that producer prices in the US unexpectedly fell in July amid falling energy costs. Meanwhile, core producer inflation is also trending lower. In the labor market, jobless claims rose for the second week in a row. Traders of federal funds futures contracts currently estimate a 66% chance of a 50 basis point increase and a 34% chance of a 75 basis point increase in September.
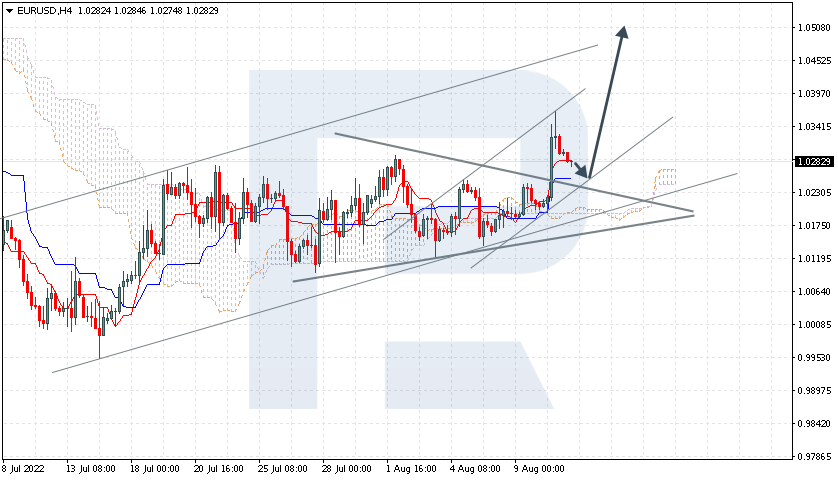
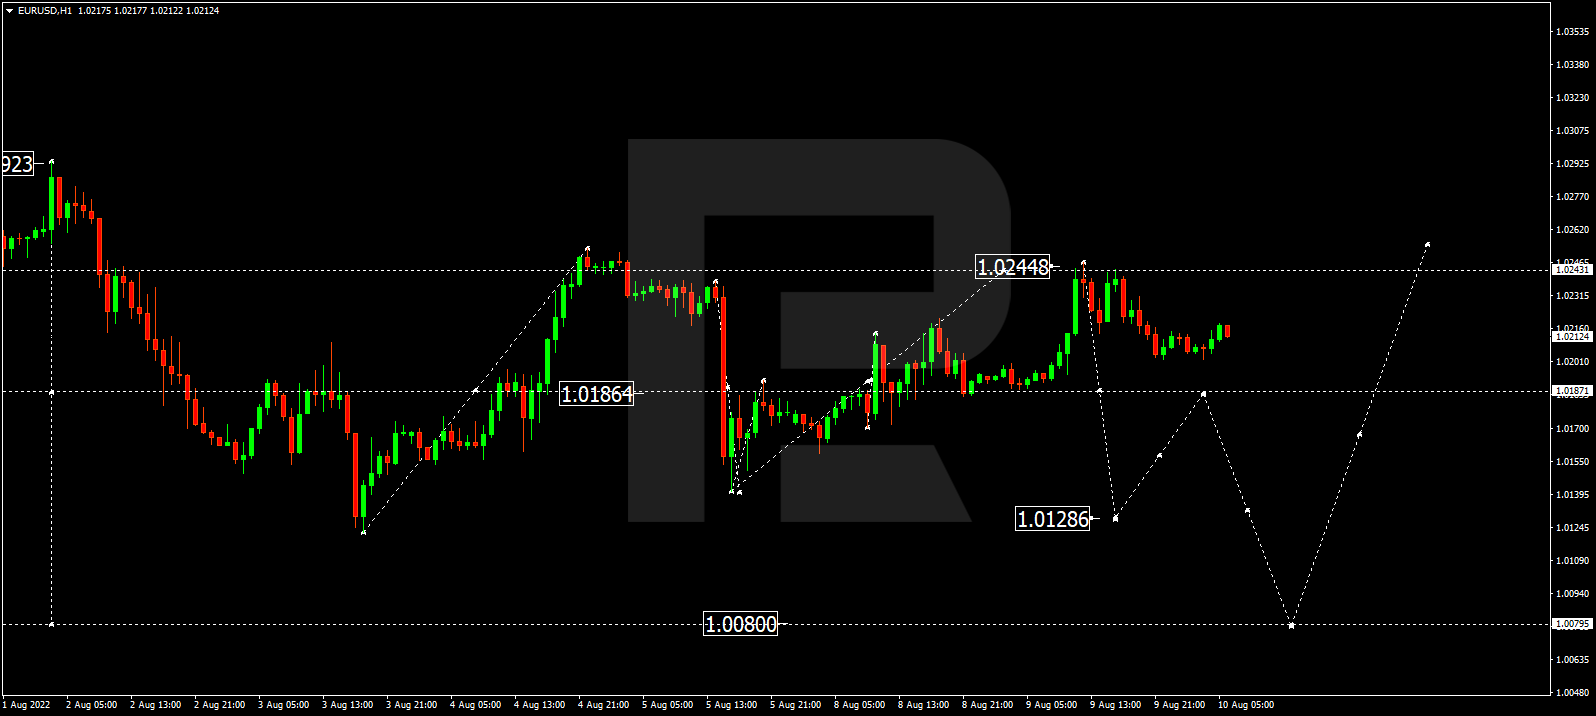
- Support levels: 1.0286, 1.0247, 1.0201, 1.0112, 1.0035, 1.0000
- Resistance levels: 1.0317, 1.0365, 1.0415, 1.050
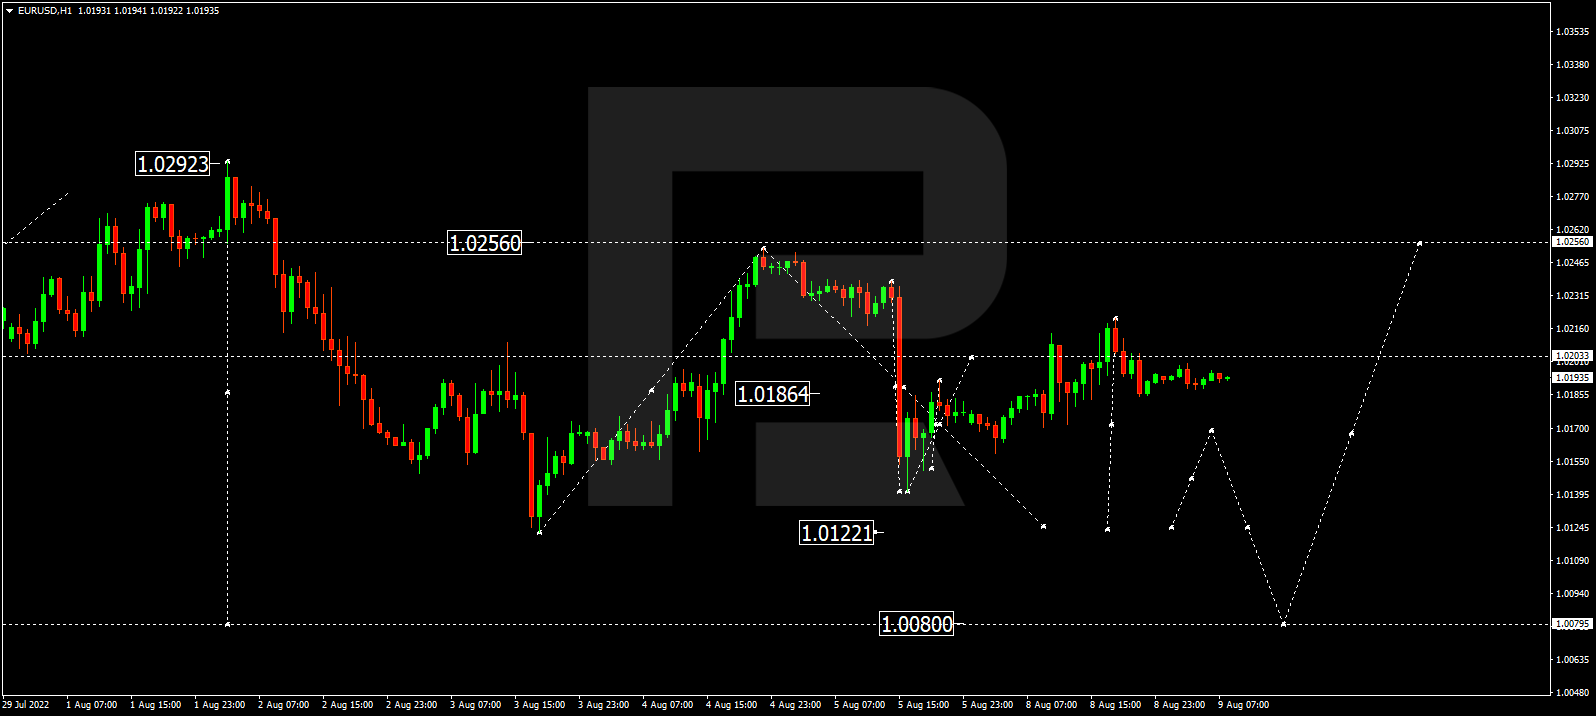
From a technical point of view, the trend on the EUR/USD currency pair on the hourly time frame is bullish. The price is now forming a small balance with the borders of 1.0286-1.0317. Under such market conditions, buy trades are best sought on intraday time frames from the support level of 1.0286, but with confirmation. Sell trades can be considered from the resistance level of 1.0317, but only after additional confirmation and with short targets.
Alternative scenario: if the price breaks down through the 1.0201 support level and fixes below, the downtrend will likely resume.

- – Eurozone Industrial Production (m/m) at 12:00 (GMT+3);
- – US Michigan Consumer Sentiment (m/m) at 17:00 (GMT+3).
The GBP/USD currency pair
- Prev Open: 1.2218
- Prev Close: 1.2199
- % chg. over the last day: -0.16%
In the UK, the week ends with Friday’s second quarter GDP report and manufacturing data. Markets expect weak data – GDP is forecasted to fall by 2.5% annually. For the quarter, GDP is forecast to be down by 0.2% after rising by 0.8% in the first quarter. The pound rose strongly on Wednesday thanks to US inflation data. But if GDP and manufacturing data are worse than forecast, the pound will likely lose ground.
- Support levels: 1.2130, 1.2063, 1.2000
- Resistance levels: 1.2240, 1.2294
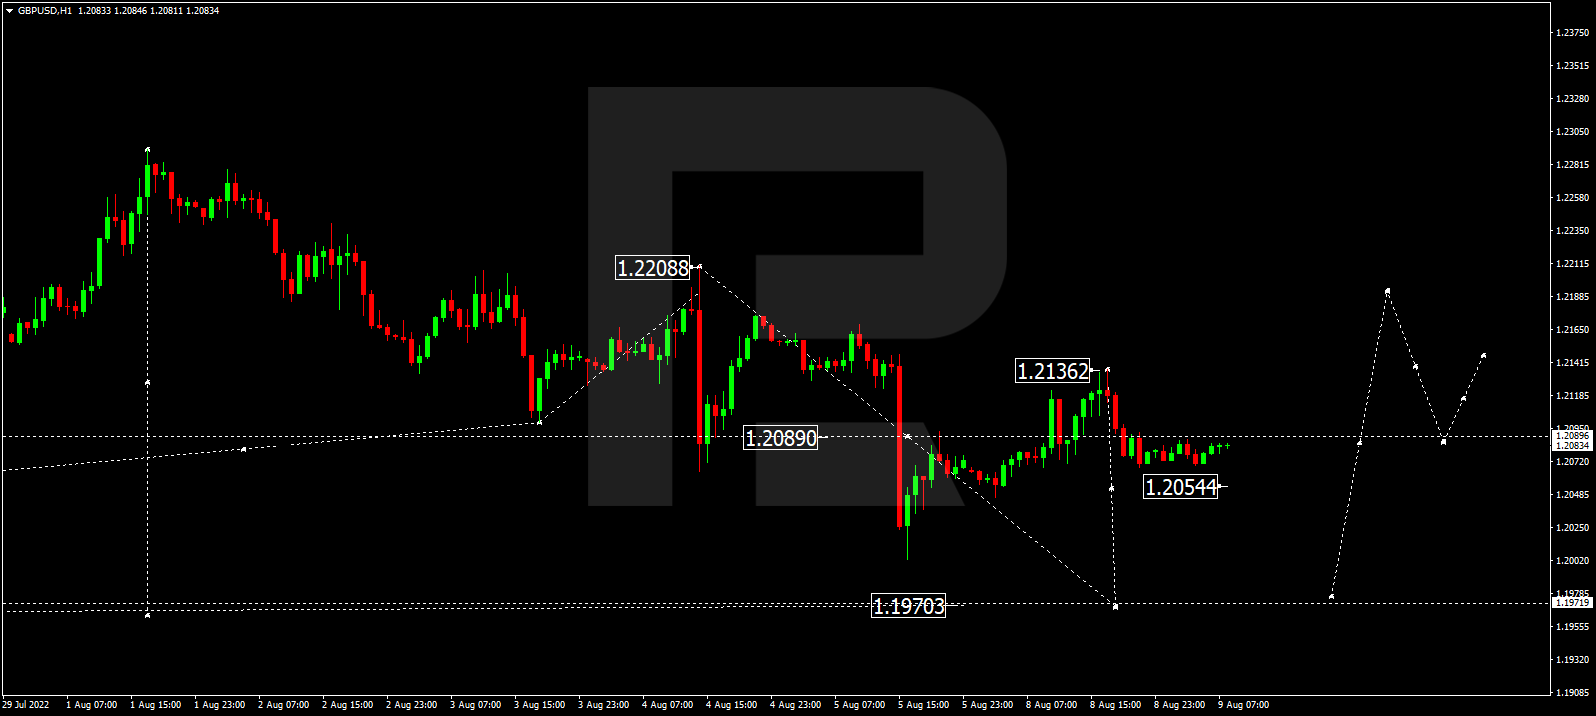
From the technical point of view, the currency pair GBP/USD trend on the hour timeframe is still upward. The price has corrected to the levels of the moving averages, where a small balance is forming. The MACD indicator has become inactive. At the moment, it is best to look for buy trades on intraday time frames from the support level of 1.2130, but only with confirmation. Sell trades can be considered from the resistance level of 1.2240, but only after additional confirmation and with short targets.
Alternative scenario: if the price breaks down through the 1.2063 support level and fixes below, the downtrend will likely resume.

- – UK GDP (m/m) at 09:00 (GMT+3);
- – UK Industrial Production (m/m) at 09:00 (GMT+3);
- – UK Manufacturing Production (m/m) at 09:00 (GMT+3).
The USD/JPY currency pair
- Prev Open: 132.89
- Prev Close: 132.97
- % chg. over the last day: +0.06%
According to the Corpay chief strategist, in connection with the prospect of less aggressive monetary and credit policy from the Federal Reserve System, the appetite for risk has somewhat recovered, which allowed the Japanese yen to strengthen against the background of the dollar decline. But investors should not count on a long-term downward trend, as the difference in interest rates is not in favor of strengthening the Japanese Yen.
- Support levels: 132.41, 131.08, 130.85
- Resistance levels: 134.36, 136.02, 137.12
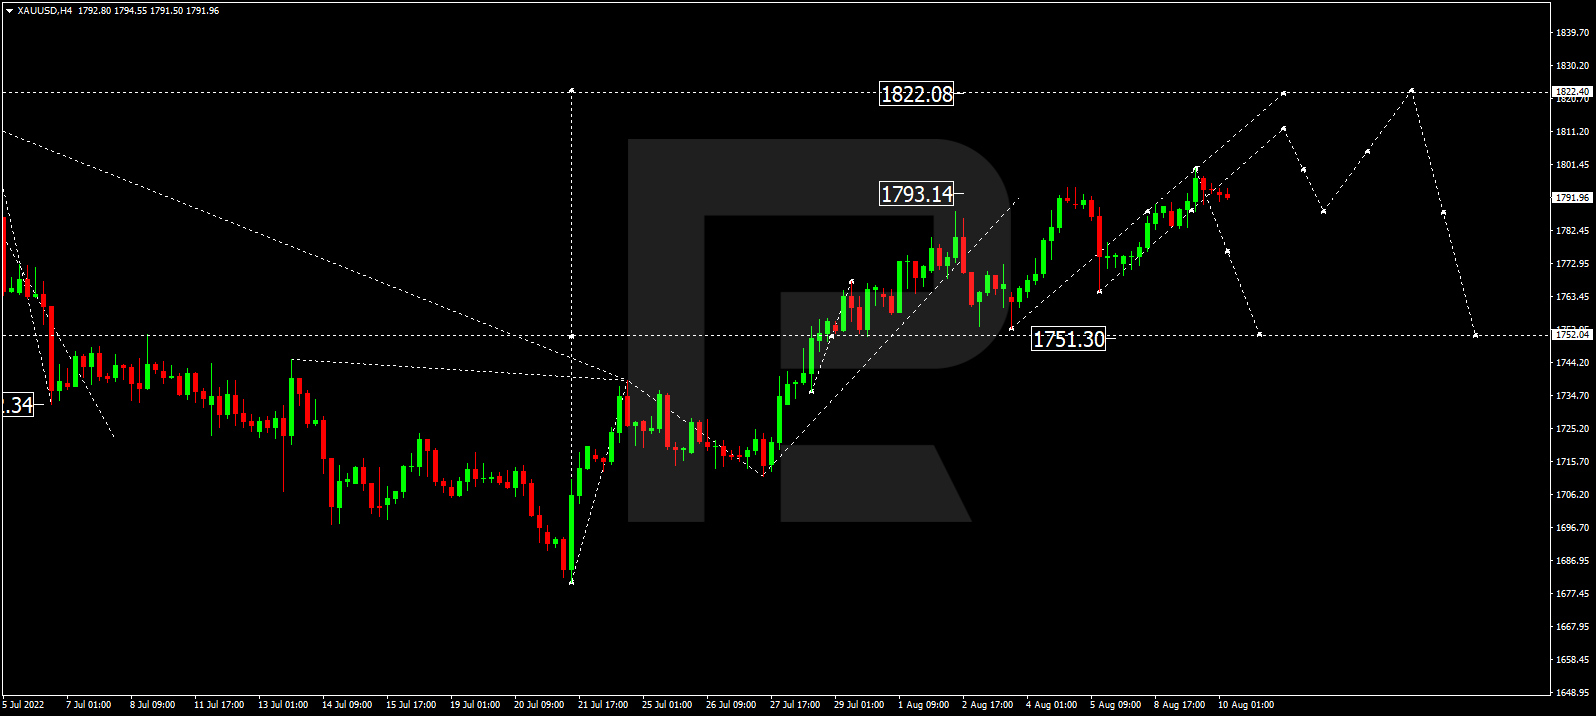
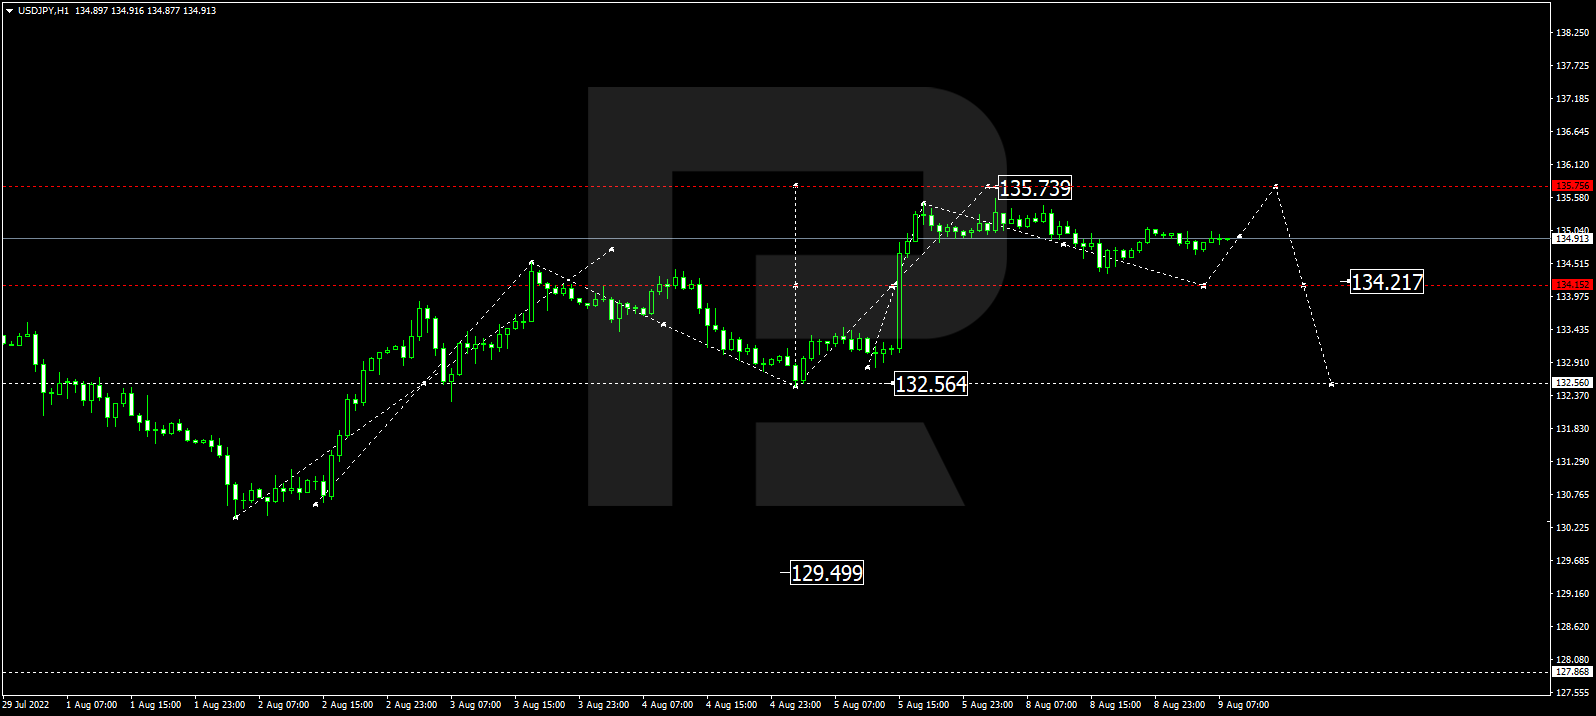
From the technical point of view, the medium-term trend on the currency pair USD/JPY is still bullish. The price has formed an accumulation zone above the 134.36 level, so a test of this zone is very likely. Under such market conditions, buy trades can be sought from the support level of 132.41, but with additional confirmation. For sell deals, it is possible to consider the level of resistance 134.36, but only with additional confirmation in the form of a reverse initiative, as fundamentally, USD/JPY quotes are inclined to grow.
Alternative scenario: If the price fixes above 136.02, the uptrend will likely resume.

The USD/CAD currency pair
- Prev Open: 1.2769
- Prev Close: 1.2760
- % chg. over the last day: -0.07%
Canadians have a chronic housing shortage, and the Canada Mortgage and Housing Corporation estimate that about six million housing units must be built by 2030 to make housing more affordable. Banks are considering lending to Canadians, but amid rising interest rates, the appeal of such lending and mortgage programs is falling. According to a recent Manulife survey, about a quarter of Canadian homeowners say they will have to sell their properties if interest rates continue to rise. A recession is also looming, which could prove disastrous for already overstretched owners.
- Support levels: 1.2750, 1.2701
- Resistance levels: 1.2817, 1.2871, 1.2918, 1.2965
In terms of technical analysis, the USD/CAD currency pair trend has changed to bearish. The price has consolidated below the priority change level and below the moving averages. The MACD indicator has become negative, but the divergence is observed. Under such market conditions, buy trades should be considered on the lower time frames from the support level 1.2750, but only with confirmation and short targets. For sell deals, it is better to consider the resistance level 1.2817 or 1.2871, but with confirmation.
Alternative scenario: if the price breaks out and consolidates above the 1.2871 resistance level, the uptrend will likely resume.

By JustForex
This article reflects a personal opinion and should not be interpreted as an investment advice, and/or offer, and/or a persistent request for carrying out financial transactions, and/or a guarantee, and/or a forecast of future events.