Fibonacci Retracements are a common technical analysis technique in financial trading based on a famous mathematical sequence. In this article, we touch on what Fibonacci Retracements are, what levels most traders or investors use and finally, we look at a few Fibonacci Retracements Trends Trading or Trend-following examples.
What are Fibonacci Retracements?
The Fibonacci Retracement indicator is a powerful tool that can help you make better trading decisions. It is one of the most common technical analysis techniques used for analyzing the financial markets. It is based on the Fibonacci sequence, which is a series of numbers that have a special relationship to each other. Many professional traders and analysts look to fibonacci retracements, also known as fibo levels or fib levels, to predict support and resistance price areas. Retracements can be used to detect potential turning points in price as well.
To analyze price using Fibonacci Retracements, traders will frequently look for retracement levels at 23.6%, 38.2%, 50%, and 61.8% of recent prices moves. These percentages represent possible areas of support or resistance where the price may retrace before continuing in the original direction. Traders may also use Fibonacci Retracements to identify potential price turning points by looking for reversals at these same levels.
Who was Fibonacci? What are Fibonacci Numbers?
Fibonacci was an Italian mathematician from Pisa, also known as Leonardo of Pisa, who is famous for his Fibonacci numbers, a mathematical sequence that happens to appear in many places including in nature and in statistics. Fibonacci did not invent this numeric sequence as it is believed to have originated in India. His 1202 book “Liber Abaci” introduced the sequence to Western European mathematics, and the Fibonacci sequence has been used ever since in mathematical and scientific contexts.
The Fibonacci sequence appears in nature, in the arrangement of leaves on a stem, the fruit sprouts of a pineapple, the flowering of an artichoke, an uncurling fern and the arrangement of a pine cone, as well as many other places. The Fibonacci sequence is also found in the spiral galaxies of the universe. In fact, the Fibonacci sequence can be found in everything from the smallest of organisms to the largest of structures in the cosmos.
 The Fibonacci sequence is not just a mathematical curiosity. It has applications in engineering, computer science, biology and can be used to model or predict population growth. The Fibonacci sequence is used to generate efficient algorithms and, for our focus today, can be used to help with trading in the financial markets.
The Fibonacci sequence is actually a simple straight-forward pattern. Start with 0 and 1 and add them to get 1. Then use a pattern of adding each number to the preceding number to get the next number. Follow that pattern over and over and over again. 0 and 1 equals 1. Then add 1 and 1 to equal 2. Next, 2 and 1 equals 3 and so on. So the first fifteen Fibonacci numbers look like this: 0, 1, 1, 2, 3, 5, 8, 13, 21, 34, 55, 89, 144, 233, 377. As you can see, once you get past the first five or so numbers, they can start to really add up and they just keep on going.
There is also another notable aspect to the Fibonacci sequence that is famous as well – the golden ratio. Each of the numbers in Fibonacci sequence are approximately 1.618 larger than the preceding number. This number is considered the golden ratio and this fibonacci ratio can be found in many aspects of nature and in many mathematical, scientific and artistic constructions by humans. This golden ratio can also found in the proportions of the human body.
How to use Fibonacci in financial trading?
Ok, since we have a general understanding of the Fibonacci numbers, how can we use them to help in our trading? Well, to be honest, there are a lot of different ways that traders use Fibonacci numbers in financial trading, probably more than any one person could ever learn. Some use them to predict market movements, while others use them to set stop-losses or take-profits. There are those who use Fibonacci numbers for both, as well as traders who use different types of Fibonacci strategies.
 The most common use for Fibonacci numbers that I see is to use them for support and resistance levels. This is where the Fibo Retracements indicator comes in. The Retracement indicator allows you to display specific levels on your chart that are derived from the Fibonacci sequence. This indicator, like most indicators, can be used in conjunction with other technical analysis tools, such as trend lines and moving averages, to help confirm trading signals.
The Fibo retracement indicator is a versatile tool that can be used by traders of all levels of experience as well. It can be very easy to use once you get the hang of it. Traders, investors and analysts of all stripes use the retracements because it allows them to specifically pinpoint areas that price may return to or bounce off of.
Retracements are extensively used in just about every major market including forex, stocks, bonds, commodities and cryptocurrencies. Fibo Retracement levels can also be used for short-term trading, day trading, swing trading or long-term trading strategies. By understanding how the indicator works and how to use it, traders can improve their chances of success in the financial markets.
How to Plot the Fibonacci Retracement Levels?
The Fibonacci Retracement tool, as the name implies, is used to identify retracement levels. A retracement is a temporary reversal in the direction of a price move. It is important to remember that Fibonacci Retracement levels are not exact. They are only potential support and resistance levels. It is also important to use other technical indicators to confirm whether a retracement is likely to occur.
The most frequent and most popular Fibonacci levels that are used on most technical indicators are at 0.00%, 23.6%, 38.2%, 50.0%, 61.8%, 76.4% and 100%.
To begin using Fibonacci Retracements, you will first have to add the indicator to your charting platform or trading software. Most modern trading platforms will have a built-in Fibonacci Retracement tool or indicator and trading education content that explains how to use it. The correct retracement tool also may be found under Fibonacci Strategies, depending on your platform or software.
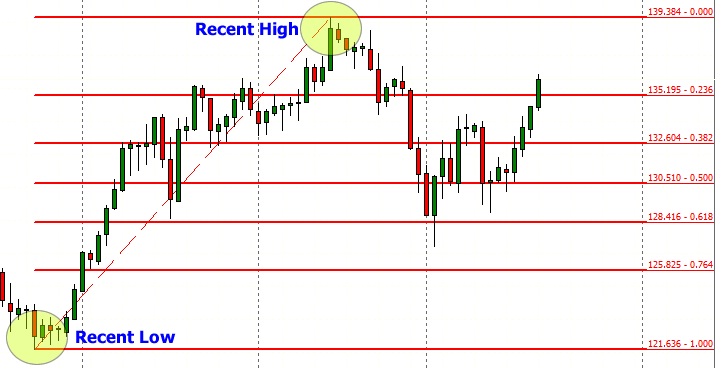
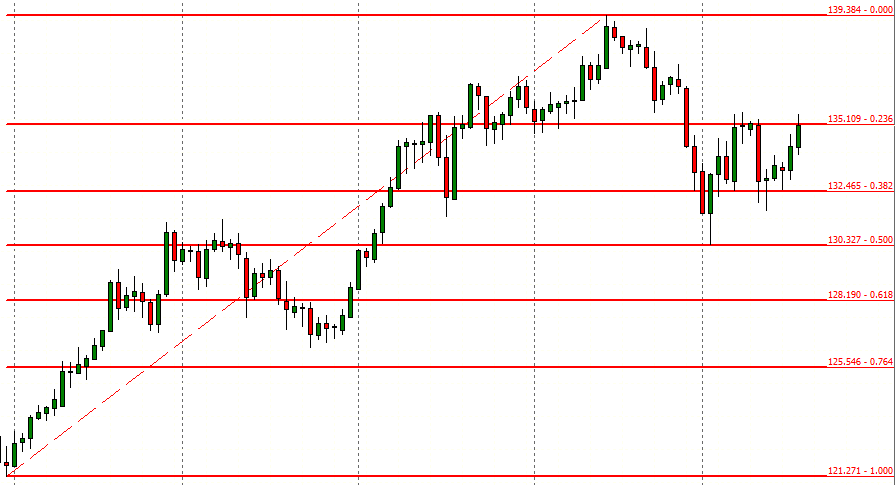
In the chart above, we have started our retracement from the recent low and extended it to the recent high. This was an up-trending market, so the 1.00 or 100% level is on the bottom and the 0% level is at the top. In this time-frame, price has retraced to the 61.8% level and resumed an up-trend.
Find the Recent High and Recent Low
When you find the Fibonacci Retracement tool or indicator, you will have to find a swing high and a swing low to start your analysis. Choose the highest high and the lowest low over a certain time-frame you would like to trade. Potentially on a daily chart, you could choose prices from the past month, two months or more to analyze.
If you are analyzing a down-trending market, take your indicator and drag it from the most recent highest high to the most recent lowest low. After doing this, you should see the 1.000 (or 100%) retracement level at the top and the 0.00% retracement level at the bottom. In between, you will see the 23.6, 38.2, 50.0, 61.8 and the 76.4 fib levels as well.
If you are analyzing an up-trending market, you will see the exact opposite where 100% is at the bottom and 0.00% is at the top. This will make sense if you think about it. If price at bottom is 100% and the 0% is at top and then if price drops all the way back down from 0% to the 100% level, then price has “retraced” 100% of its previous uptrend move (and the opposite for downtrends).
Using Fibonacci Retracements for Trend Following or Trend Trading Strategies
Now that you have the Retracement Indicator on your chart, let’s start to understand how to use it. One of the best ways to utilize Fibonacci Retracements for trading, in my opinion, is to jump on an established trend. I think this is the easiest way to use Fibos and the Retracements are the perfect tool for this type of trend following execution. You can hopefully get in on a strong trend and profit without having to spot the trade before everyone else does. Let’s look at what trends are and why would we want to trade trends.
Beginners: What are Trends and Why Trade them?
When it comes to trading, there are different approaches that can be taken in order to make a profit. Some traders focus on technical analysis and try to identify patterns in order to predict future price movements. Others focus on fundamental analysis and look at factors such as economic indicators in order to make trading decisions. And then there are those who focus on trends. In my opinion, the best types of trades combine multiple types of analysis that put the odds in a trader’s favor.
Trend trading, also known as momentum trading or trend following, is a strategy that involves buying assets that are rising in price and selling them when they start to fall or when the trend is exhausted. The idea is to ride the wave of a trend and make profits along the way. Traders who follow this strategy are commonly referred to as “trend followers.” Once a trend has identified a trend, traders will need to decide when to buy and when to sell. This decision will be based on a number of factors, including the trader’s risk tolerance and their time horizon.
It’s important to note that trend trading is not without its risks and there are a few things that trend traders need to be aware of. The first is that trends don’t last forever. Trends can reverse and when this happens, traders can find themselves on the wrong side of the trade. There will be times when the price of an asset starts to fall after it has been rising for some time. It’s important to have a exit strategy in place so that you can sell before the trend reverses. Another thing to keep in mind is that not all trends are created equal. Some trends are stronger than others and last longer. These are the trends that you want to focus on.
A Fibonacci Forex Retracement Trading Example: The Trend Pullback
As a general rule, if the market is in an uptrend and you believe it will continue, then you will want to look for opportunities to buy on the price pullback at the 23.6% or the 38.2% retracement levels. Depending on what the trend looks like (early trend, late trend?) and if you have other fundamental information that makes you feel the trend will continue (how strong are the fundamental factors?), this could include the 50.0% and the 61.8% retracement levels as well.
An Example: See this classic setup in the USD/JPY currency pair on the daily chart.
When the US Dollar strength against the Japanese yen pushed a USDJPY breakout above 116.35 in March of 2022, the bull trend was on in a strong way. Fundamental forces for this market included rising inflation, stronger bond yields for the USA versus Japan and the fact that the US Federal Reserve was sharply raising its benchmark interest rate while the Bank of Japan was standing pat and still had accommodating economic policies while most other central banks were going the other way.
Depending on when you noticed this trend and the underlying fundamental picture, you could have tried to jump on this strong trading action a few different times. However, perhaps the best method would have been using the Fibonacci Retracement in mid-to-late May 2022 with a buy order around the 23.6% retracement level (already acting as support a few times by mid-May). A stop-loss order to be placed at the 38.2% retracement or just below that psychological support level of 125.00.
Daily Chart: USDJPY
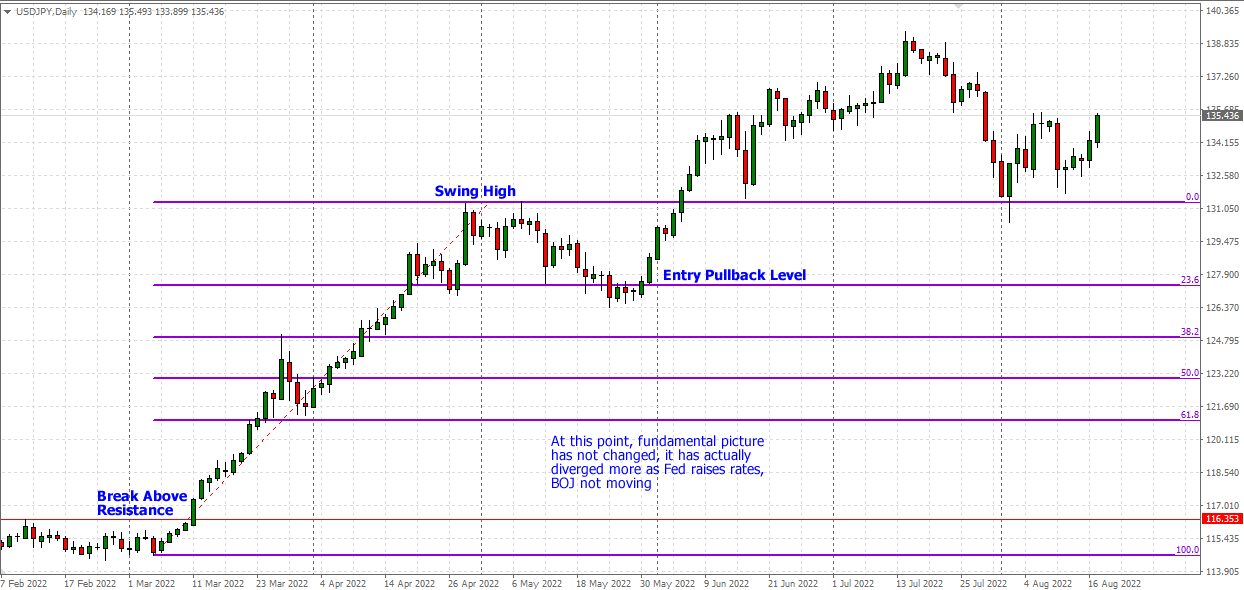
This trend reversed a little below the 23.6% retracement level, bounced up and kept going higher as the interest rate differential and central bank policies continued to diverge in favor of the US. Ultimately, the trend rose to a 20-year high for the USDJPY currency pair. This was above and beyond our Fibonacci Retracement Indicator that we placed on the chart (above 0 and going). The currency pair remains in an uptrend as of August 2022.
A Stock Market Trading Example: Trend Reversal with RSI Divergence
This next trade setup is more near and dear to my heart because I love RSI Divergence! It is a setup that happens in all markets from time to time and is very easy to see if you are looking for it. I will say that it is a setup that is much rarer (for good reason) than others like say a moving average crossover or a MACD signal. I see the RSI Divergence as a trend exhaustion indicator that signals the “possibility” of an imminent trend change (look for confirming factors, either sentiment or fundamentals as well). I also like to use the RSI Divergence on the weekly charts as I find it the most reliable but it does happen on all time frames.
What is a divergence? A divergence is the difference in price between two similar acting assets or in this case, between an indicator and price that usually go in the same direction. It is important because it can be used to signal a change in market conditions.
One thing of note on the chart below is – I am using a RSI smoothed average (red line – 3 periods) of the regular RSI (which is the skinny light line). This is just my preference as I like it better than just the basic RSI.
For some context, this first half of the year in 2022 had been a tough one for stocks. The overall narrative is that stocks are going down and going to keep going down as far as the eye can see. Inflation! Bond yields to the moon! Crypto death! Technology stocks are dead! Worst Recession in History Coming! These are some of the headlines I feel were being screamed at market watchers since January. Some may eventually come true but many are probably over-hyped and sensationalized.
The SPY peaked in January 2022 around the 480.00 price level and started on a its downward path. US Treasury bonds were dropping as well with inflation rising and the Federal Reserve raising the benchmark interest rate to combat that inflation. The 10-Year bonds yields were popping (yields move in opposite of bond prices) and hit a multi-year high in June 2022 right near the 3.50% level. Then a funny thing happened, both the SPY and 10-Year yields trends stalled out over the next bunch of weeks (both markets exhibited RSI Divergences).
Here is recent setup that happened in the S&P 500 ETF (SPY)
Weekly Chart: SPY
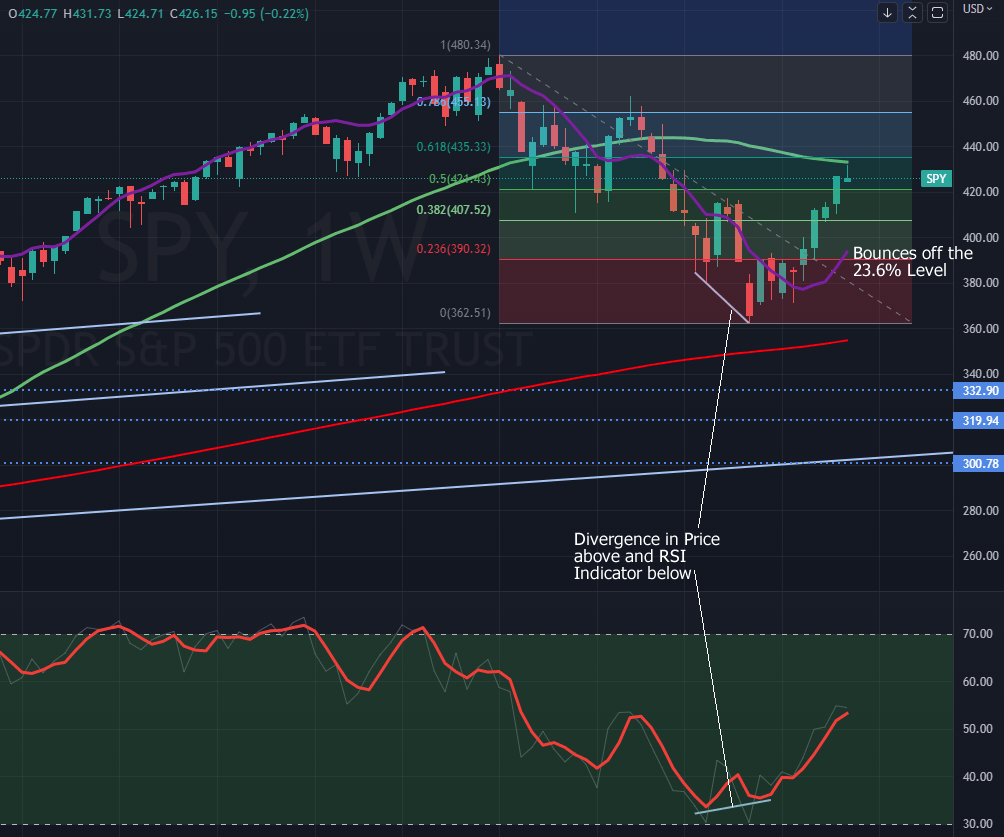
Using the Retracement Indicator from the high point (January 2022 recent peak) to the June low point (where price hit and then bounced around above this for the next four weeks while the RSI turned higher). Here we are looking for the opposite of our prior Forex example and hope to use the 23.6% key level as a launching point. Instead of betting on a trend continuation, we are using the RSI Divergence to indicate a trend exhaustion with the hopes that the trend is reversing.
As you can see from the chart, so far so good. The exiting point for this trade is a personal choice, but with prices rising, there are multiple fibo lines that could be used as exits as well as the 50-week moving average residing up ahead. This current setup could possibly be just a blip on a larger downtrend to come but hopefully illustrates a tactic to trade a trend reversal with the help of the RSI.
Fibonacci Trading Conclusion:
I hope this article has helped to give some perspective and examples on using the Fibonacci Retracement Indicator in the markets. Hopefully it will further your education and give you another good trading tool in your arsenal. I have found in my own trading that the best way to use this Fibonacci tool is in conjunction with different trading strategies, technical indicators, fundamental indicators and sentiment indicators. I feel it is best to utilize all different types of analysis that will give me unique clues to what is or what could be happening in the market. Overall, the Retracement Indicator is a valuable tool for technical analysts and is so popular for a reason – once you get the hang of it, it can be an easy addition to your trading toolkit.
Article by Taylor Wilman for InvestMacro