By JustForex
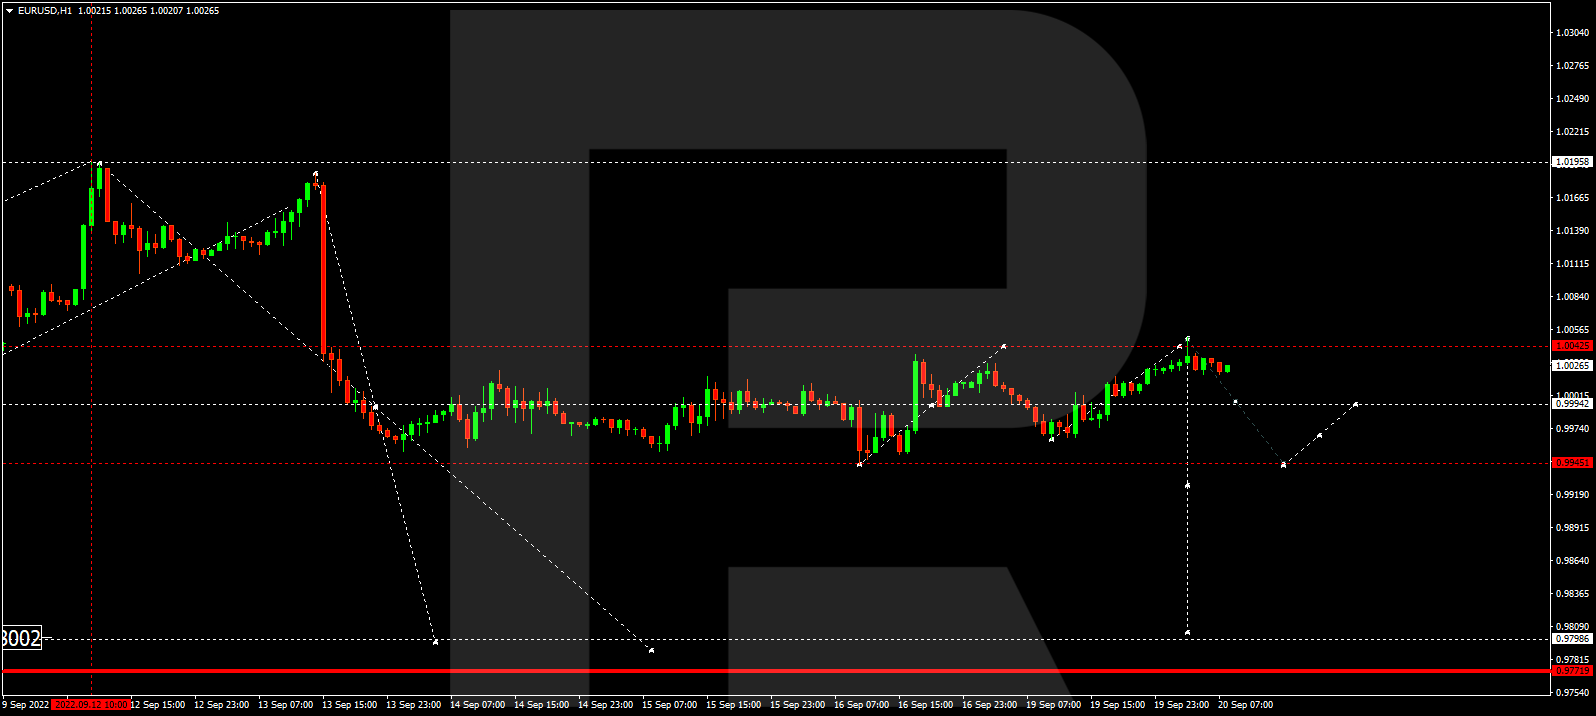
The EUR/USD currency pair
- Prev Open: 0.9965
- Prev Close: 0.9836
- % chg. over the last day: -1.31 %
The Federal Reserve unanimously raised its target range for Fed funds by 75 basis points and raised its rate hike forecasts. The Fed Funds rate for the end of 2022 is now expected to be 4.4%, indicating a high probability of another 75bp increase in November and 50bp in December. Monetary policy is expected to tighten further in 2023 and the year-end rate is expected to be 4.6% before falling to 3.9% in 2024 and 2.9% in 2025, with the long-term forecast remaining at 2.5%. The US Federal Reserve cut annualized GDP growth in Q4 2022 to 0.2% from 1.7% and in 2023 to 1.2% from 1.7%. And while the markets expected the 0.75% increase, this further aggressive attitude of the US Fed was a surprise. As the dollar index rose, the euro fell to a 20-year low.
- Support levels: 0.9800
- Resistance levels: 0.9949, 1.0048, 1.0111, 1.0162, 1.0230
From the technical point of view, the trend on the EUR/USD currency pair on the hourly time frame has changed to bearish. The price is trading below the moving averages, and sellers’ pressure is still high. The MACD indicator is deeply negative, but divergence can be seen on several timeframes. It is best to look for sell trades from the resistance level of 0.9949. Buy trades can be considered from the round level of 0.9800, but only with confirmation.
Alternative scenario: if the price breaks out through the resistance level of 1.0111 and fixes above it, the uptrend will likely resume.

- – US Initial Jobless Claims (w/w) at 15:30 (GMT+3).
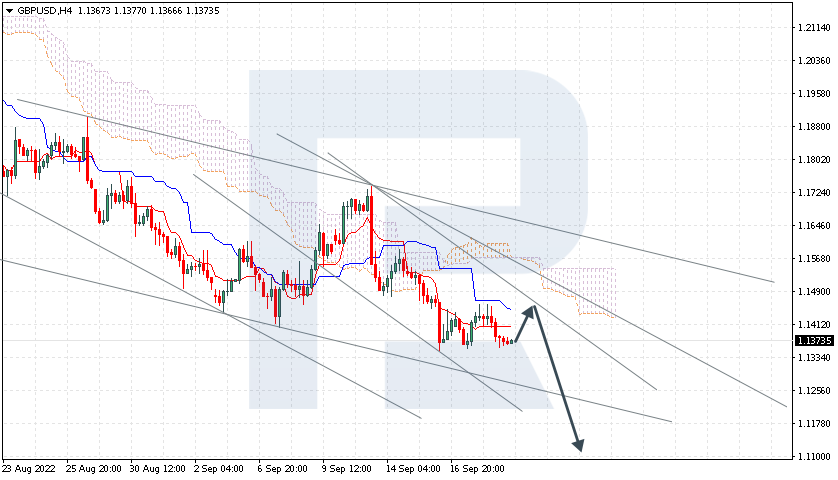
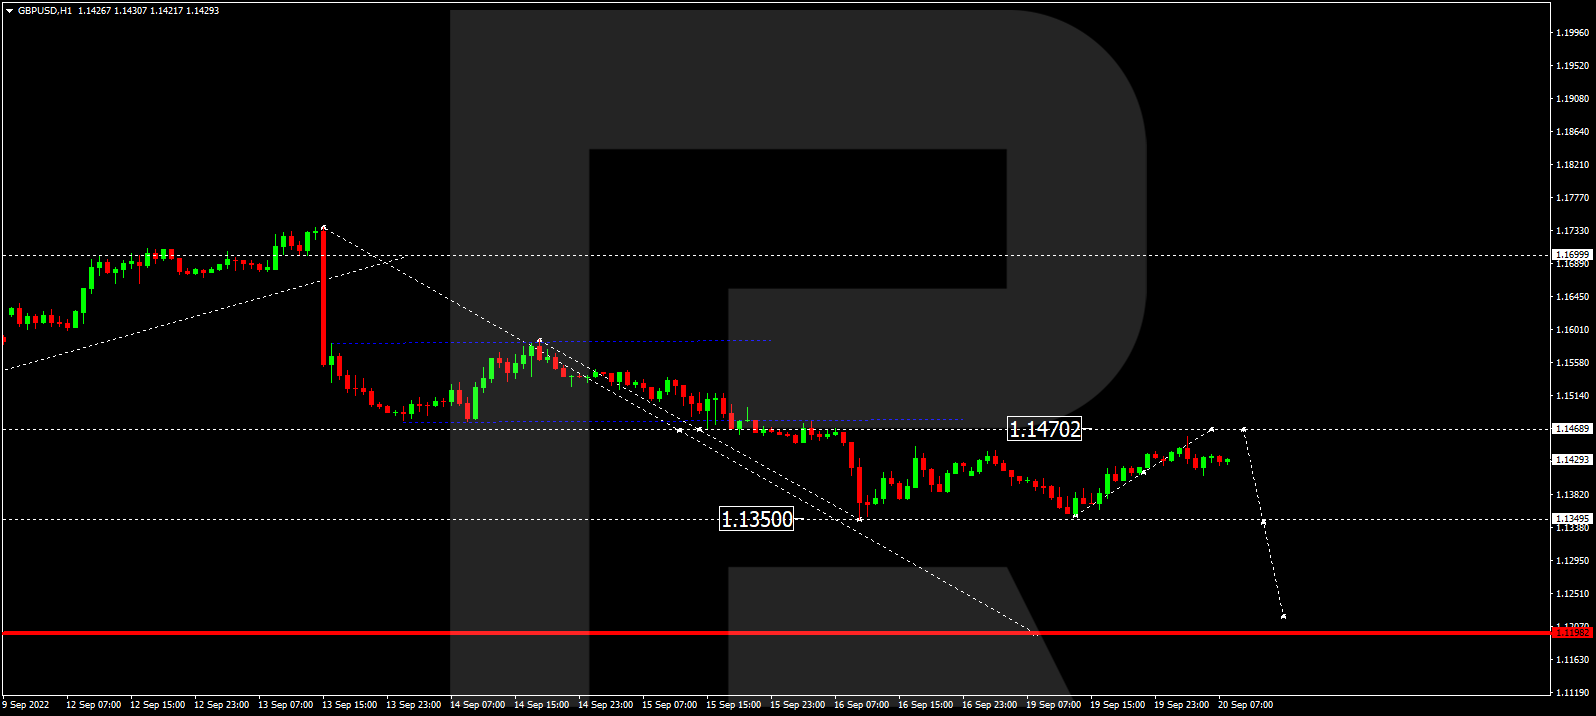
The GBP/USD currency pair
- Prev Open: 1.1368
- Prev Close: 1.1262
- % chg. over the last day: -0.94 %
The Bank of England will hold its monetary policy meeting today. Analysts forecast that the central bank will raise the interest rate by 0.5%. A 0.75% hike is also being considered, but with the new UK government looking to cap household energy bills for the next two years, such a move is considered unlikely. At the moment, the British pound is under pressure from a rise in the dollar index, especially after the Fed’s aggressive plans to further tighten monetary policy by raising interest rates until the second half of 2023. As the dollar index rose, the pound sterling fell to a 37-year low.
- Support levels: 1.1200
- Resistance levels: 1.1363, 1.1449, 1.1626, 1.1693, 1.1816, 1.1901, 1.1994
From the technical point of view, the trend on the GBP/USD currency pair on the hourly time frame is bearish. At the moment, the price is trading below the moving averages, and sellers’ pressure remains. The MACD indicator is in the negative zone, but there is a divergence, and it is getting stronger. Sell trades are better to look for on the intraday time frames, and the nearest resistance level is 1.1363. Buy trades can be considered from the round level of 1.1200, but only with confirmation.
Alternative scenario: if the price breaks out of the 1.1626 resistance level and fixes above it, the uptrend will likely resume.

- – UK BoE Interest Rate Decision at 14:00 (GMT+3);
- – UK MPC Meeting Minutes at 14:00 (GMT+3).
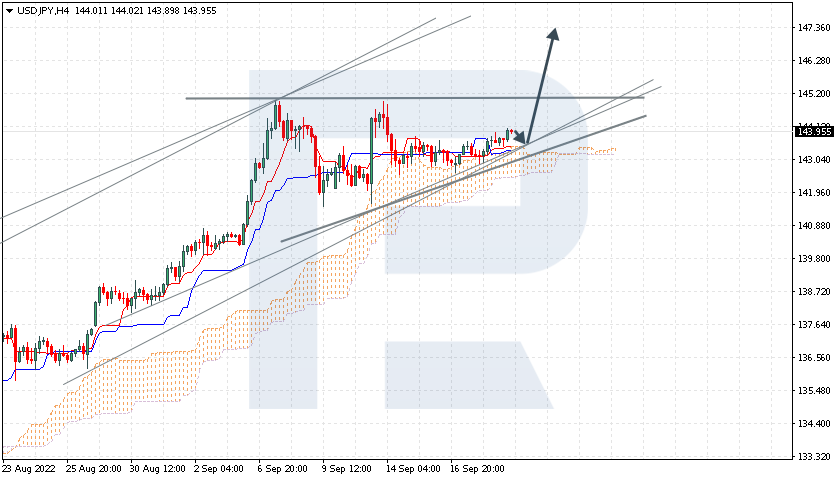
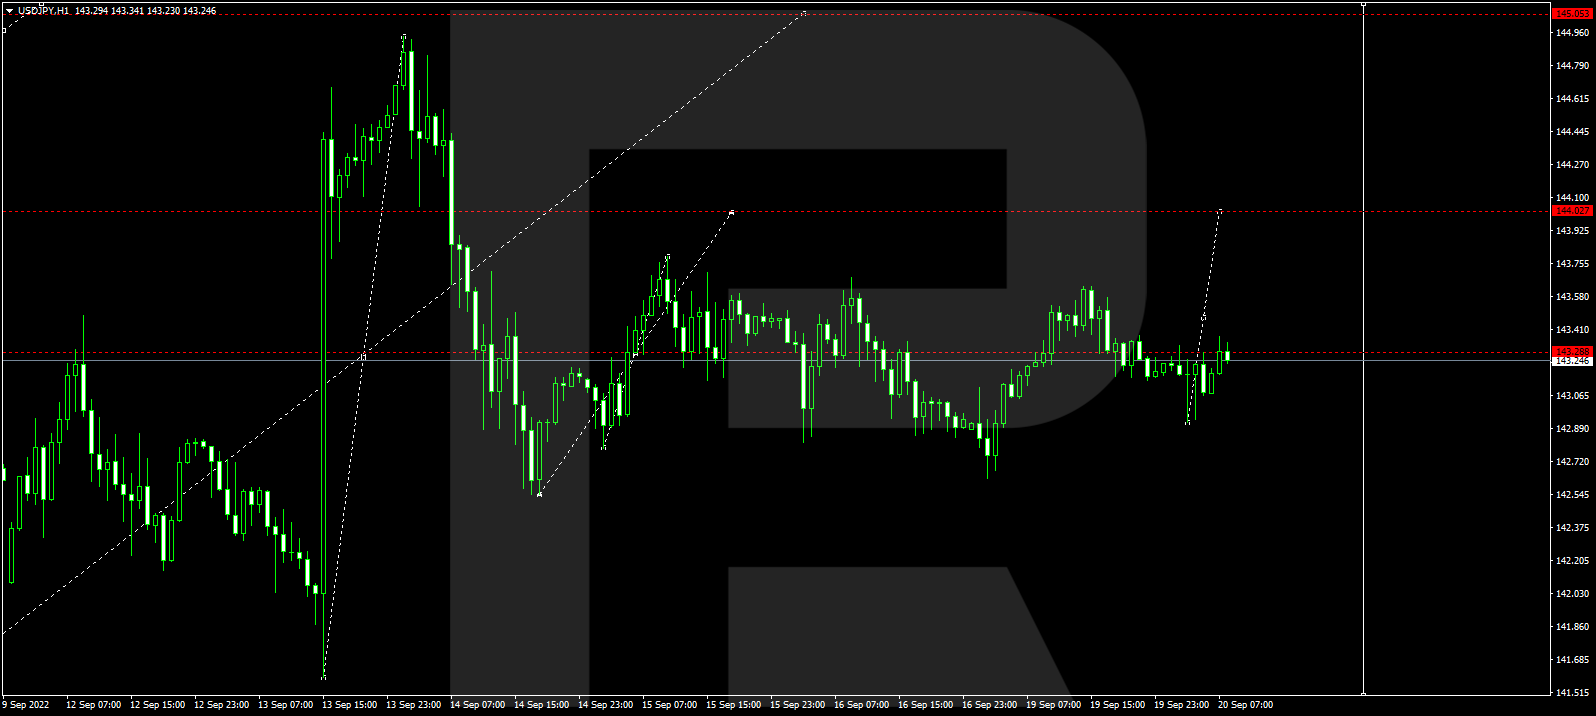
The USD/JPY currency pair
- Prev Open: 143.71
- Prev Close: 144.06
- % chg. over the last day: +0.24 %
The Japanese yen showed surprising resilience to the dollar index gains yesterday, indicating that traders see a threat of intervention by the Bank of Japan to strengthen the Japanese yen. The Bank of Japan’s zero interest rate stance, even as inflation in Japan has reached its highest annual rate in nearly eight years, has traders betting that the central bank will eventually have to abandon an extensive bond-buying project that has kept 10-year bond yields at zero. At its meeting today, the central bank kept all key elements of its policy unchanged.
- Support levels: 142.10, 141.00, 139.61, 138.78, 137.65, 136.80, 135.20
- Resistance levels: 145.00
From the technical point of view, the medium-term trend on the currency pair USD/JPY is bullish. The MACD indicator is in the positive zone, and there is slight pressure from buyers. Under such market conditions, buy trades can be searched for on intraday time frames but with confirmation. Selling can be sought from the resistance level of 145.00, but only with additional confirmation, as fundamentally, USD/JPY quotes are inclined to grow.
Alternative scenario: If the price fixes below 142.10, the downtrend will likely resume.

- – Japan BoJ Outlook Report (Tentative);
- – Japan BoJ Interest Rate Decision (Tentative);
- – Japan BoJ Press Conference at 09:30 (GMT+3).
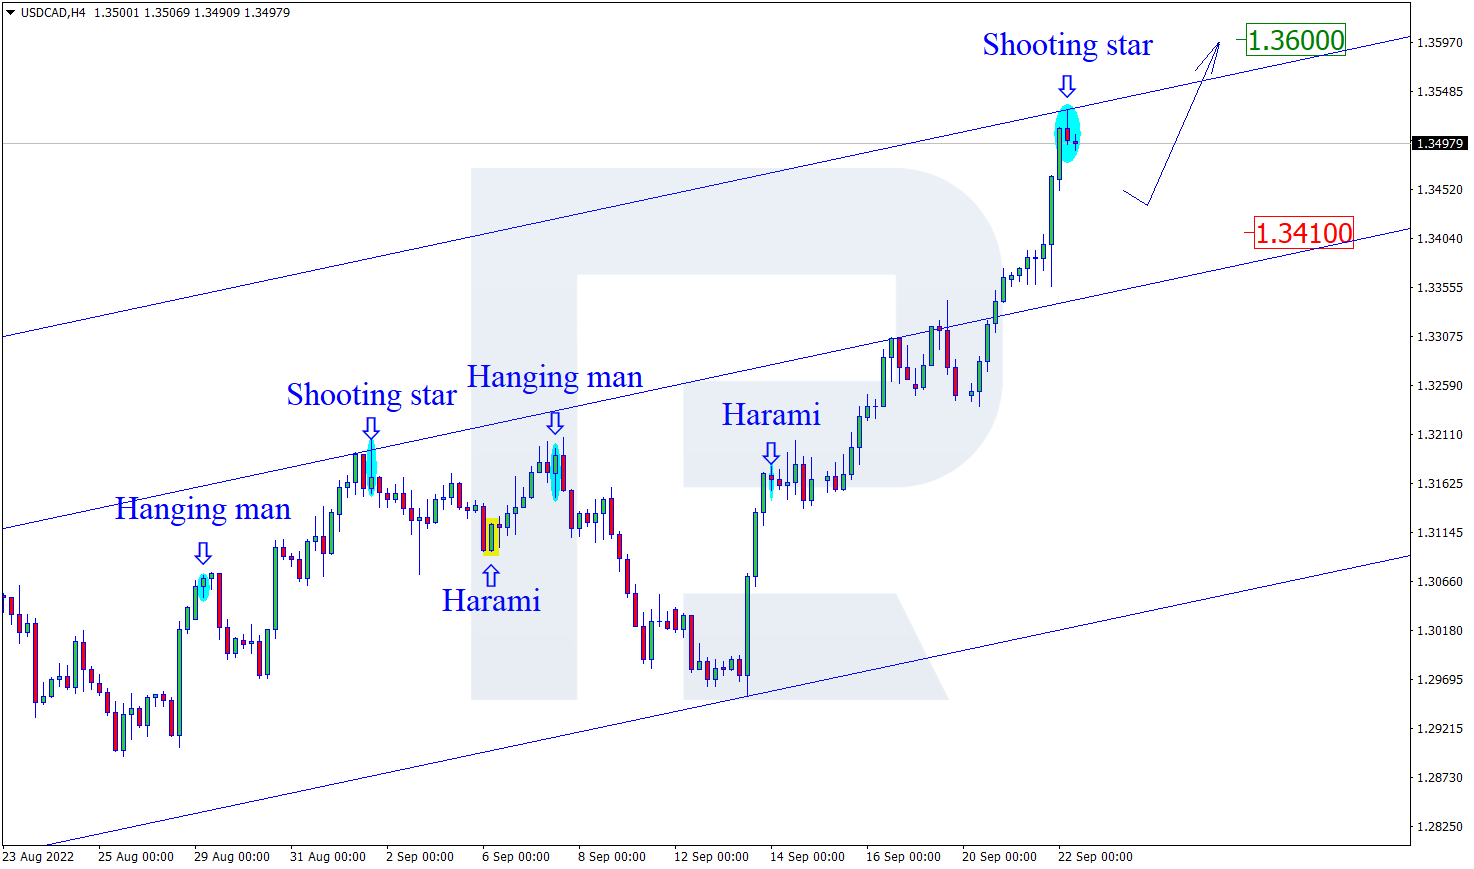
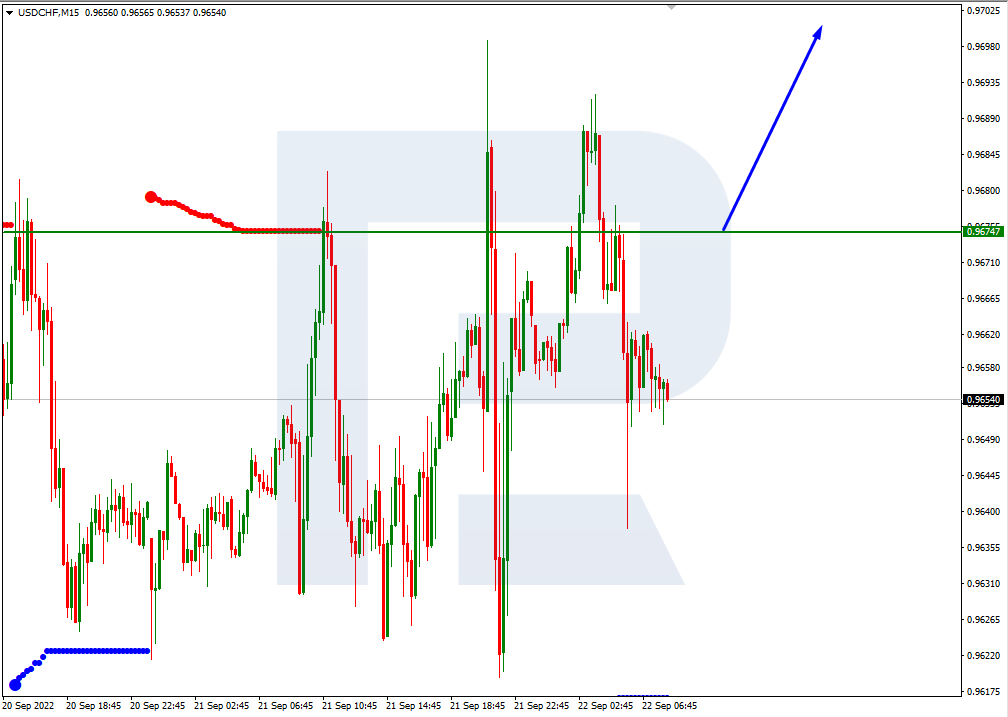
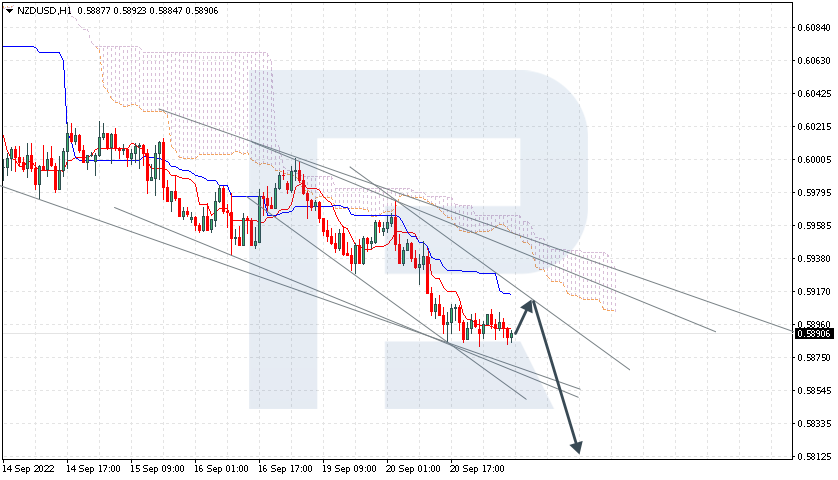
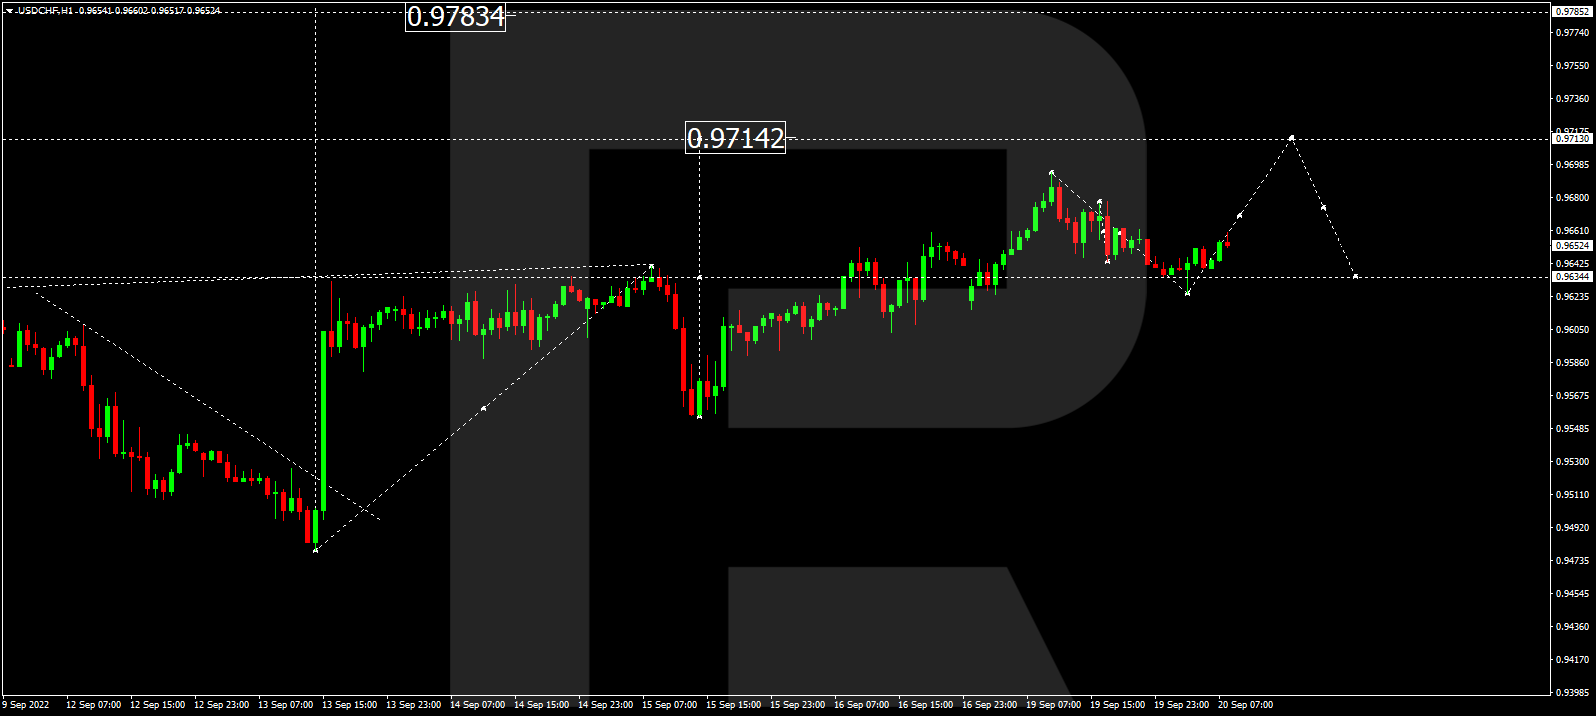
The USD/CAD currency pair
- Prev Open: 1.3365
- Prev Close: 1.3366
- % chg. over the last day: +0.76 %
The Canadian dollar has reached a two-year low. The Canadian currency is declining for two main reasons. The first is that the dollar index reached a 20-year high on the back of aggressive actions of the US Federal Reserve. The second is that oil is declining due to higher inventories as well as expectations of lower economic activity. When there is a lot of uncertainty about the global outlook, investors tend to look for safe assets such as the US dollar, bonds, and gold.
- Support levels: 1.3390, 1.3298, 1.3212, 1.3053, 1.2990, 1.2958, 1.2936, 1.2900
- Resistance levels: 1.3531, 1.3561
From the point of view of technical analysis, the trend on the USD/CAD currency pair is bullish. The MACD indicator has become positive, there is buying pressure, but the divergence is increasing. The price has reached the daily resistance zone. Under such market conditions, buy trades should be considered on the lower time frames from the support level of 1.3390. The best way to sell is to consider the resistance level of 1.3531 or 1.3561, but only after an additional confirmation in the form of a false breakout.
Alternative scenario: if the price breaks down and consolidates below the 1.3212 support level, the downtrend will likely resume.

By JustForex
This article reflects a personal opinion and should not be interpreted as an investment advice, and/or offer, and/or a persistent request for carrying out financial transactions, and/or a guarantee, and/or a forecast of future events.