Article By RoboForex.com
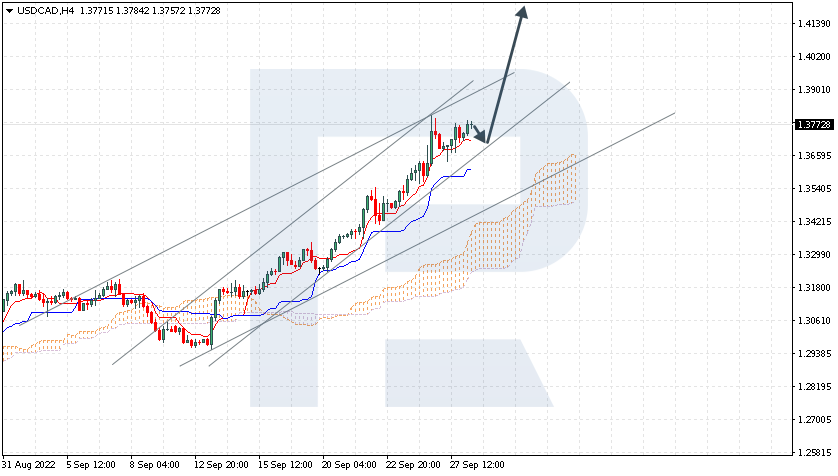
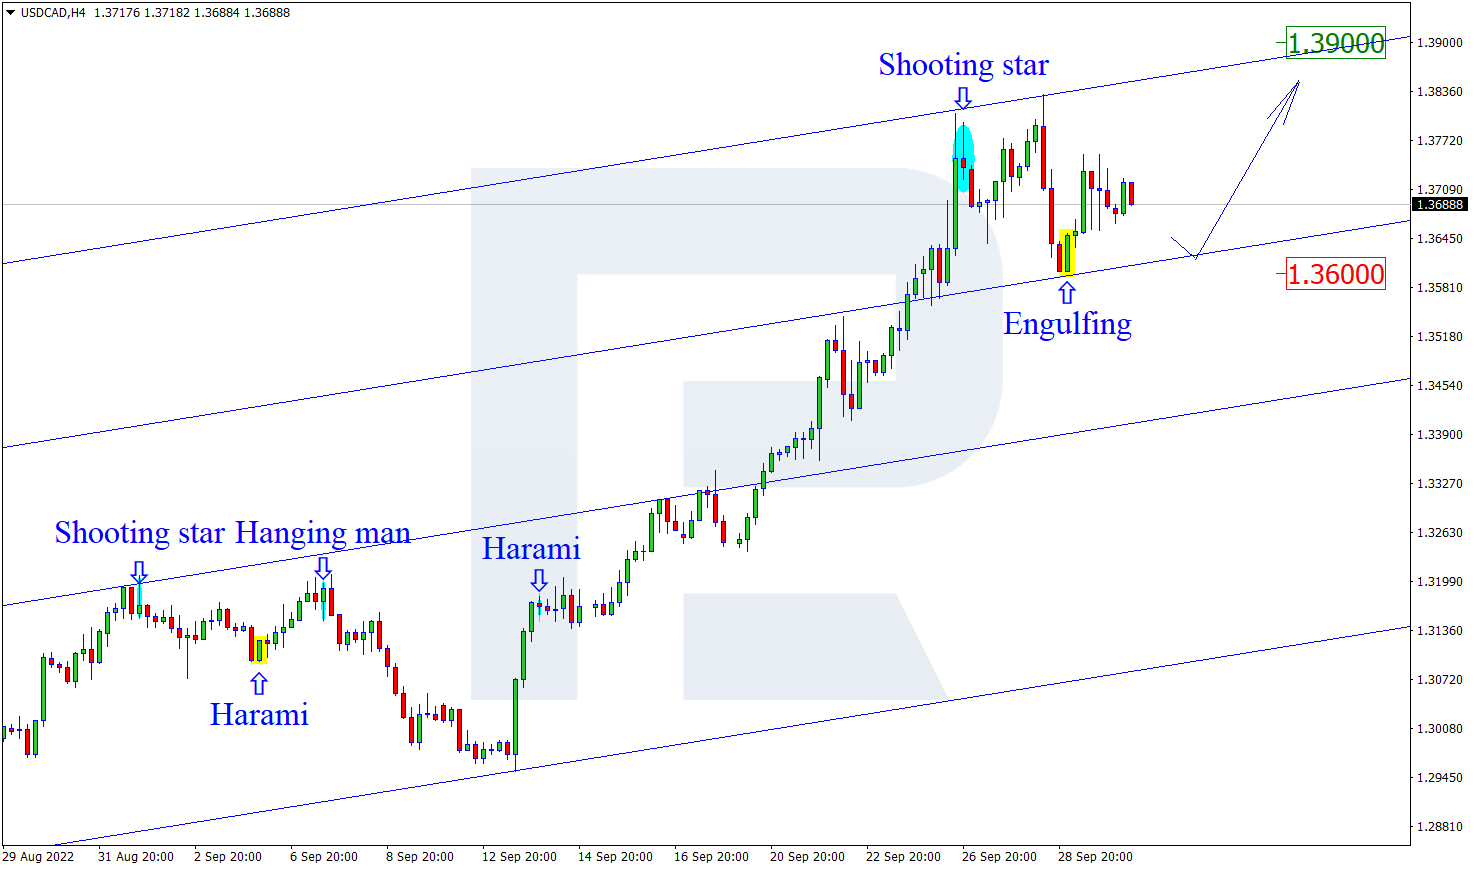
USDCAD, “US Dollar vs Canadian Dollar”
As we can see in the H4 chart, after forming an Engulfing reversal pattern close to the support level, USDCAD is reversing in the form of a new ascending wave. In this case, the upside target may be at 1.3900. Later, the market may break the resistance area and continue growing. However, an alternative scenario implies that the asset may correct to reach 1.3600 first and then resume the uptrend.

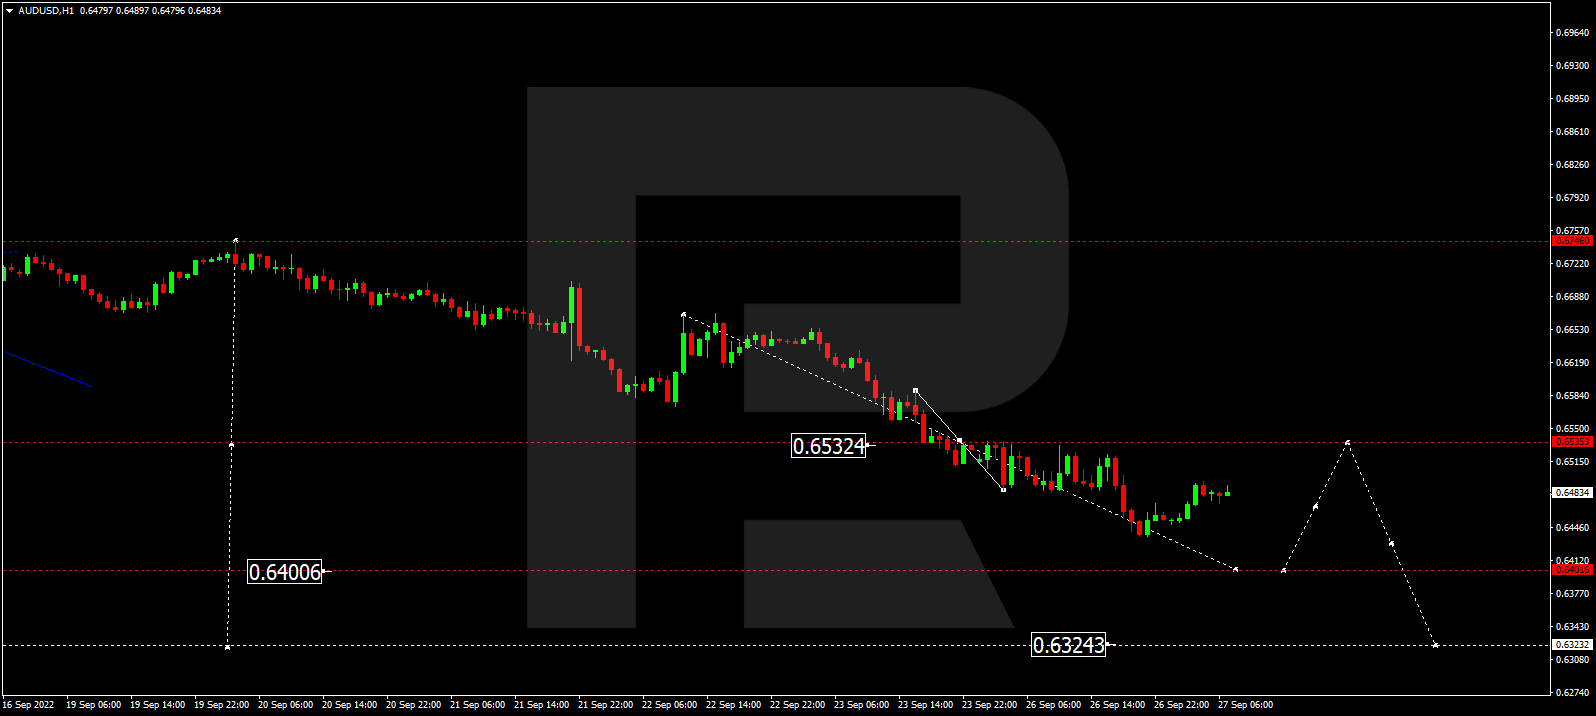
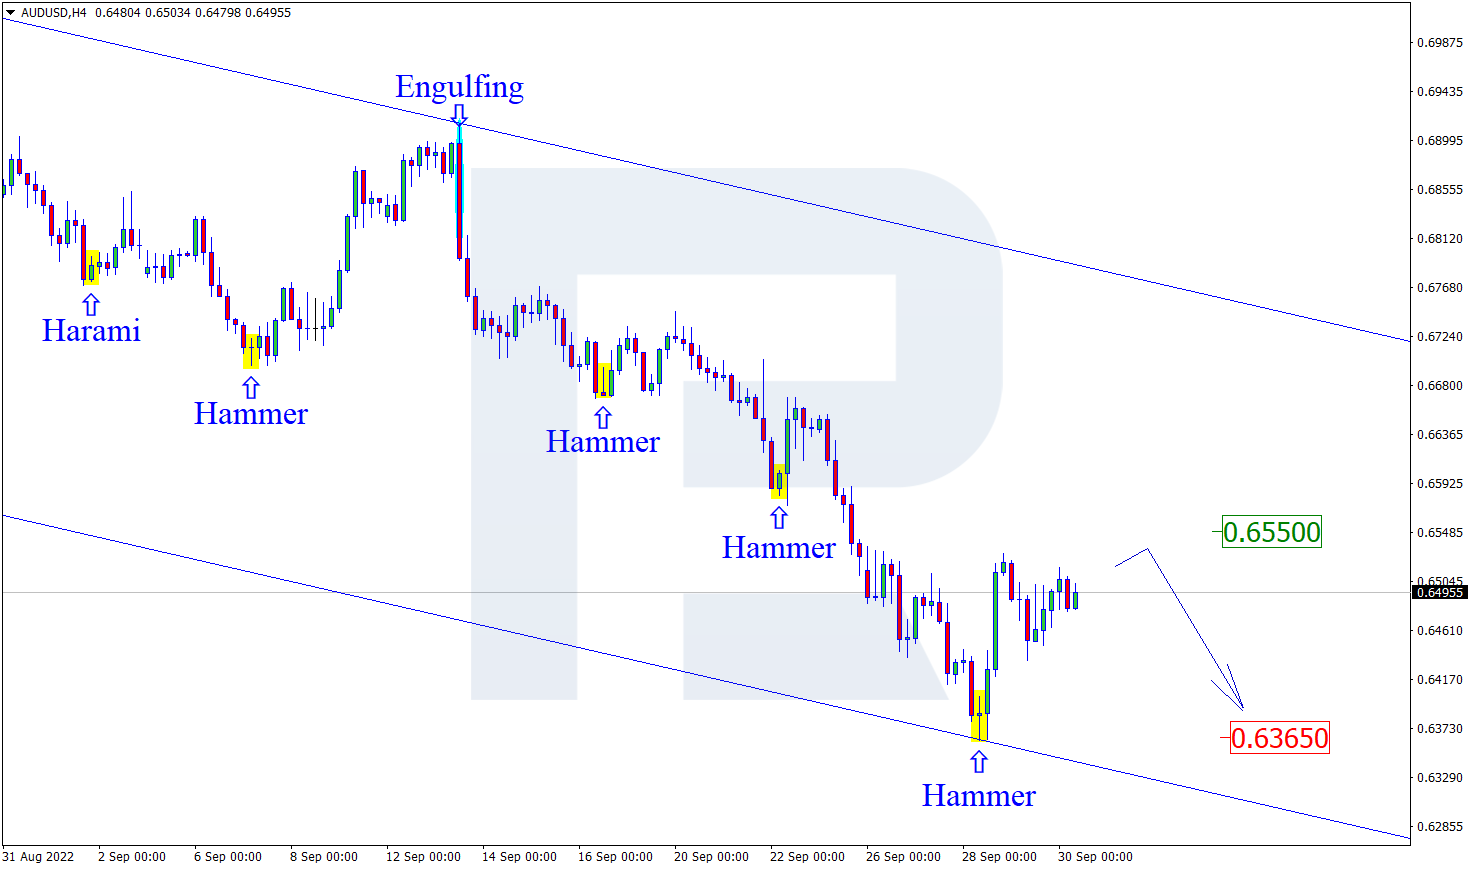
AUDUSD, “Australian Dollar vs US Dollar”
As we can see in the H4 chart, AUDUSD has formed a Hammer reversal pattern near the support area. At the moment, the asset is reversing in the form of a new correctional impulse. In this case, the upside correctional target may be the resistance level at 0.6550. After testing the level, the price may rebound from it and resume the descending tendency. At the same time, the opposite scenario implies that the price may fall to reach 0.6365 and continue the downtrend without any pullbacks up to resistance level.
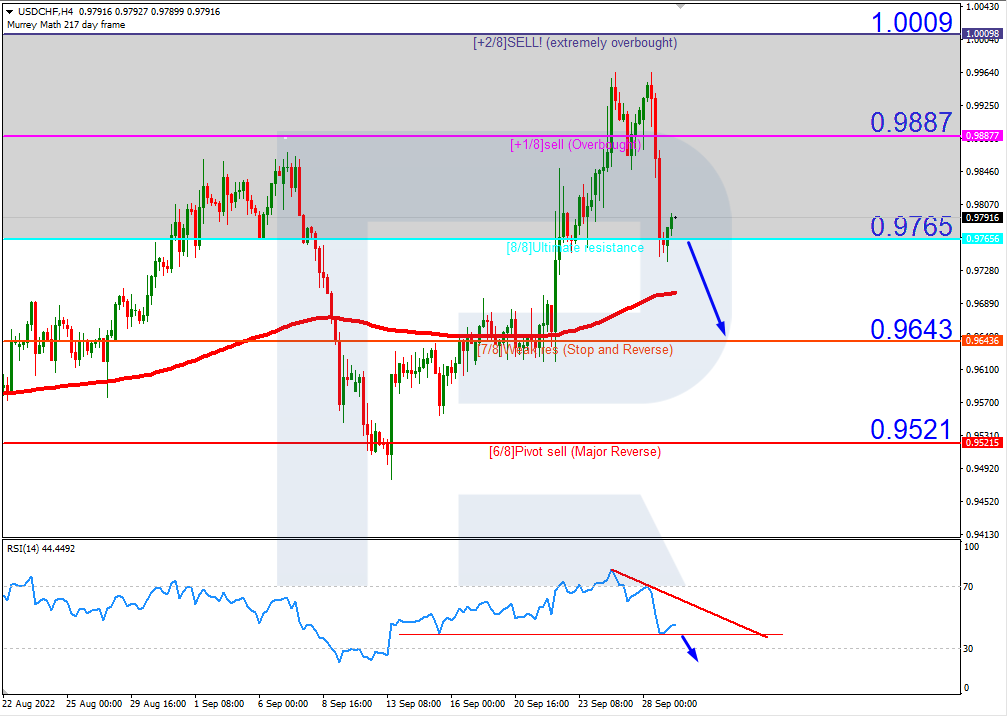
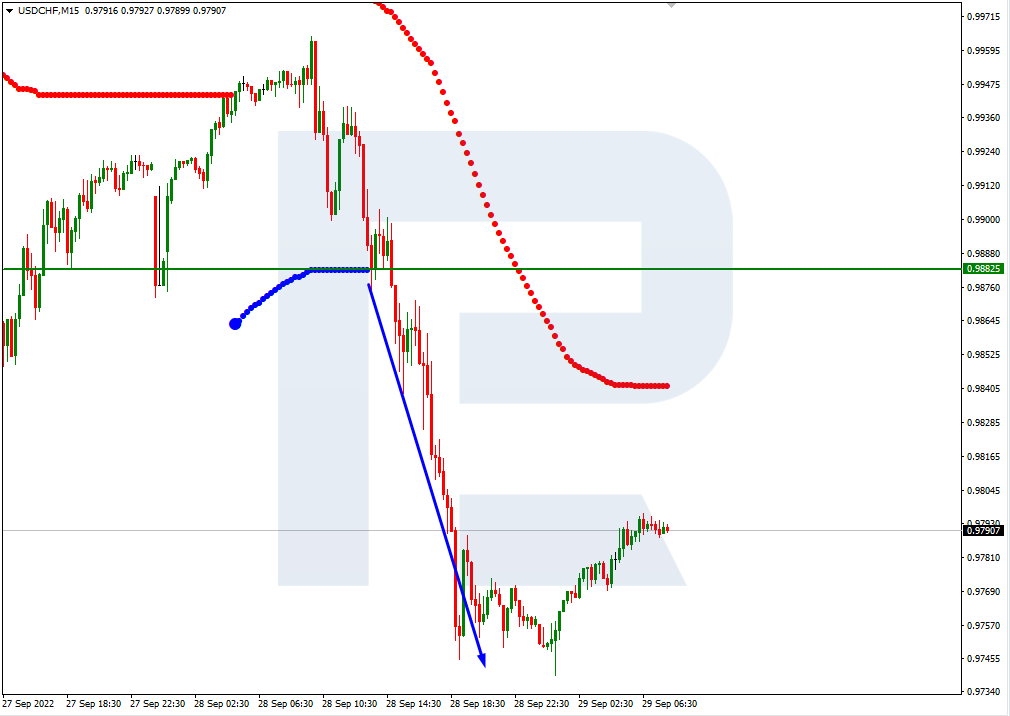
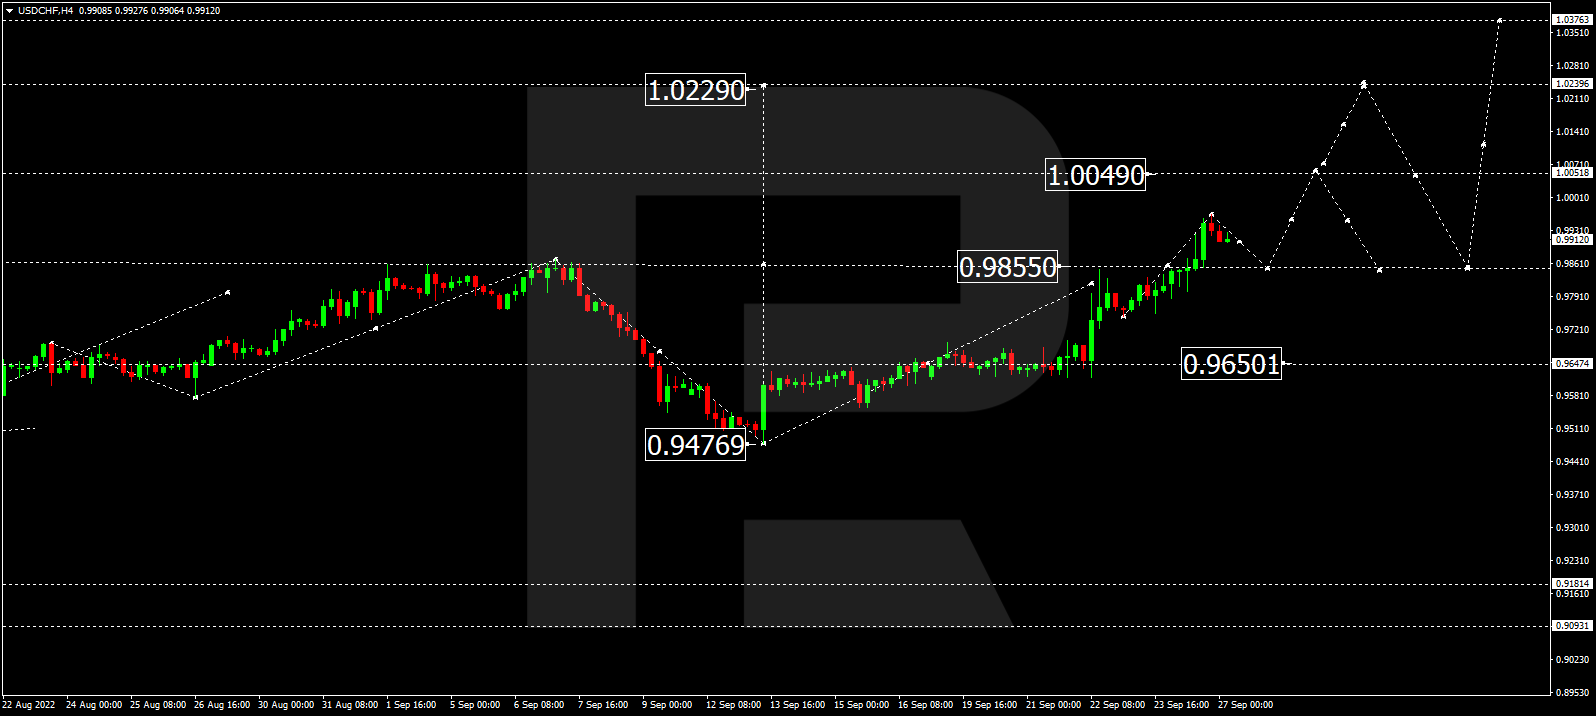
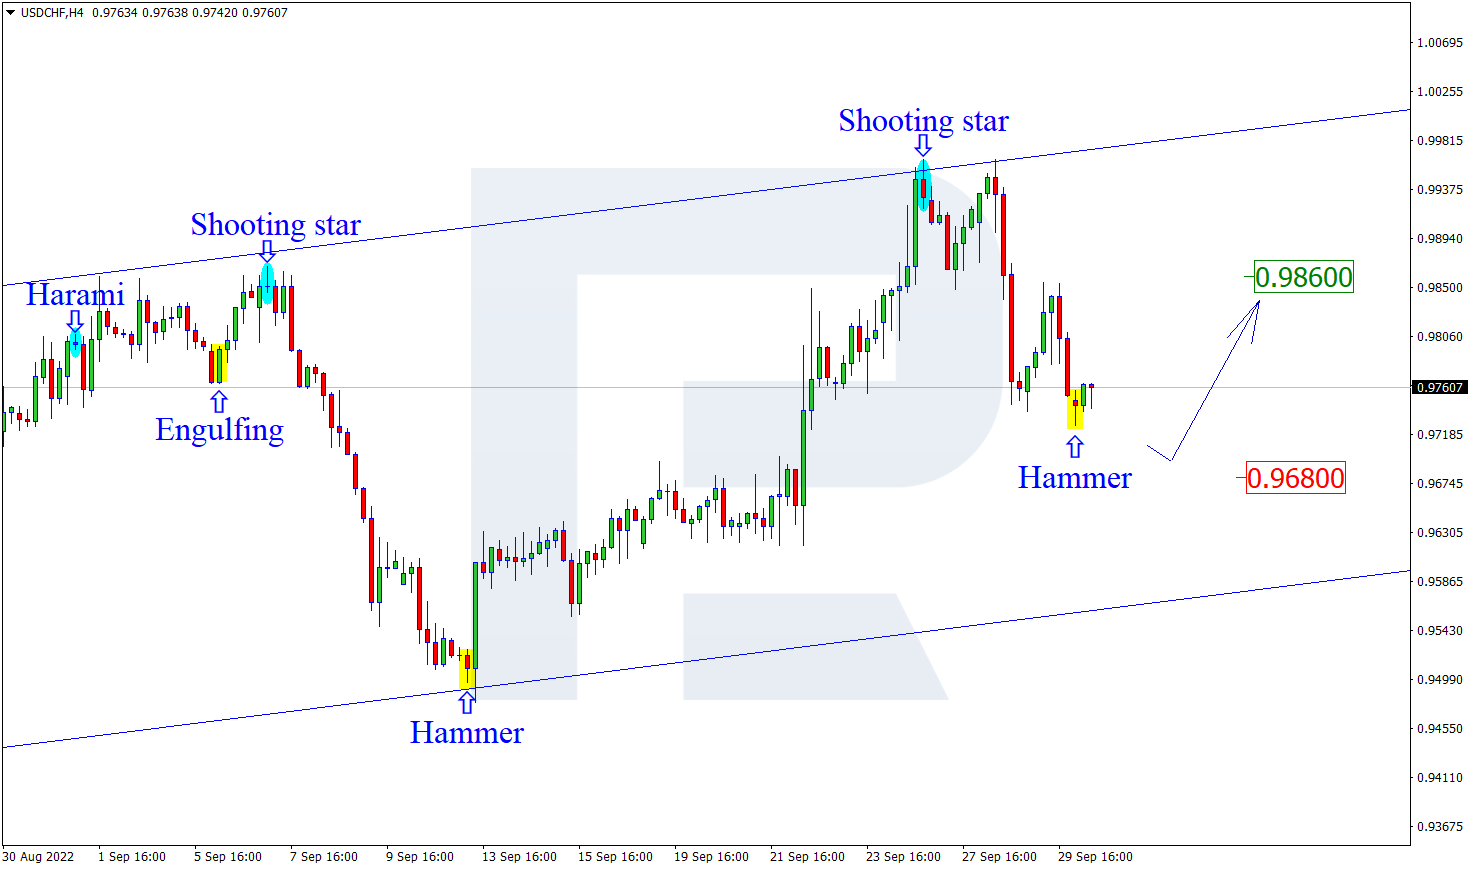
USDCHF, “US Dollar vs Swiss Franc”
As we can see in the H4 chart, the pair has formed a Hammer reversal pattern not far from the support area. At the moment, USDCHF may reverse in the form of a new ascending wave. In this case, the upside target may be the resistance level at 0.9860. After testing this level, the price may break it and continue trading upwards. Still, there might be an alternative scenario, in which the asset may correct to reach 0.9680 first and then resume the ascending tendency.
Article By RoboForex.com
Attention!
Forecasts presented in this section only reflect the author’s private opinion and should not be considered as guidance for trading. RoboForex LP bears no responsibility for trading results based on trading recommendations described in these analytical reviews.