By InvestMacro
Here are the latest charts and statistics for the Commitment of Traders (COT) data published by the Commodities Futures Trading Commission (CFTC).
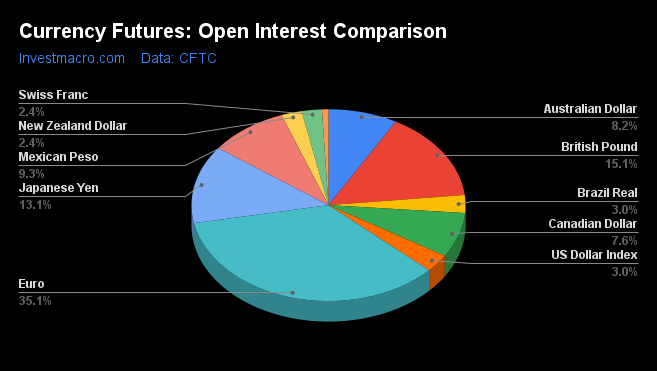
The latest COT data is updated through Tuesday September 27th and shows a quick view of how large market participants (for-profit speculators and commercial traders) were positioned in the futures markets. All currency positions are in direct relation to the US dollar where, for example, a bet for the euro is a bet that the euro will rise versus the dollar while a bet against the euro will be a bet that the euro will decline versus the dollar.
Weekly Speculator Changes led by British pound sterling & Australian dollar
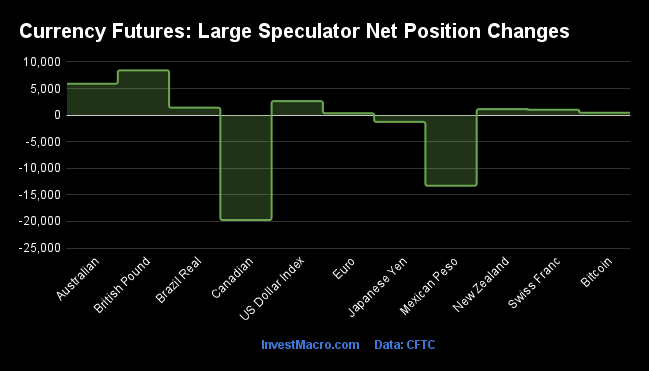
The COT currency market speculator bets were mostly higher this week as eight out of the eleven currency markets we cover had higher positioning while the other three markets had lower speculator contracts.
Leading the gains for the currency markets was the British pound sterling (8,419 contracts) and the Australian dollar (5,903 contracts) with the US Dollar Index (2,631 contracts), the Brazilian real (1,395 contracts), the New Zealand dollar (1,118 contracts), the Swiss franc (1,010 contracts), Bitcoin(447 contracts) and the Euro (348 contracts) also showing a positive week.
The currencies leading the declines in speculator bets this week were the Canadian dollar (-19,722 contracts) and the Mexican peso (-13,289 contracts) with the Japanese yen (-1,276 contracts) also registering lower bets on the week.
Speculators cut bearish bets in Sterling after record low, UK budget upends markets
Highlighting the COT Currencies data is the gains in speculator positions for the British pound sterling. The sterling speculator positioning this week (through Tuesday) rose by more than +8,000 net speculator contracts and follows last week’s rise by over +13,000 contracts. This has cut the overall bearish position by more than 21,000 contracts in two weeks. Previously, the speculative position had fallen for three straight weeks and dropped to the lowest speculator standing in fourteen weeks. The speculator positioning has now been in a bearish level for 32 consecutive weeks, dating back to February 15th.
This was an interesting week for the sterling and the United Kingdom markets in general as a government announcement of a new budget (and tax cut) created havoc and volatility across markets. The news sent UK bonds into a tailspin and created financial ripple effects in stocks, mortgages and pension funds. The sterling also nose-dived sharply and slipped all the way to a new record low versus the US dollar at approximately the 1.0362 exchange rate on Monday. An emergency Bank of England bond-buying program soothed the markets and helped sterling bounce from the lows of Monday to finish the week higher by over 2.50 percent.
Overall in the big picture, the current sterling speculative positioning (at -46,424 contracts) is, like the Euro, relatively tame considering where the currency price resides (near record lows). The 2022 weekly average position for GBP is -44,153 contracts which shows that traders are not extremely bearish despite the exchange rate level. The next few weeks will give the markets important insights into whether the Bank of England has managed to stem the slide in sterling or if, like the Bank of Japan’s recent record yen intervention, the GBP retests its multi-decade lows against the dollar.
| Sep-27-2022 | OI | OI-Index | Spec-Net | Spec-Index | Com-Net | COM-Index | Smalls-Net | Smalls-Index |
|---|
| USD Index | 56,046 | 80 | 30,562 | 76 | -32,482 | 24 | 1,920 | 38 |
| EUR | 654,142 | 61 | 33,797 | 45 | -58,440 | 59 | 24,643 | 15 |
| GBP | 281,805 | 87 | -46,424 | 29 | 65,217 | 78 | -18,793 | 8 |
| JPY | 244,655 | 77 | -82,556 | 18 | 100,633 | 85 | -18,077 | 17 |
| CHF | 44,492 | 30 | -5,730 | 42 | 16,898 | 70 | -11,168 | 20 |
| CAD | 140,889 | 24 | -17,666 | 20 | 21,707 | 87 | -4,041 | 22 |
| AUD | 152,301 | 46 | -34,653 | 53 | 47,998 | 55 | -13,345 | 20 |
| NZD | 45,240 | 34 | -11,471 | 50 | 15,072 | 55 | -3,601 | 10 |
| MXN | 173,045 | 37 | -41,322 | 10 | 37,998 | 89 | 3,324 | 57 |
| RUB | 20,930 | 4 | 7,543 | 31 | -7,150 | 69 | -393 | 24 |
| BRL | 55,930 | 48 | 33,764 | 84 | -35,031 | 17 | 1,267 | 80 |
| Bitcoin | 14,271 | 82 | 1,024 | 95 | -1,221 | 0 | 197 | 17 |
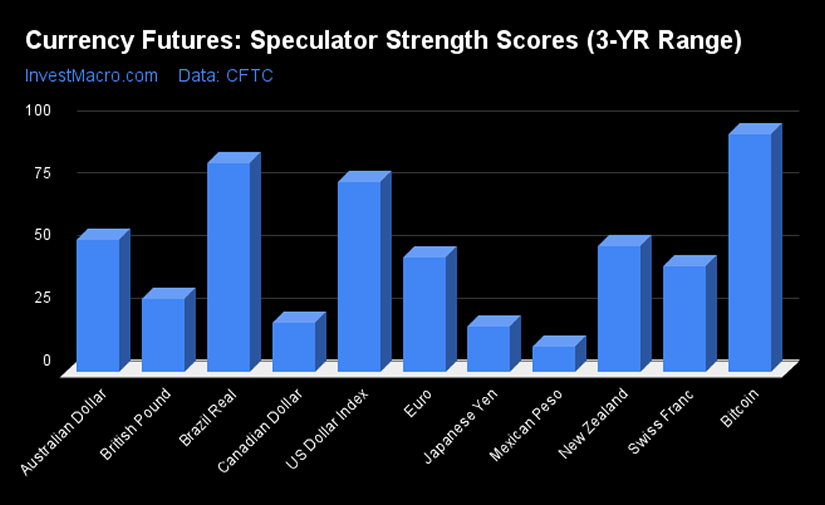
Strength Scores
Strength Scores (a normalized measure of Speculator positions over a 3-Year range, from 0 to 100 where above 80 is extreme bullish and below 20 is extreme bearish) show that Bitcoin (94.8 percent) and the Brazilian Real (83.6 percent) lead the currency markets at the top of their respective ranges and are both in bullish extreme positions. The US Dollar Index (75.9 percent) comes in as the next highest in the currency markets in strength scores.
On the downside, the Mexican Peso (9.7 percent) comes in at the lowest strength level currently and is followed by the Japanese Yen (18.0 percent) and the Canadian Dollar (19.5 percent).

Strength Statistics:
US Dollar Index (75.9 percent) vs US Dollar Index previous week (71.5 percent)
EuroFX (45.4 percent) vs EuroFX previous week (45.3 percent)
British Pound Sterling (29.2 percent) vs British Pound Sterling previous week (21.9 percent)
Japanese Yen (18.0 percent) vs Japanese Yen previous week (18.8 percent)
Swiss Franc (42.0 percent) vs Swiss Franc previous week (39.4 percent)
Canadian Dollar (19.5 percent) vs Canadian Dollar previous week (41.7 percent)
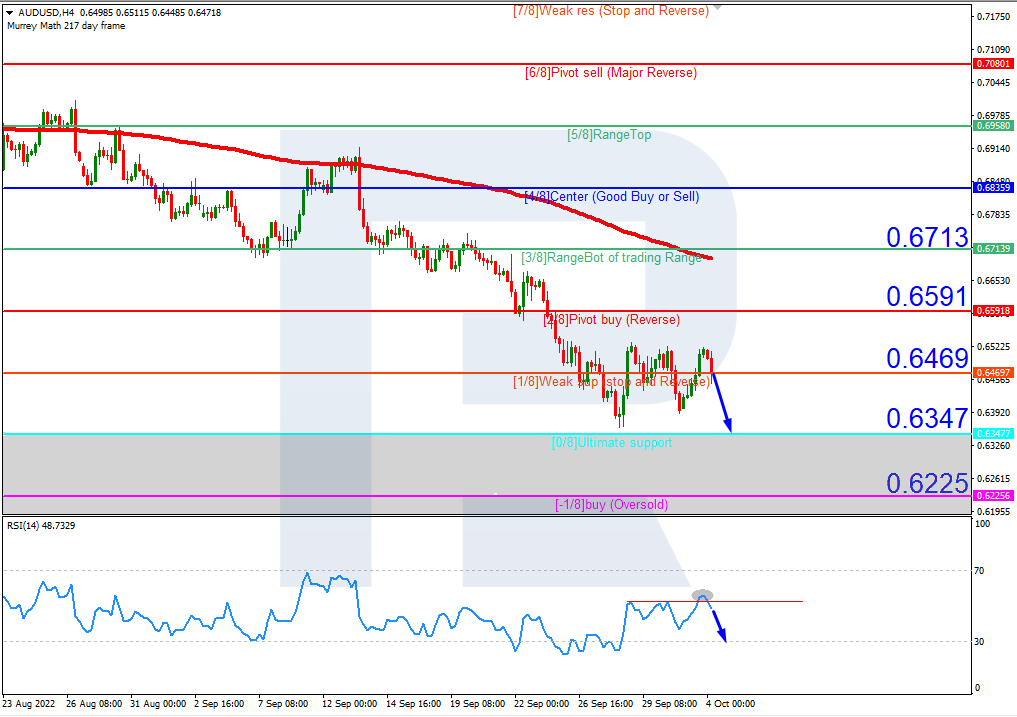
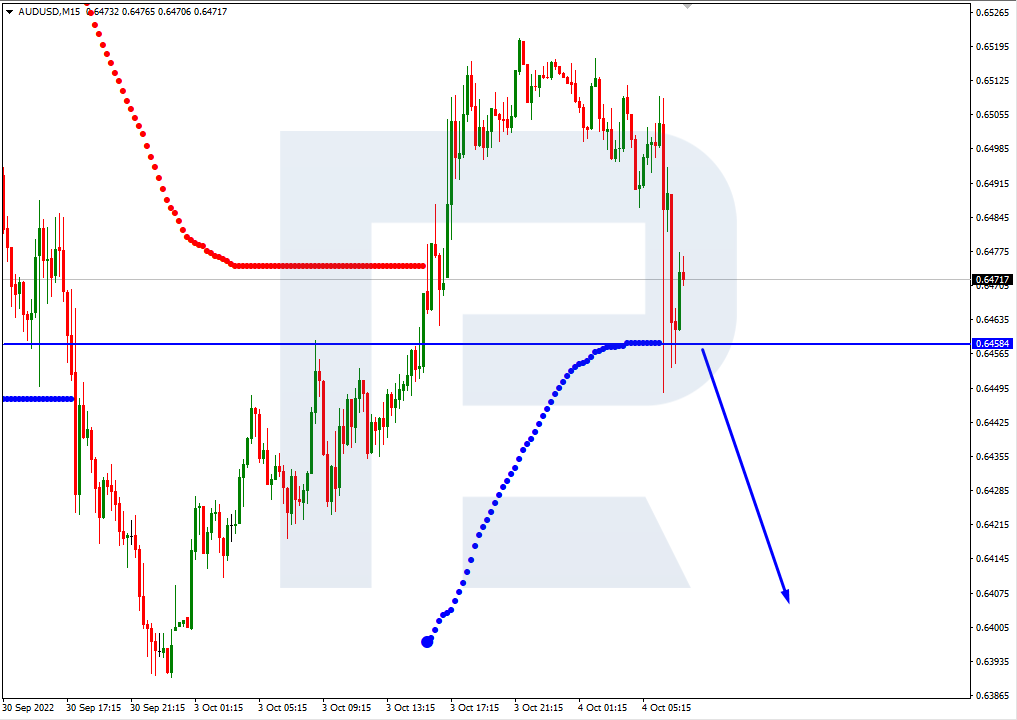
Australian Dollar (52.7 percent) vs Australian Dollar previous week (47.2 percent)
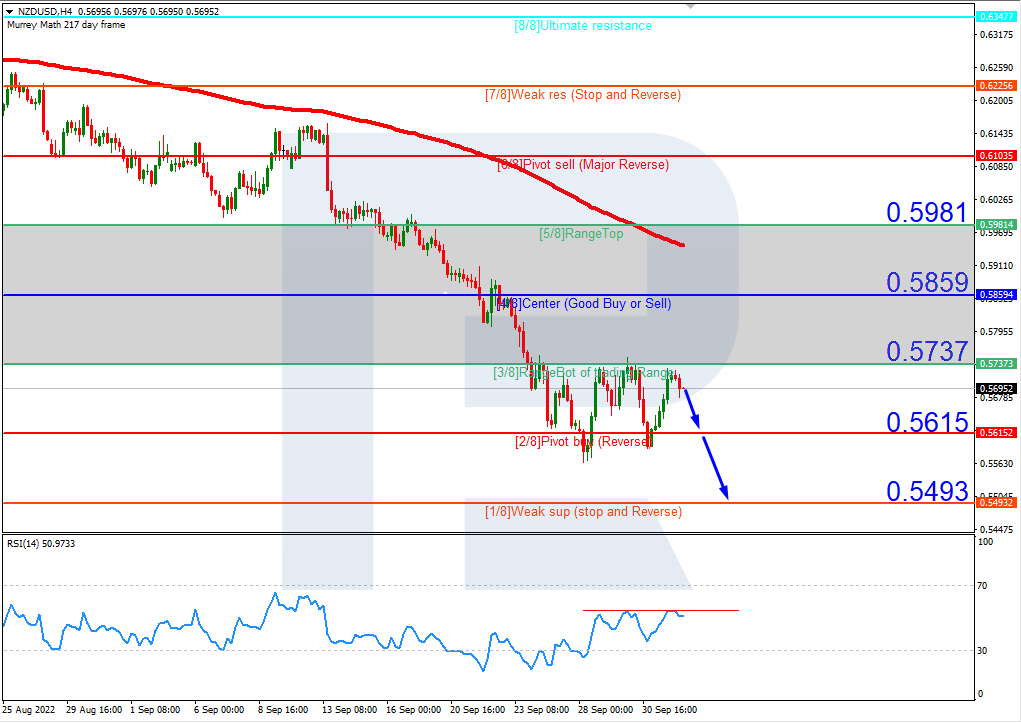
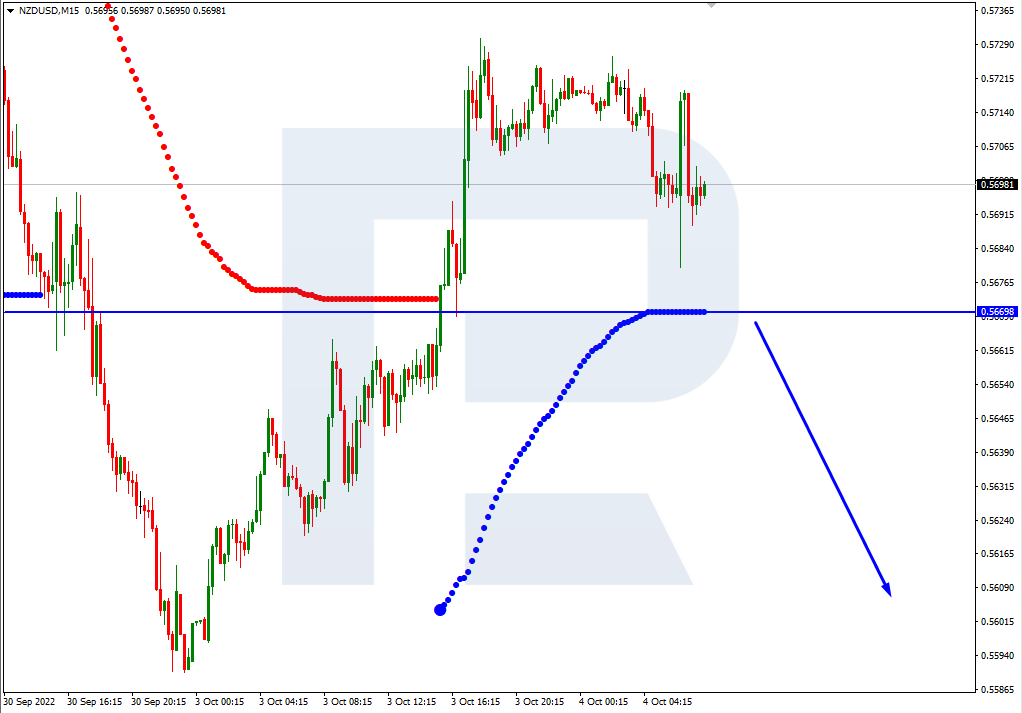
New Zealand Dollar (50.3 percent) vs New Zealand Dollar previous week (48.3 percent)
Mexican Peso (9.7 percent) vs Mexican Peso previous week (15.4 percent)
Brazilian Real (83.6 percent) vs Brazilian Real previous week (82.2 percent)
Bitcoin (94.8 percent) vs Bitcoin previous week (87.0 percent)
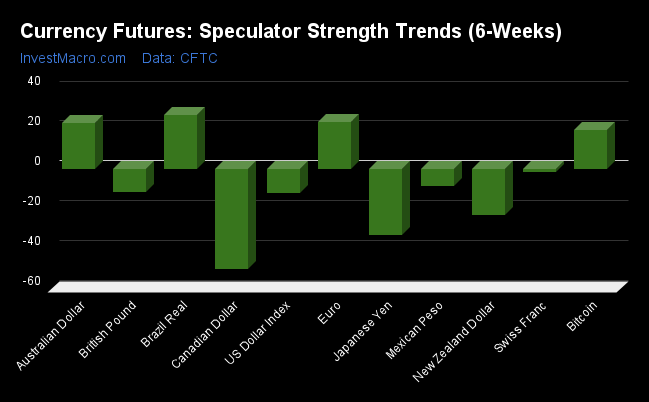
Strength Trends
Strength Score Trends (or move index, calculates the 6-week changes in strength scores) show that the Brazilian Real (26.8 percent) leads the past six weeks trends for the currency markets this week. The EuroFX (23.5 percent), the Australian Dollar (22.8 percent) and Bitcoin (19.5 percent) fill out the top movers in the latest trends data.
The Canadian Dollar (-50.0 percent) leads the downside trend scores currently while the next market with lower trend scores were the Japanese Yen (-33.1 percent) followed by the New Zealand Dollar (-23.0 percent).
Strength Trend Statistics:
US Dollar Index (-12.3 percent) vs US Dollar Index previous week (-17.9 percent)
EuroFX (23.5 percent) vs EuroFX previous week (20.9 percent)
British Pound Sterling (-11.4 percent) vs British Pound Sterling previous week (-17.5 percent)
Japanese Yen (-33.1 percent) vs Japanese Yen previous week (-34.6 percent)
Swiss Franc (-1.6 percent) vs Swiss Franc previous week (7.7 percent)
Canadian Dollar (-50.0 percent) vs Canadian Dollar previous week (-21.5 percent)
Australian Dollar (22.8 percent) vs Australian Dollar previous week (15.8 percent)
New Zealand Dollar (-23.0 percent) vs New Zealand Dollar previous week (-21.4 percent)
Mexican Peso (-8.5 percent) vs Mexican Peso previous week (-0.2 percent)
Brazilian Real (26.8 percent) vs Brazilian Real previous week (30.1 percent)
Bitcoin (19.5 percent) vs Bitcoin previous week (14.1 percent)
Individual COT Forex Markets:
US Dollar Index Futures:
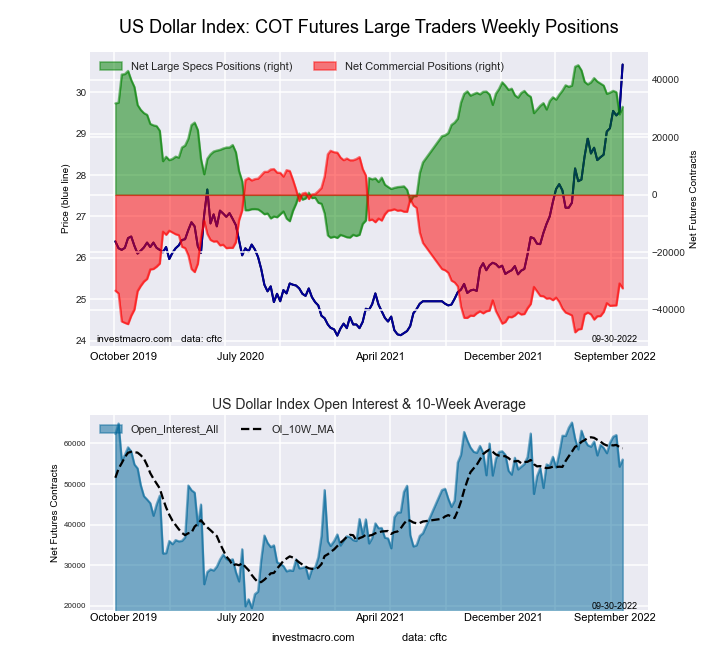 The US Dollar Index large speculator standing this week equaled a net position of 30,562 contracts in the data reported through Tuesday. This was a weekly boost of 2,631 contracts from the previous week which had a total of 27,931 net contracts.
This week’s current strength score (the trader positioning range over the past three years, measured from 0 to 100) shows the speculators are currently Bullish with a score of 75.9 percent. The commercials are Bearish with a score of 24.2 percent and the small traders (not shown in chart) are Bearish with a score of 37.5 percent.
| US DOLLAR INDEX Statistics | SPECULATORS | COMMERCIALS | SMALL TRADERS |
| – Percent of Open Interest Longs: | 84.6 | 3.8 | 9.8 |
| – Percent of Open Interest Shorts: | 30.1 | 61.8 | 6.4 |
| – Net Position: | 30,562 | -32,482 | 1,920 |
| – Gross Longs: | 47,424 | 2,153 | 5,481 |
| – Gross Shorts: | 16,862 | 34,635 | 3,561 |
| – Long to Short Ratio: | 2.8 to 1 | 0.1 to 1 | 1.5 to 1 |
| NET POSITION TREND: | | | |
| – Strength Index Score (3 Year Range Pct): | 75.9 | 24.2 | 37.5 |
| – Strength Index Reading (3 Year Range): | Bullish | Bearish | Bearish |
| NET POSITION MOVEMENT INDEX: | | | |
| – 6-Week Change in Strength Index: | -12.3 | 13.0 | -8.7 |
Euro Currency Futures:
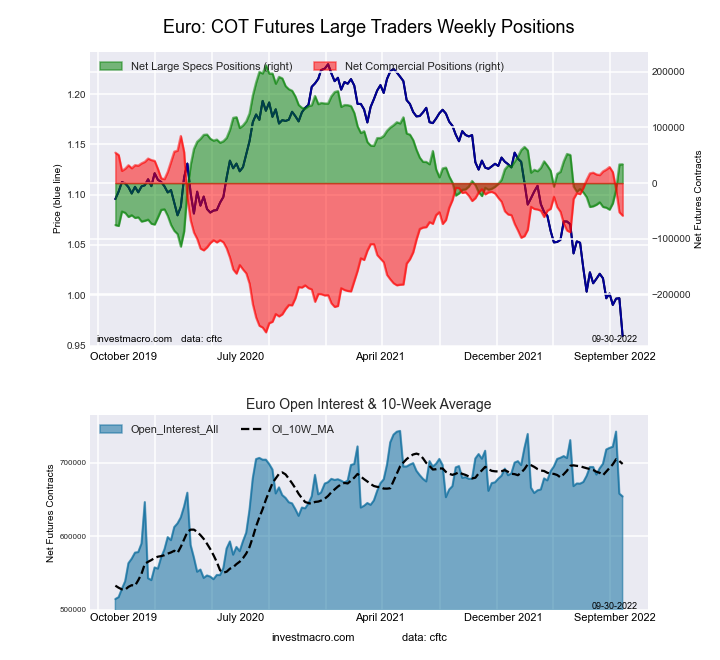 The Euro Currency large speculator standing this week equaled a net position of 33,797 contracts in the data reported through Tuesday. This was a weekly gain of 348 contracts from the previous week which had a total of 33,449 net contracts.
This week’s current strength score (the trader positioning range over the past three years, measured from 0 to 100) shows the speculators are currently Bearish with a score of 45.4 percent. The commercials are Bullish with a score of 59.4 percent and the small traders (not shown in chart) are Bearish-Extreme with a score of 15.2 percent.
| EURO Currency Statistics | SPECULATORS | COMMERCIALS | SMALL TRADERS |
| – Percent of Open Interest Longs: | 31.9 | 53.3 | 12.0 |
| – Percent of Open Interest Shorts: | 26.7 | 62.2 | 8.2 |
| – Net Position: | 33,797 | -58,440 | 24,643 |
| – Gross Longs: | 208,736 | 348,374 | 78,547 |
| – Gross Shorts: | 174,939 | 406,814 | 53,904 |
| – Long to Short Ratio: | 1.2 to 1 | 0.9 to 1 | 1.5 to 1 |
| NET POSITION TREND: | | | |
| – Strength Index Score (3 Year Range Pct): | 45.4 | 59.4 | 15.2 |
| – Strength Index Reading (3 Year Range): | Bearish | Bullish | Bearish-Extreme |
| NET POSITION MOVEMENT INDEX: | | | |
| – 6-Week Change in Strength Index: | 23.5 | -22.5 | 4.6 |
British Pound Sterling Futures:
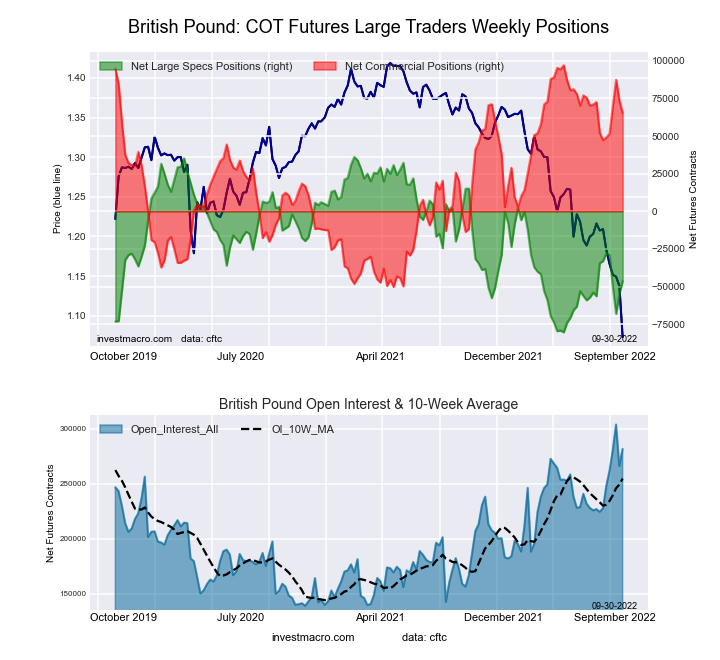 The British Pound Sterling large speculator standing this week equaled a net position of -46,424 contracts in the data reported through Tuesday. This was a weekly rise of 8,419 contracts from the previous week which had a total of -54,843 net contracts.
This week’s current strength score (the trader positioning range over the past three years, measured from 0 to 100) shows the speculators are currently Bearish with a score of 29.2 percent. The commercials are Bullish with a score of 78.4 percent and the small traders (not shown in chart) are Bearish-Extreme with a score of 8.1 percent.
| BRITISH POUND Statistics | SPECULATORS | COMMERCIALS | SMALL TRADERS |
| – Percent of Open Interest Longs: | 21.2 | 69.3 | 7.6 |
| – Percent of Open Interest Shorts: | 37.7 | 46.1 | 14.2 |
| – Net Position: | -46,424 | 65,217 | -18,793 |
| – Gross Longs: | 59,831 | 195,244 | 21,327 |
| – Gross Shorts: | 106,255 | 130,027 | 40,120 |
| – Long to Short Ratio: | 0.6 to 1 | 1.5 to 1 | 0.5 to 1 |
| NET POSITION TREND: | | | |
| – Strength Index Score (3 Year Range Pct): | 29.2 | 78.4 | 8.1 |
| – Strength Index Reading (3 Year Range): | Bearish | Bullish | Bearish-Extreme |
| NET POSITION MOVEMENT INDEX: | | | |
| – 6-Week Change in Strength Index: | -11.4 | 12.2 | -10.7 |
Japanese Yen Futures:
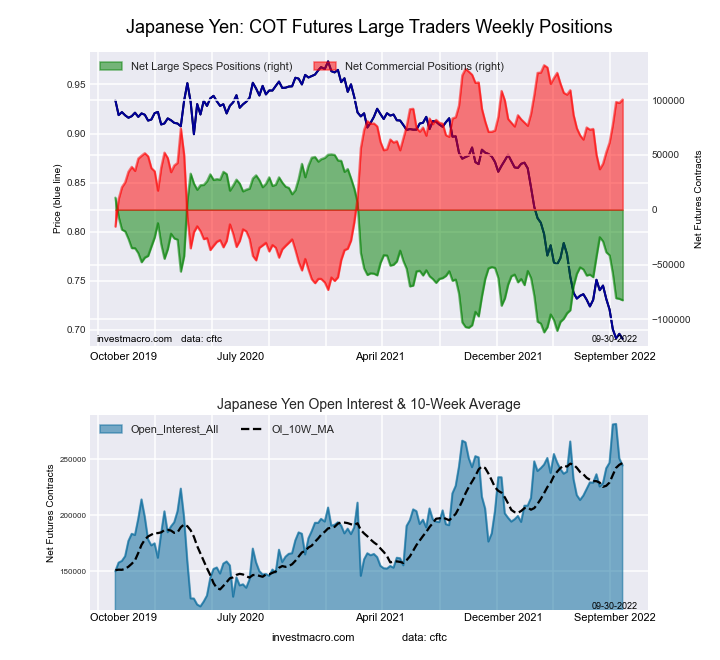 The Japanese Yen large speculator standing this week equaled a net position of -82,556 contracts in the data reported through Tuesday. This was a weekly lowering of -1,276 contracts from the previous week which had a total of -81,280 net contracts.
This week’s current strength score (the trader positioning range over the past three years, measured from 0 to 100) shows the speculators are currently Bearish-Extreme with a score of 18.0 percent. The commercials are Bullish-Extreme with a score of 84.7 percent and the small traders (not shown in chart) are Bearish-Extreme with a score of 16.7 percent.
| JAPANESE YEN Statistics | SPECULATORS | COMMERCIALS | SMALL TRADERS |
| – Percent of Open Interest Longs: | 9.3 | 80.1 | 8.8 |
| – Percent of Open Interest Shorts: | 43.0 | 39.0 | 16.2 |
| – Net Position: | -82,556 | 100,633 | -18,077 |
| – Gross Longs: | 22,706 | 195,930 | 21,476 |
| – Gross Shorts: | 105,262 | 95,297 | 39,553 |
| – Long to Short Ratio: | 0.2 to 1 | 2.1 to 1 | 0.5 to 1 |
| NET POSITION TREND: | | | |
| – Strength Index Score (3 Year Range Pct): | 18.0 | 84.7 | 16.7 |
| – Strength Index Reading (3 Year Range): | Bearish-Extreme | Bullish-Extreme | Bearish-Extreme |
| NET POSITION MOVEMENT INDEX: | | | |
| – 6-Week Change in Strength Index: | -33.1 | 28.6 | -10.1 |
Swiss Franc Futures:
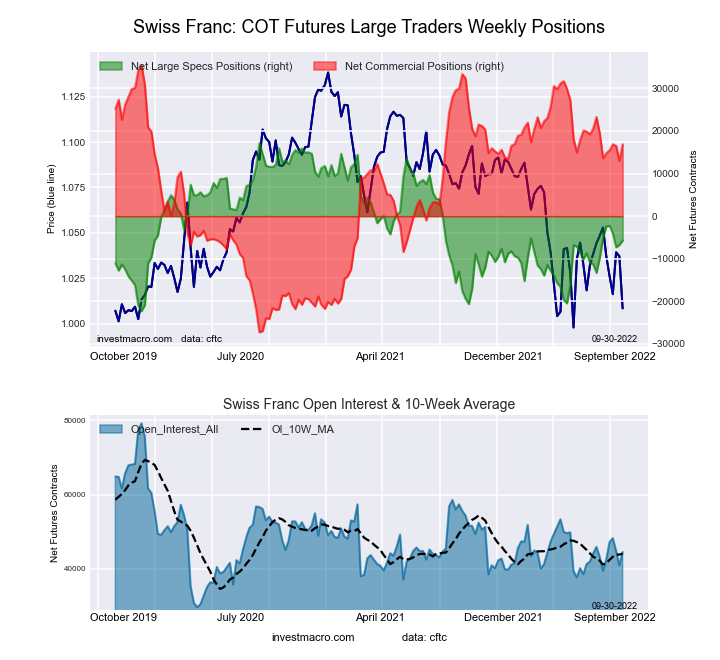 The Swiss Franc large speculator standing this week equaled a net position of -5,730 contracts in the data reported through Tuesday. This was a weekly boost of 1,010 contracts from the previous week which had a total of -6,740 net contracts.
This week’s current strength score (the trader positioning range over the past three years, measured from 0 to 100) shows the speculators are currently Bearish with a score of 42.0 percent. The commercials are Bullish with a score of 70.4 percent and the small traders (not shown in chart) are Bearish-Extreme with a score of 19.7 percent.
| SWISS FRANC Statistics | SPECULATORS | COMMERCIALS | SMALL TRADERS |
| – Percent of Open Interest Longs: | 17.3 | 63.4 | 19.1 |
| – Percent of Open Interest Shorts: | 30.1 | 25.4 | 44.2 |
| – Net Position: | -5,730 | 16,898 | -11,168 |
| – Gross Longs: | 7,681 | 28,196 | 8,500 |
| – Gross Shorts: | 13,411 | 11,298 | 19,668 |
| – Long to Short Ratio: | 0.6 to 1 | 2.5 to 1 | 0.4 to 1 |
| NET POSITION TREND: | | | |
| – Strength Index Score (3 Year Range Pct): | 42.0 | 70.4 | 19.7 |
| – Strength Index Reading (3 Year Range): | Bearish | Bullish | Bearish-Extreme |
| NET POSITION MOVEMENT INDEX: | | | |
| – 6-Week Change in Strength Index: | -1.6 | 5.2 | -9.0 |
Canadian Dollar Futures:
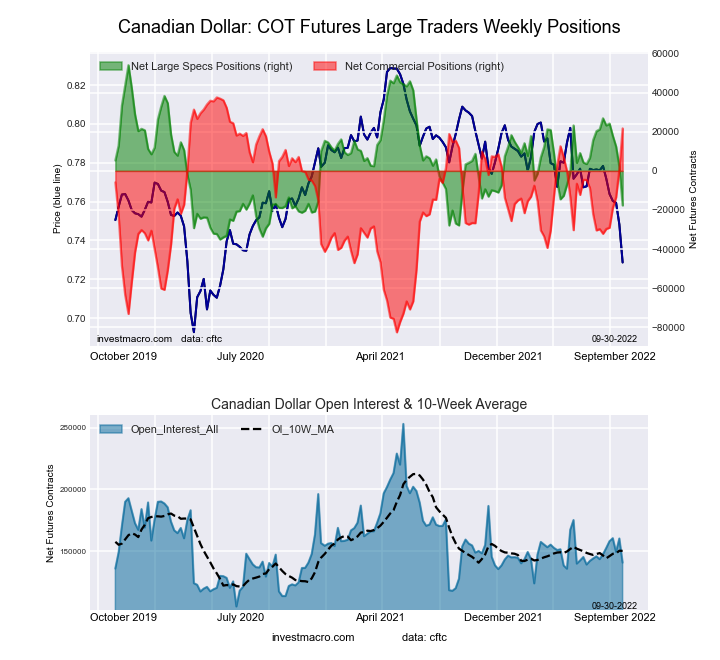 The Canadian Dollar large speculator standing this week equaled a net position of -17,666 contracts in the data reported through Tuesday. This was a weekly decline of -19,722 contracts from the previous week which had a total of 2,056 net contracts.
This week’s current strength score (the trader positioning range over the past three years, measured from 0 to 100) shows the speculators are currently Bearish-Extreme with a score of 19.5 percent. The commercials are Bullish-Extreme with a score of 86.8 percent and the small traders (not shown in chart) are Bearish with a score of 22.0 percent.
| CANADIAN DOLLAR Statistics | SPECULATORS | COMMERCIALS | SMALL TRADERS |
| – Percent of Open Interest Longs: | 23.9 | 53.4 | 21.3 |
| – Percent of Open Interest Shorts: | 36.4 | 38.0 | 24.1 |
| – Net Position: | -17,666 | 21,707 | -4,041 |
| – Gross Longs: | 33,677 | 75,267 | 29,978 |
| – Gross Shorts: | 51,343 | 53,560 | 34,019 |
| – Long to Short Ratio: | 0.7 to 1 | 1.4 to 1 | 0.9 to 1 |
| NET POSITION TREND: | | | |
| – Strength Index Score (3 Year Range Pct): | 19.5 | 86.8 | 22.0 |
| – Strength Index Reading (3 Year Range): | Bearish-Extreme | Bullish-Extreme | Bearish |
| NET POSITION MOVEMENT INDEX: | | | |
| – 6-Week Change in Strength Index: | -50.0 | 44.9 | -18.7 |
Australian Dollar Futures:
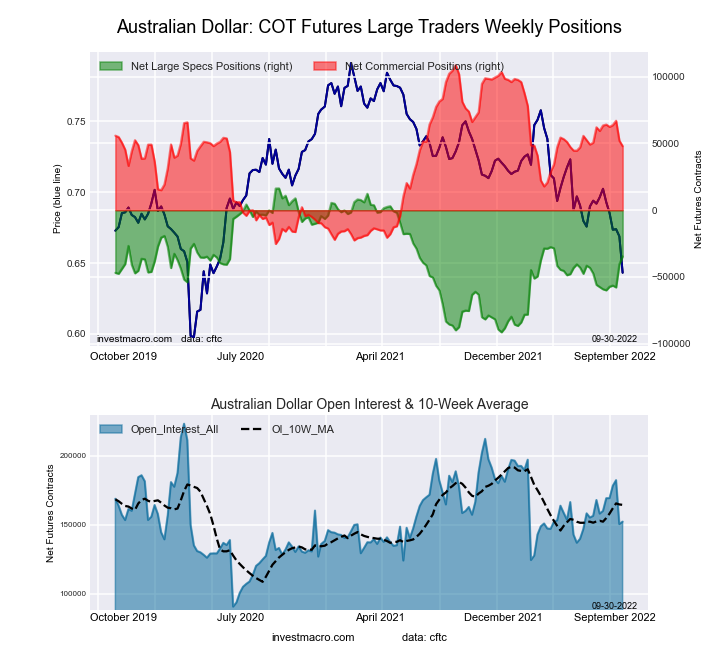 The Australian Dollar large speculator standing this week equaled a net position of -34,653 contracts in the data reported through Tuesday. This was a weekly gain of 5,903 contracts from the previous week which had a total of -40,556 net contracts.
This week’s current strength score (the trader positioning range over the past three years, measured from 0 to 100) shows the speculators are currently Bullish with a score of 52.7 percent. The commercials are Bullish with a score of 54.7 percent and the small traders (not shown in chart) are Bearish-Extreme with a score of 19.9 percent.
| AUSTRALIAN DOLLAR Statistics | SPECULATORS | COMMERCIALS | SMALL TRADERS |
| – Percent of Open Interest Longs: | 25.6 | 61.0 | 11.2 |
| – Percent of Open Interest Shorts: | 48.4 | 29.4 | 19.9 |
| – Net Position: | -34,653 | 47,998 | -13,345 |
| – Gross Longs: | 39,006 | 92,836 | 16,982 |
| – Gross Shorts: | 73,659 | 44,838 | 30,327 |
| – Long to Short Ratio: | 0.5 to 1 | 2.1 to 1 | 0.6 to 1 |
| NET POSITION TREND: | | | |
| – Strength Index Score (3 Year Range Pct): | 52.7 | 54.7 | 19.9 |
| – Strength Index Reading (3 Year Range): | Bullish | Bullish | Bearish-Extreme |
| NET POSITION MOVEMENT INDEX: | | | |
| – 6-Week Change in Strength Index: | 22.8 | -11.6 | -22.2 |
New Zealand Dollar Futures:
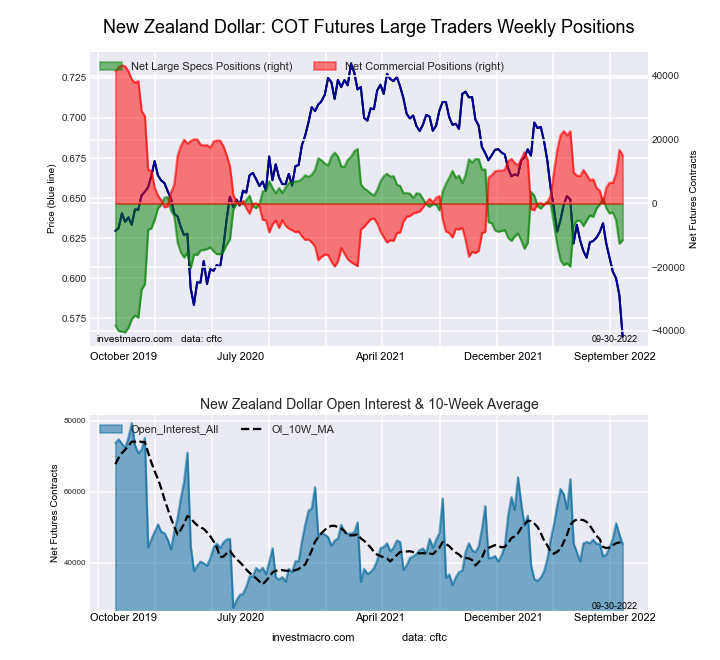 The New Zealand Dollar large speculator standing this week equaled a net position of -11,471 contracts in the data reported through Tuesday. This was a weekly boost of 1,118 contracts from the previous week which had a total of -12,589 net contracts.
This week’s current strength score (the trader positioning range over the past three years, measured from 0 to 100) shows the speculators are currently Bullish with a score of 50.3 percent. The commercials are Bullish with a score of 55.1 percent and the small traders (not shown in chart) are Bearish-Extreme with a score of 10.2 percent.
| NEW ZEALAND DOLLAR Statistics | SPECULATORS | COMMERCIALS | SMALL TRADERS |
| – Percent of Open Interest Longs: | 27.2 | 67.1 | 5.5 |
| – Percent of Open Interest Shorts: | 52.5 | 33.8 | 13.5 |
| – Net Position: | -11,471 | 15,072 | -3,601 |
| – Gross Longs: | 12,287 | 30,343 | 2,489 |
| – Gross Shorts: | 23,758 | 15,271 | 6,090 |
| – Long to Short Ratio: | 0.5 to 1 | 2.0 to 1 | 0.4 to 1 |
| NET POSITION TREND: | | | |
| – Strength Index Score (3 Year Range Pct): | 50.3 | 55.1 | 10.2 |
| – Strength Index Reading (3 Year Range): | Bullish | Bullish | Bearish-Extreme |
| NET POSITION MOVEMENT INDEX: | | | |
| – 6-Week Change in Strength Index: | -23.0 | 23.6 | -18.8 |
Mexican Peso Futures:
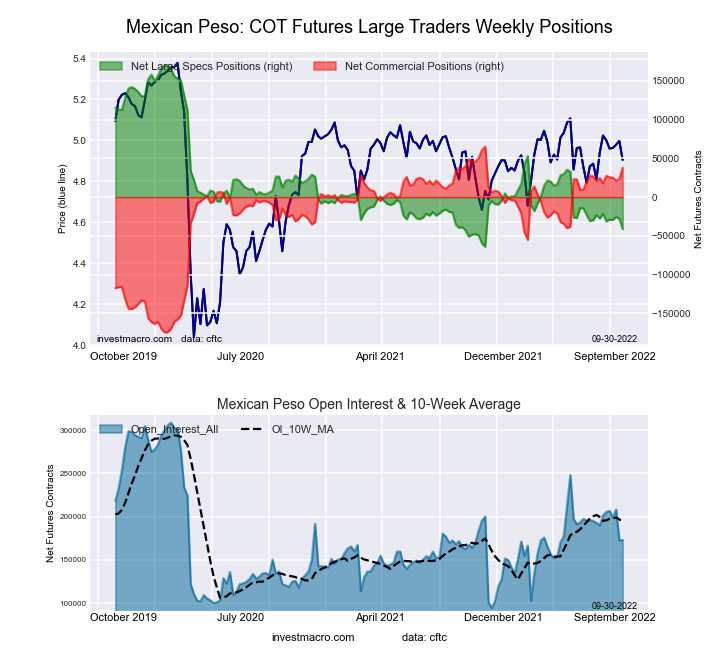 The Mexican Peso large speculator standing this week equaled a net position of -41,322 contracts in the data reported through Tuesday. This was a weekly decrease of -13,289 contracts from the previous week which had a total of -28,033 net contracts.
This week’s current strength score (the trader positioning range over the past three years, measured from 0 to 100) shows the speculators are currently Bearish-Extreme with a score of 9.7 percent. The commercials are Bullish-Extreme with a score of 88.6 percent and the small traders (not shown in chart) are Bullish with a score of 57.1 percent.
| MEXICAN PESO Statistics | SPECULATORS | COMMERCIALS | SMALL TRADERS |
| – Percent of Open Interest Longs: | 50.7 | 44.5 | 3.8 |
| – Percent of Open Interest Shorts: | 74.6 | 22.6 | 1.9 |
| – Net Position: | -41,322 | 37,998 | 3,324 |
| – Gross Longs: | 87,723 | 77,061 | 6,626 |
| – Gross Shorts: | 129,045 | 39,063 | 3,302 |
| – Long to Short Ratio: | 0.7 to 1 | 2.0 to 1 | 2.0 to 1 |
| NET POSITION TREND: | | | |
| – Strength Index Score (3 Year Range Pct): | 9.7 | 88.6 | 57.1 |
| – Strength Index Reading (3 Year Range): | Bearish-Extreme | Bullish-Extreme | Bullish |
| NET POSITION MOVEMENT INDEX: | | | |
| – 6-Week Change in Strength Index: | -8.5 | 8.4 | -1.0 |
Brazilian Real Futures:
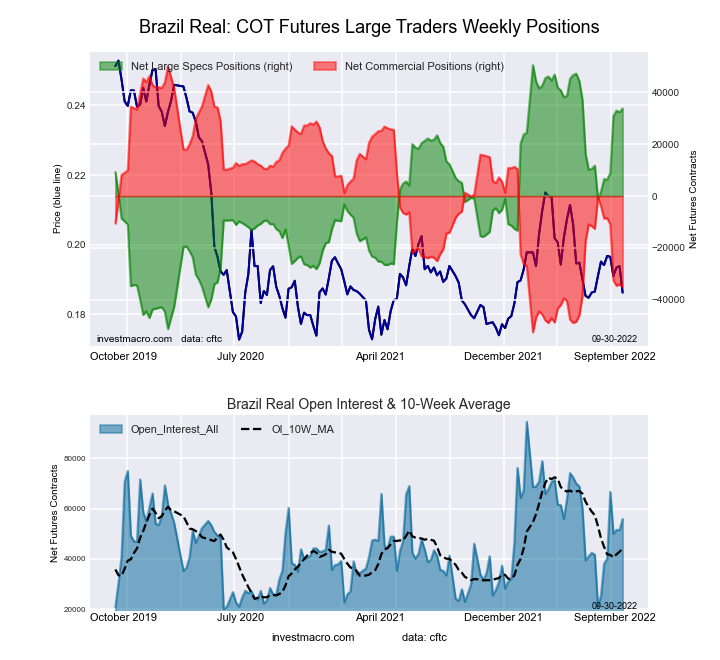 The Brazilian Real large speculator standing this week equaled a net position of 33,764 contracts in the data reported through Tuesday. This was a weekly gain of 1,395 contracts from the previous week which had a total of 32,369 net contracts.
This week’s current strength score (the trader positioning range over the past three years, measured from 0 to 100) shows the speculators are currently Bullish-Extreme with a score of 83.6 percent. The commercials are Bearish-Extreme with a score of 17.1 percent and the small traders (not shown in chart) are Bullish with a score of 79.6 percent.
| BRAZIL REAL Statistics | SPECULATORS | COMMERCIALS | SMALL TRADERS |
| – Percent of Open Interest Longs: | 70.6 | 23.1 | 5.7 |
| – Percent of Open Interest Shorts: | 10.2 | 85.7 | 3.4 |
| – Net Position: | 33,764 | -35,031 | 1,267 |
| – Gross Longs: | 39,486 | 12,907 | 3,161 |
| – Gross Shorts: | 5,722 | 47,938 | 1,894 |
| – Long to Short Ratio: | 6.9 to 1 | 0.3 to 1 | 1.7 to 1 |
| NET POSITION TREND: | | | |
| – Strength Index Score (3 Year Range Pct): | 83.6 | 17.1 | 79.6 |
| – Strength Index Reading (3 Year Range): | Bullish-Extreme | Bearish-Extreme | Bullish |
| NET POSITION MOVEMENT INDEX: | | | |
| – 6-Week Change in Strength Index: | 26.8 | -25.7 | -10.2 |
Bitcoin Futures:
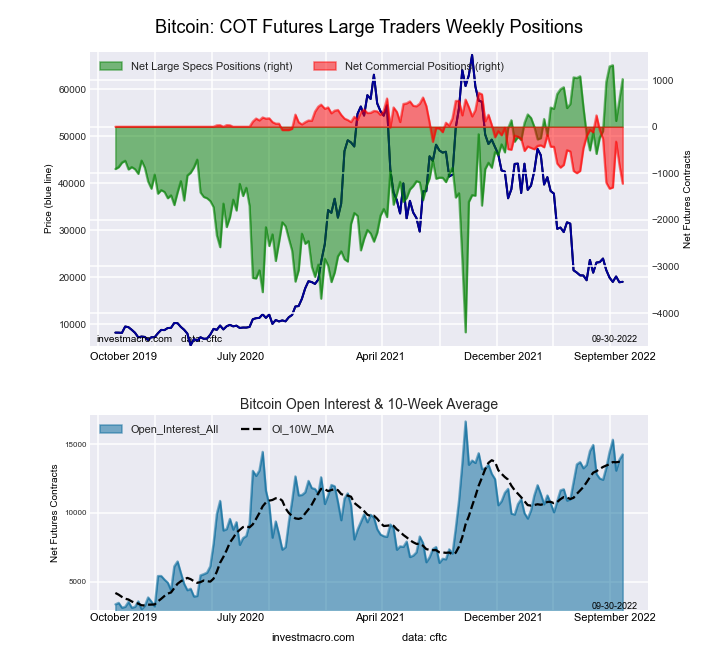 The Bitcoin large speculator standing this week equaled a net position of 1,024 contracts in the data reported through Tuesday. This was a weekly rise of 447 contracts from the previous week which had a total of 577 net contracts.
This week’s current strength score (the trader positioning range over the past three years, measured from 0 to 100) shows the speculators are currently Bullish-Extreme with a score of 94.8 percent. The commercials are Bearish-Extreme with a score of 5.2 percent and the small traders (not shown in chart) are Bearish-Extreme with a score of 17.4 percent.
| BITCOIN Statistics | SPECULATORS | COMMERCIALS | SMALL TRADERS |
| – Percent of Open Interest Longs: | 83.4 | 0.4 | 7.4 |
| – Percent of Open Interest Shorts: | 76.2 | 9.0 | 6.1 |
| – Net Position: | 1,024 | -1,221 | 197 |
| – Gross Longs: | 11,902 | 64 | 1,061 |
| – Gross Shorts: | 10,878 | 1,285 | 864 |
| – Long to Short Ratio: | 1.1 to 1 | 0.0 to 1 | 1.2 to 1 |
| NET POSITION TREND: | | | |
| – Strength Index Score (3 Year Range Pct): | 94.8 | 5.2 | 17.4 |
| – Strength Index Reading (3 Year Range): | Bullish-Extreme | Bearish-Extreme | Bearish-Extreme |
| NET POSITION MOVEMENT INDEX: | | | |
| – 6-Week Change in Strength Index: | 19.5 | -46.7 | -3.5 |
Article By InvestMacro – Receive our weekly COT Newsletter
*COT Report: The COT data, released weekly to the public each Friday, is updated through the most recent Tuesday (data is 3 days old) and shows a quick view of how large speculators or non-commercials (for-profit traders) were positioned in the futures markets.
The CFTC categorizes trader positions according to commercial hedgers (traders who use futures contracts for hedging as part of the business), non-commercials (large traders who speculate to realize trading profits) and nonreportable traders (usually small traders/speculators) as well as their open interest (contracts open in the market at time of reporting). See CFTC criteria here.


