
By RoboForex Analytical Department
The latest UK GDP data showed annualised growth of 1.3%, in line with market expectations and slightly below the previous reading of 1.4%. The report had a broadly neutral impact on sterling, as it confirms the UK economy continues to expand, albeit at a moderate pace, without signs of acceleration.
For the GBP/USD pair, the lack of surprise is the key takeaway. With the data matching consensus forecasts, investors have little reason to reassess their current macroeconomic outlook. In such cases, the pound tends not to attract fresh buying momentum but also avoids sharp selling pressure.
Nevertheless, the slight deceleration in growth from the prior period creates a modestly cautious backdrop for sterling. The softer figure may signal that the economy remains sensitive to elevated interest rates and subdued domestic demand. This interpretation could temper expectations of further monetary tightening from the Bank of England and limit the scope for more hawkish communication.
In the near term, the direct market impact of this GDP release is assessed as largely neutral, albeit with a mild downside bias for the pound. Subsequent direction will likely depend on upcoming UK inflation and labour market reports, alongside evolving US rate expectations and broader global risk sentiment.
Technical Analysis: GBP/USD
Free Reports:
 Get our Weekly Commitment of Traders Reports - See where the biggest traders (Hedge Funds and Commercial Hedgers) are positioned in the futures markets on a weekly basis.
 Download Our Metatrader 4 Indicators – Put Our Free MetaTrader 4 Custom Indicators on your charts when you join our Weekly Newsletter
H4 Chart:
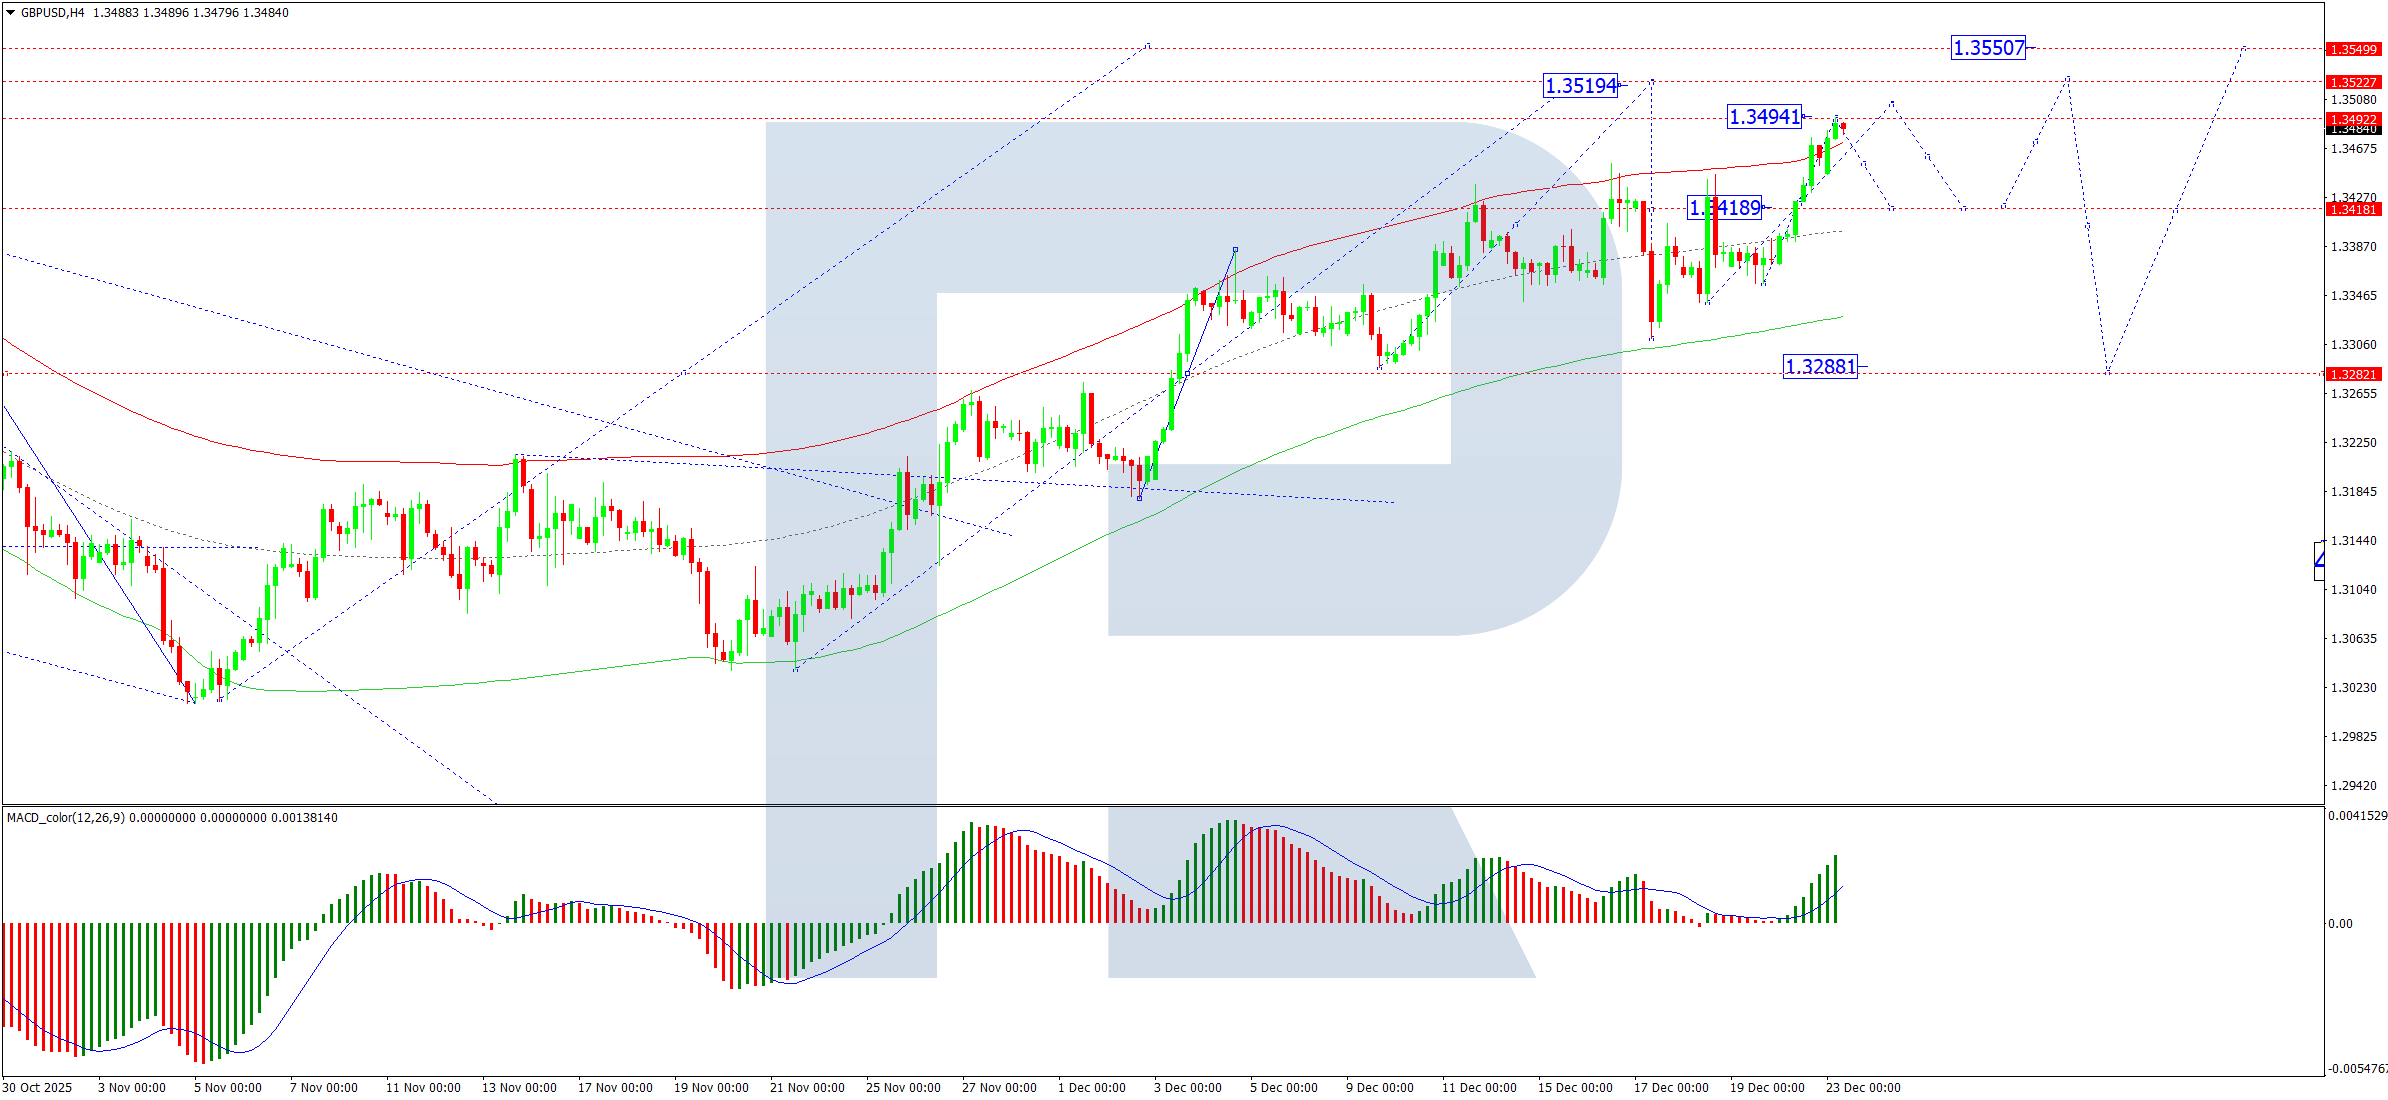
On the H4 chart, the pair has entered a broad consolidation zone around 1.3418. We anticipate a possible extension of the range towards 1.3500 in the near term, followed by a corrective pullback to 1.3418. Upon completion of this retracement, the broader upward trend is expected to resume, targeting 1.3520, with potential for further extension towards 1.3550.
This outlook is supported by the MACD indicator, with its signal line positioned above zero and pointing firmly upward.
H1 Chart:
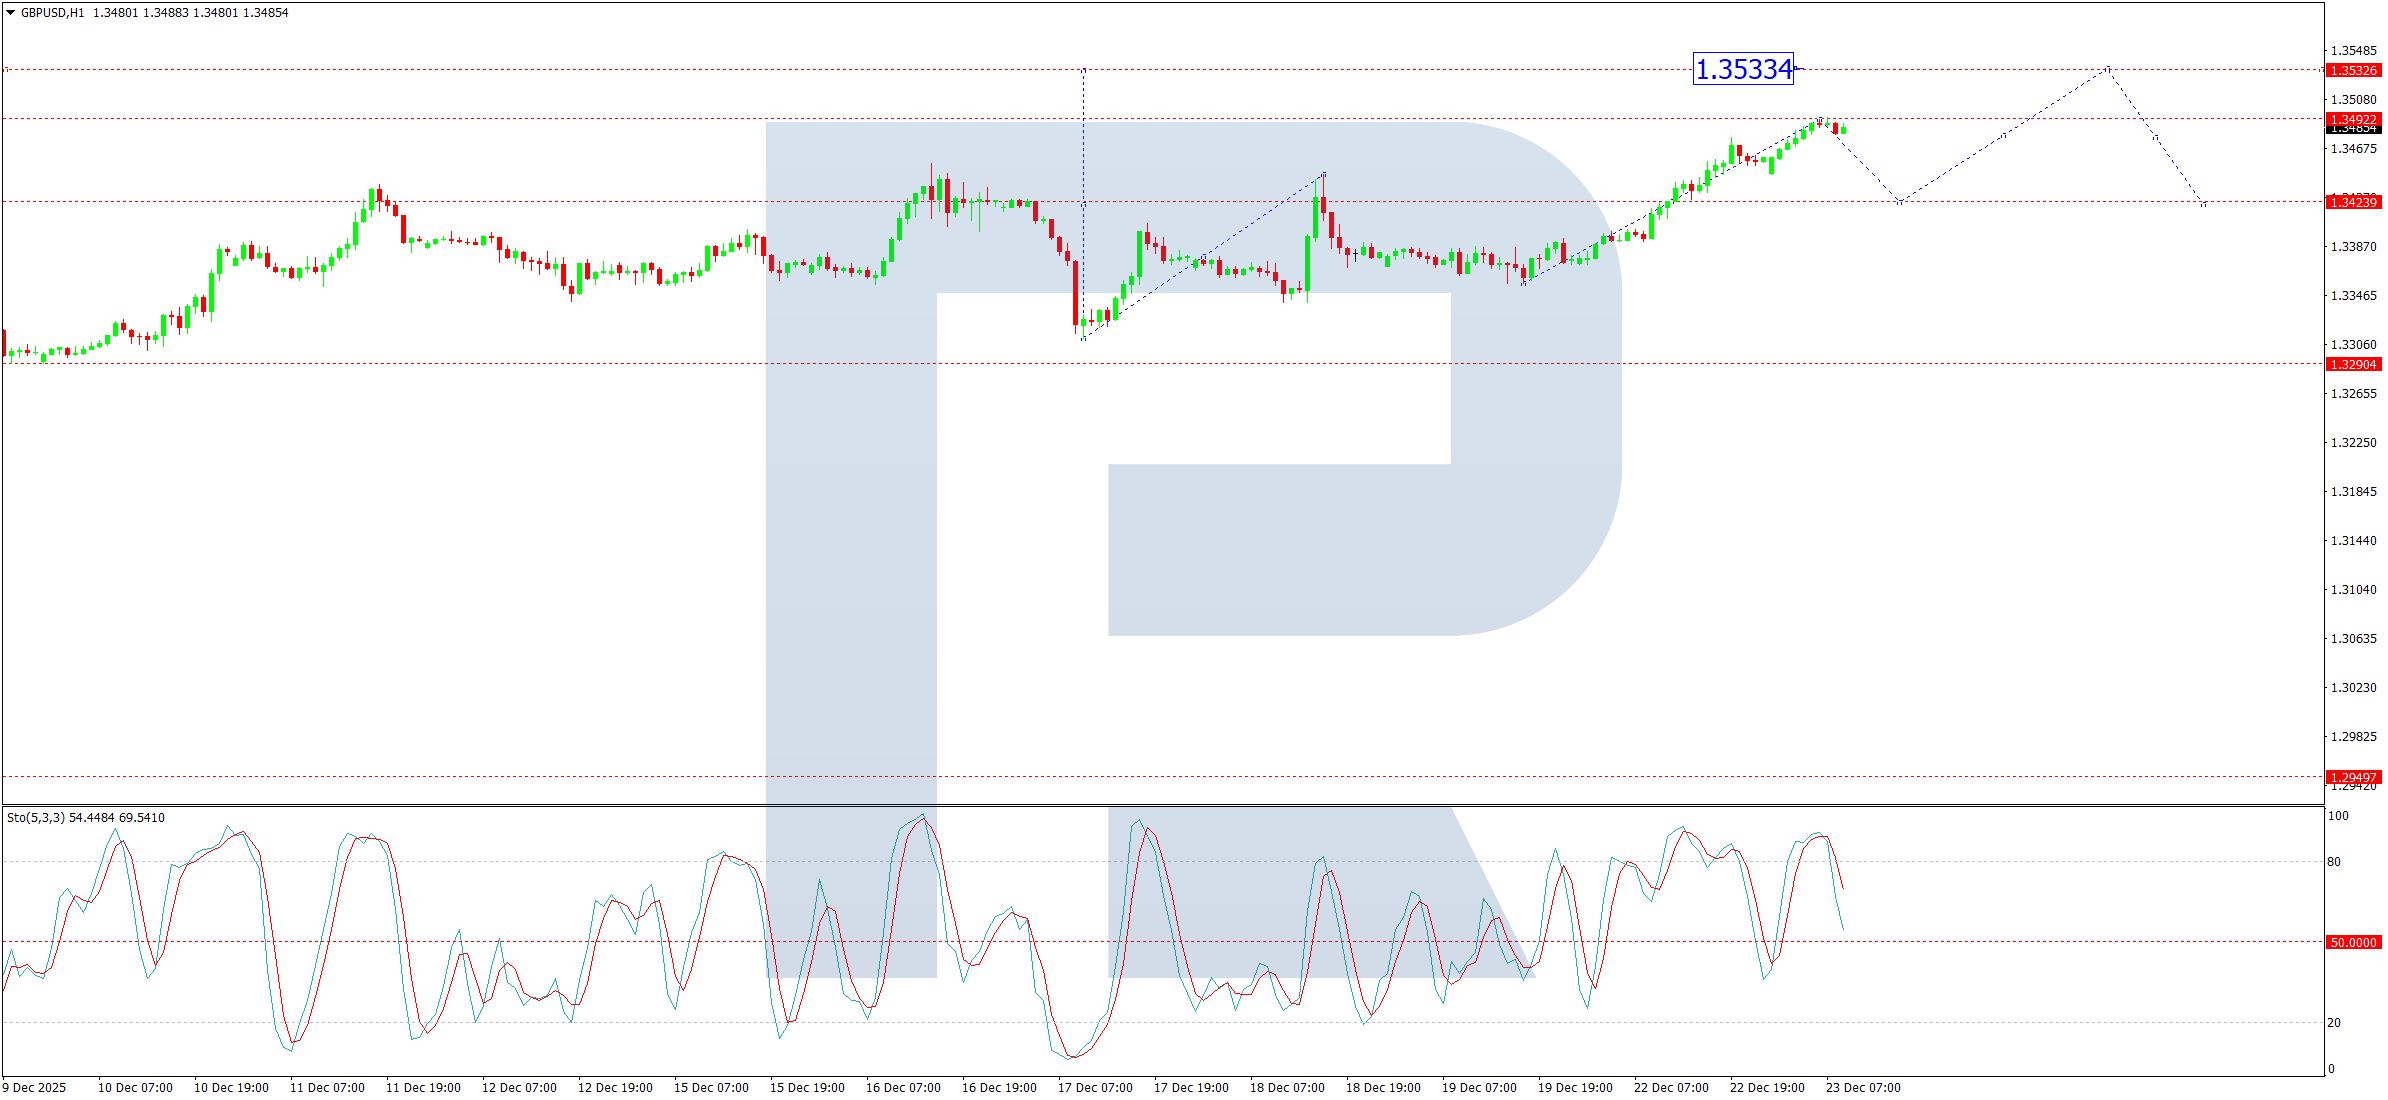
On the H1 chart, price action formed a tight consolidation around 1.3424 before breaking higher and advancing to 1.3492 (a local target). We now expect a corrective decline to retest the 1.3424 level from above. Once this correction concludes, the focus will shift to the potential for a subsequent growth wave toward 1.3533.
This scenario is validated by the Stochastic oscillator, whose signal line is above 80 and has begun to turn lower towards the 20 level, indicating near-term corrective momentum.
Conclusion
The GBP/USD pair is likely to remain range-bound in the wake of in-line GDP data, which neither strengthens nor weakens the sterling narrative decisively. While the technical structure favours further upside in the medium term, near-term price action suggests a period of consolidation or mild correction may precede any renewed bullish impulse.
Disclaimer:
Any forecasts contained herein are based on the author’s particular opinion. This analysis may not be treated as trading advice. RoboForex bears no responsibility for trading results based on trading recommendations and reviews contained herein.

- Geopolitical and macroeconomic conditions continue to pressure market sentiment Jul 20, 2026
- USD/JPY Poised to Continue Gains as Expensive Oil and Lack of Support Weigh on Yen Jul 20, 2026
- COT Metals Charts: Weekly Speculator Bets led by Copper & Steel Jul 18, 2026
- COT Bonds Charts: Weekly Speculator Bets led by 2-Year, SOFR 3M & 5-Year Bonds Jul 18, 2026
- COT Energy Charts: Weekly Speculator Bets led by Brent Oil & Heating Oil Jul 18, 2026
- COT Soft Commodities Charts: Weekly Speculator Bets led by Wheat, Corn & Soybean Meal Jul 18, 2026
- The Bank of Canada kept its interest rate unchanged. Platinum prices reached a three‑week high Jul 16, 2026
- Stock indices rose after the release of US inflation data. China’s GDP slowed sharply Jul 15, 2026
- GBP/USD Awaits Political News: What Will Happen Next Jul 15, 2026
- USD/JPY Holds at Highs: Pressure Lingers on Yen Jul 14, 2026