By RoboForex Analytical Department
The British pound declined to around $1.3300 against the US dollar on Wednesday, as UK inflation undershot expectations and reinforced market convictions that the Bank of England (BoE) will cut interest rates on Thursday.
The annual Consumer Prices Index (CPI) inflation rate slowed to 3.2% in November, missing forecasts of 3.5% and falling below the central bank’s projection of 3.4%. This followed labour market data earlier in the week, which revealed unemployment rose to its highest level since 2021, while wage growth eased – albeit less sharply than anticipated.
The economic backdrop has weakened further following last week’s Gross Domestic Product (GDP) data, which confirmed the UK economy contracted for a second consecutive month in October. Given this deteriorating picture, the BoE is now widely expected to resume its monetary easing cycle, cutting the Bank Rate by 25 basis points to 3.75% – its lowest level since 2022. The central bank has held rates steady at its last two meetings in September and November.
Money markets have adjusted their expectations in response, now pricing in approximately 66 basis points of total easing by the end of 2026, up from around 58 basis points before the latest inflation report.
Technical Analysis: GBP/USD
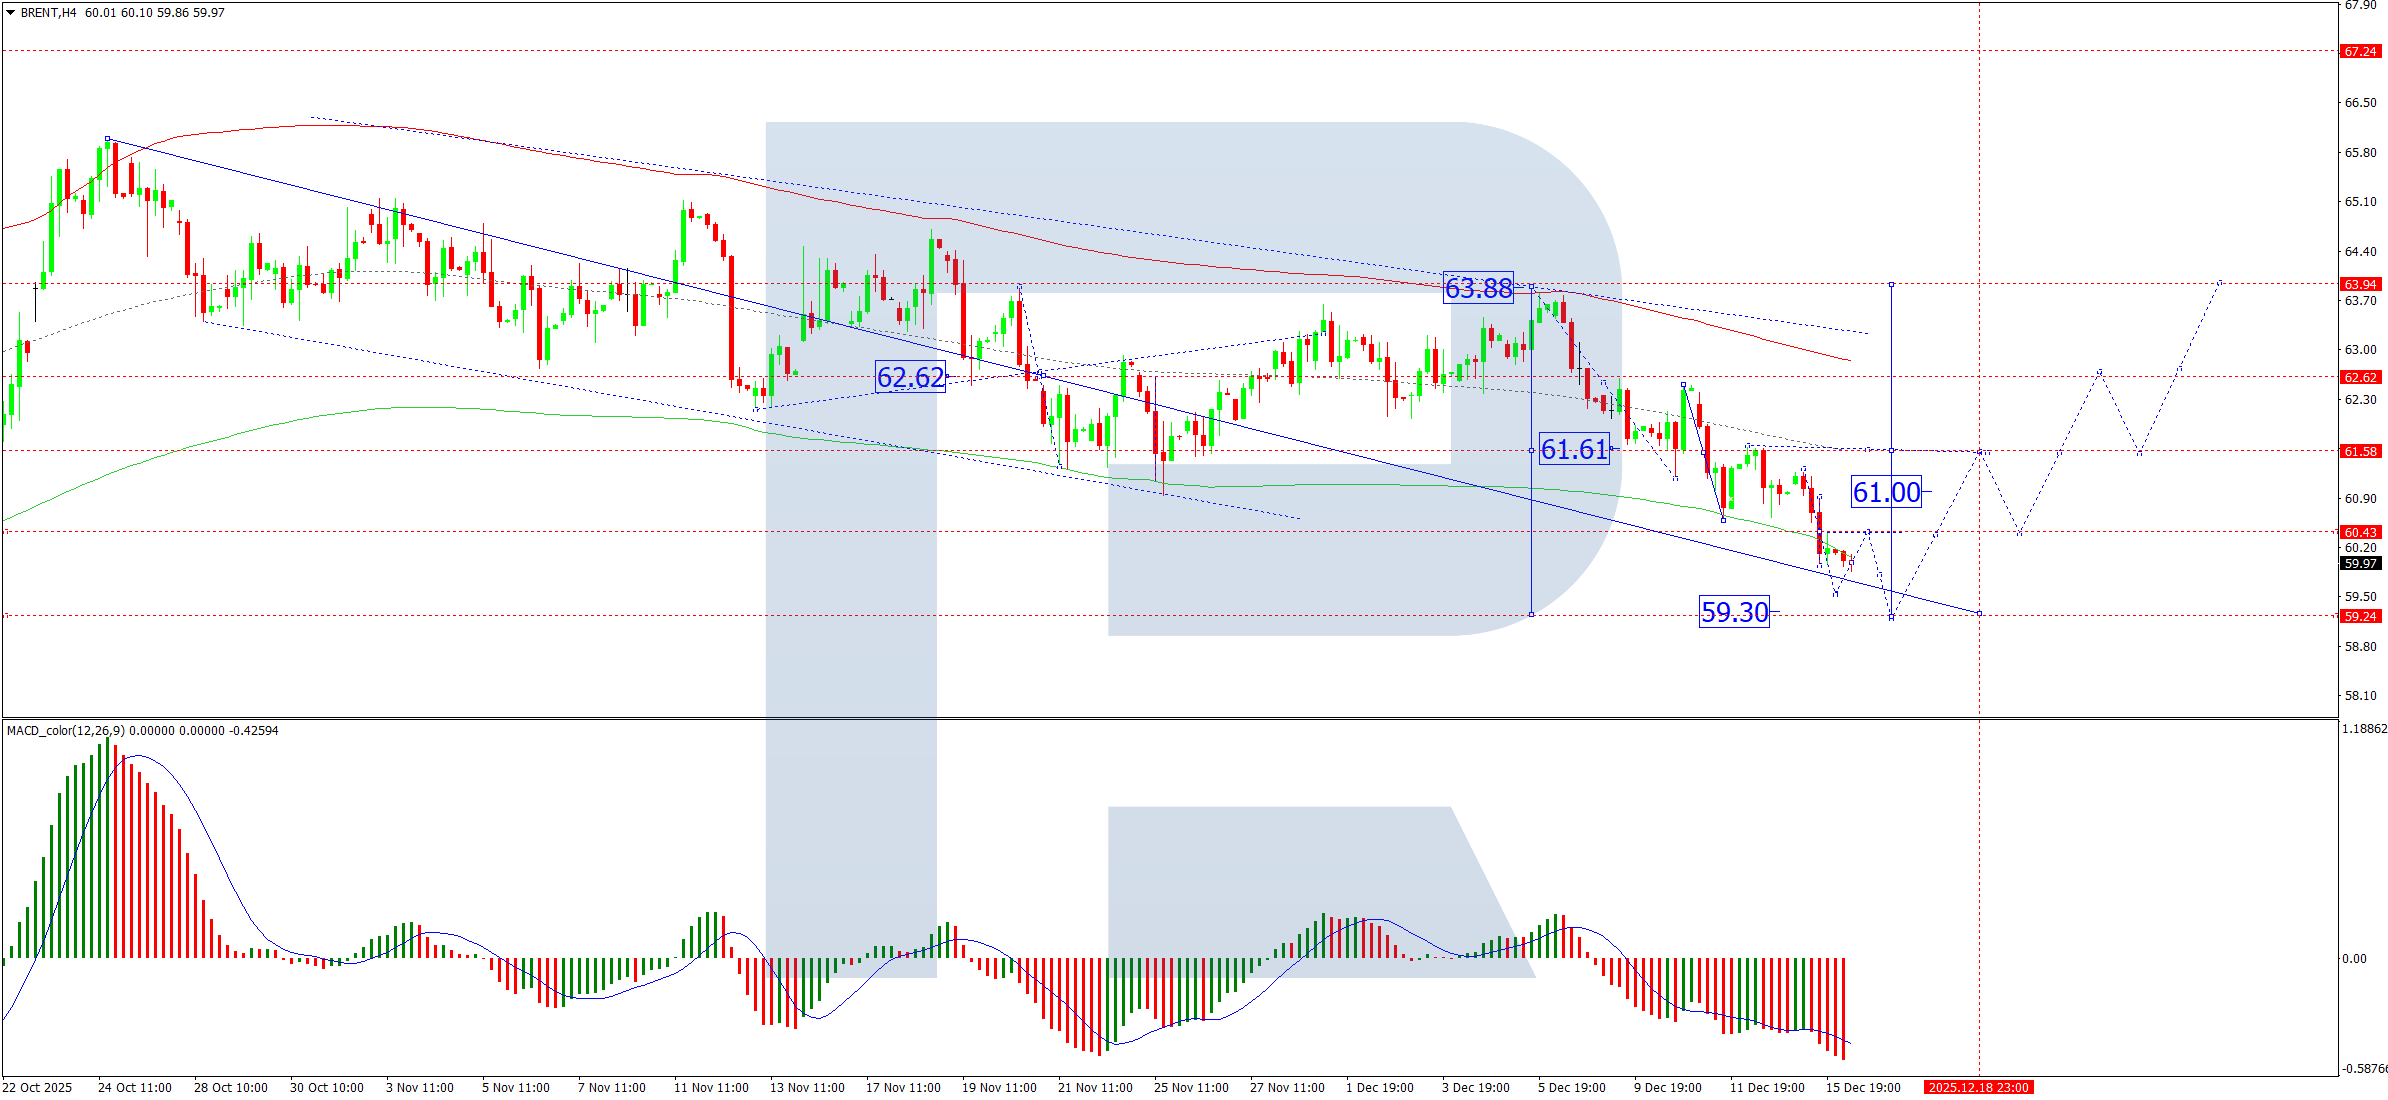
H4 Chart:
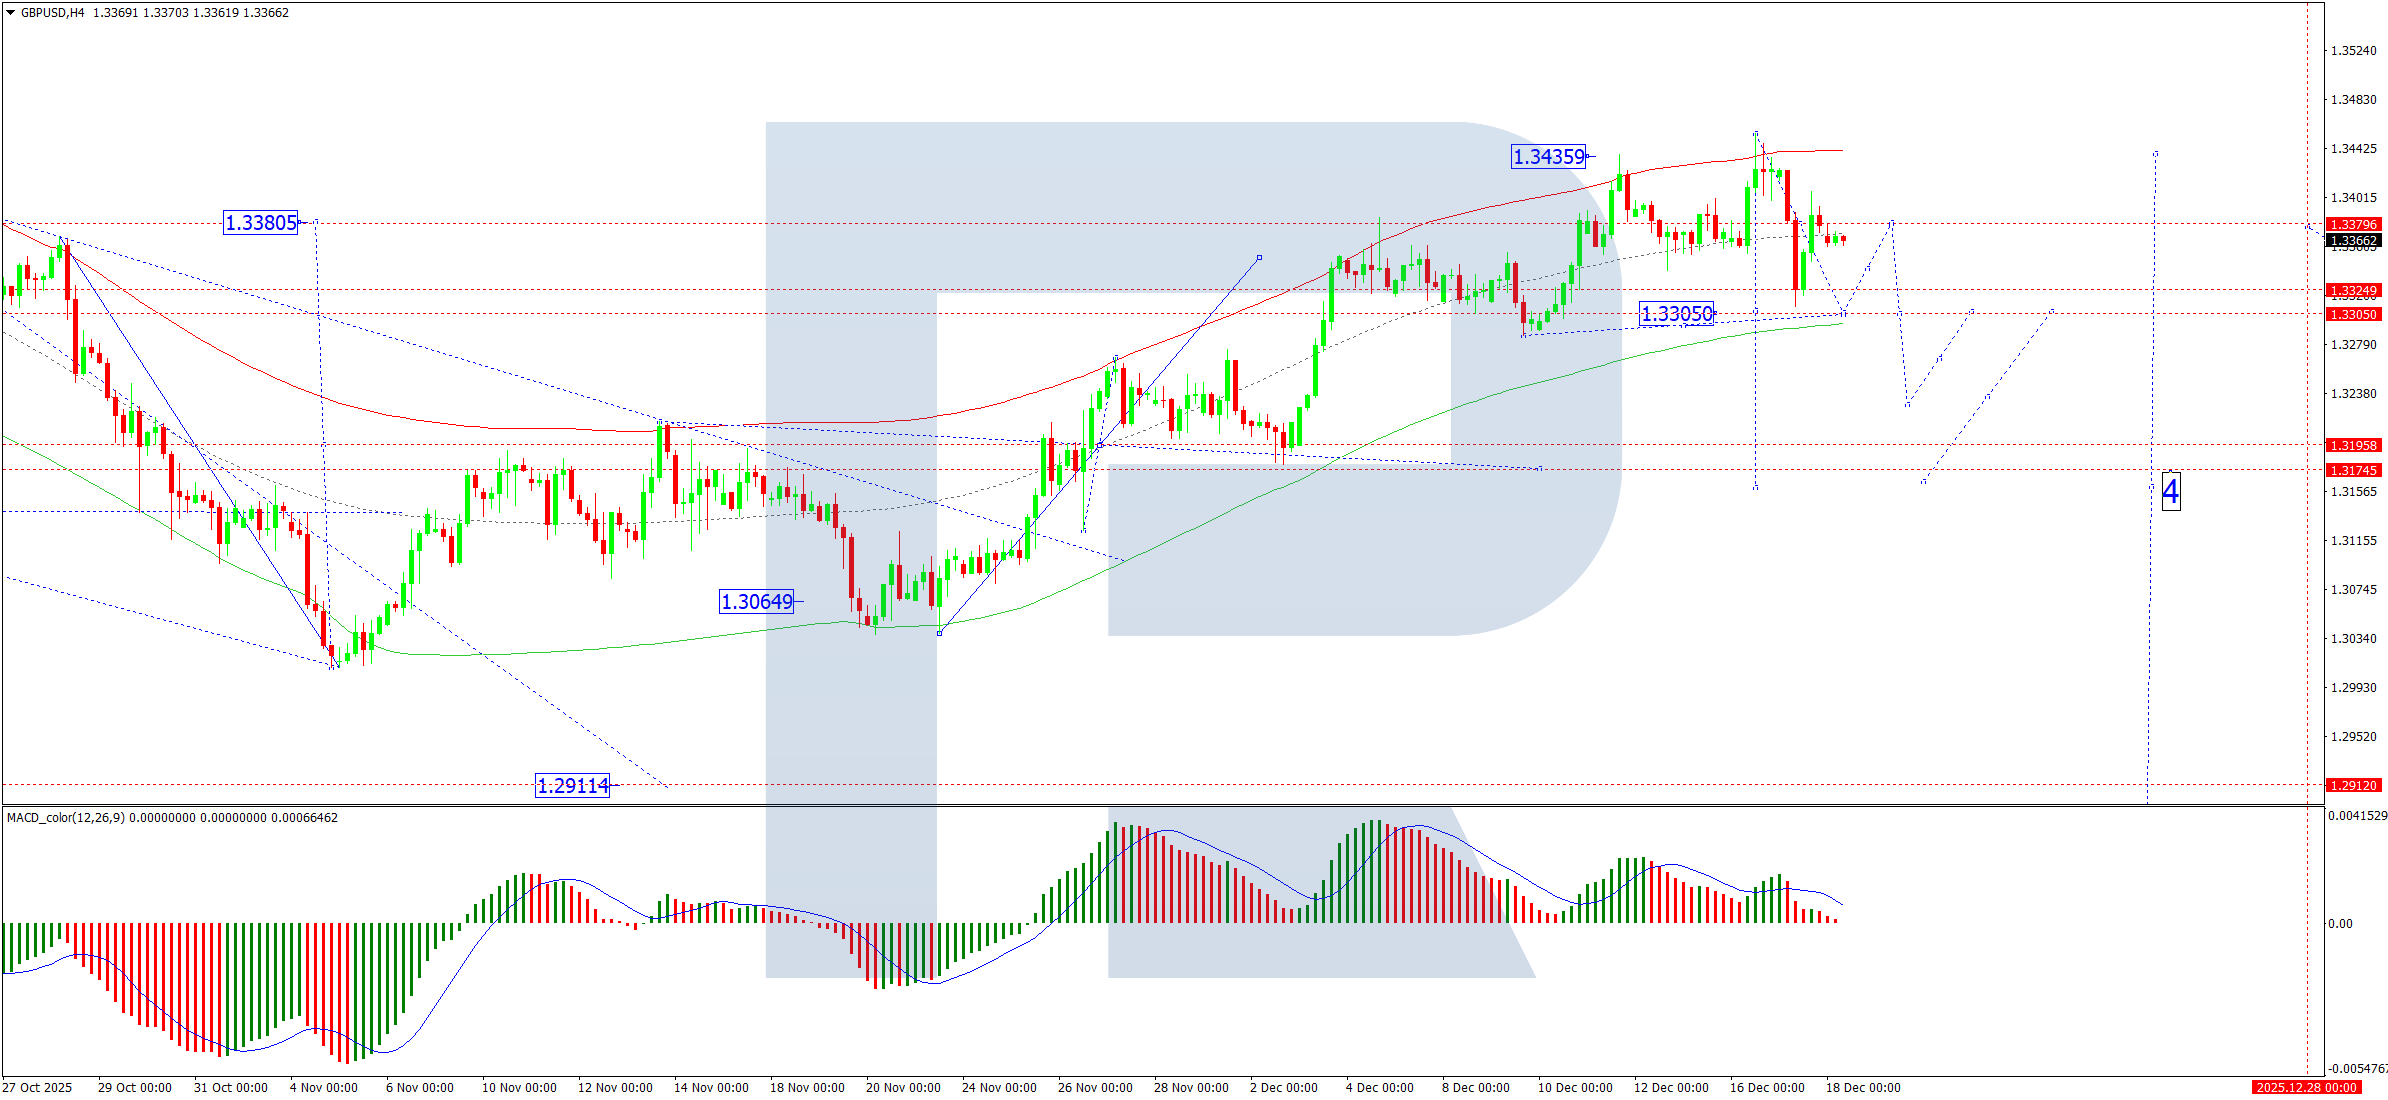
On the H4 chart, the pair is developing a downward wave structure with a target at 1.3300. We expect this level to be tested today. Subsequently, a corrective rebound towards 1.3370 is likely. Once this correction is complete, the primary downtrend is anticipated to resume, targeting 1.3240, with potential for an extension towards 1.3175.
This bearish scenario is technically confirmed by the MACD indicator. Its signal line has exited the histogram zone and is near the zero mark, suggesting it will decline to new lows.
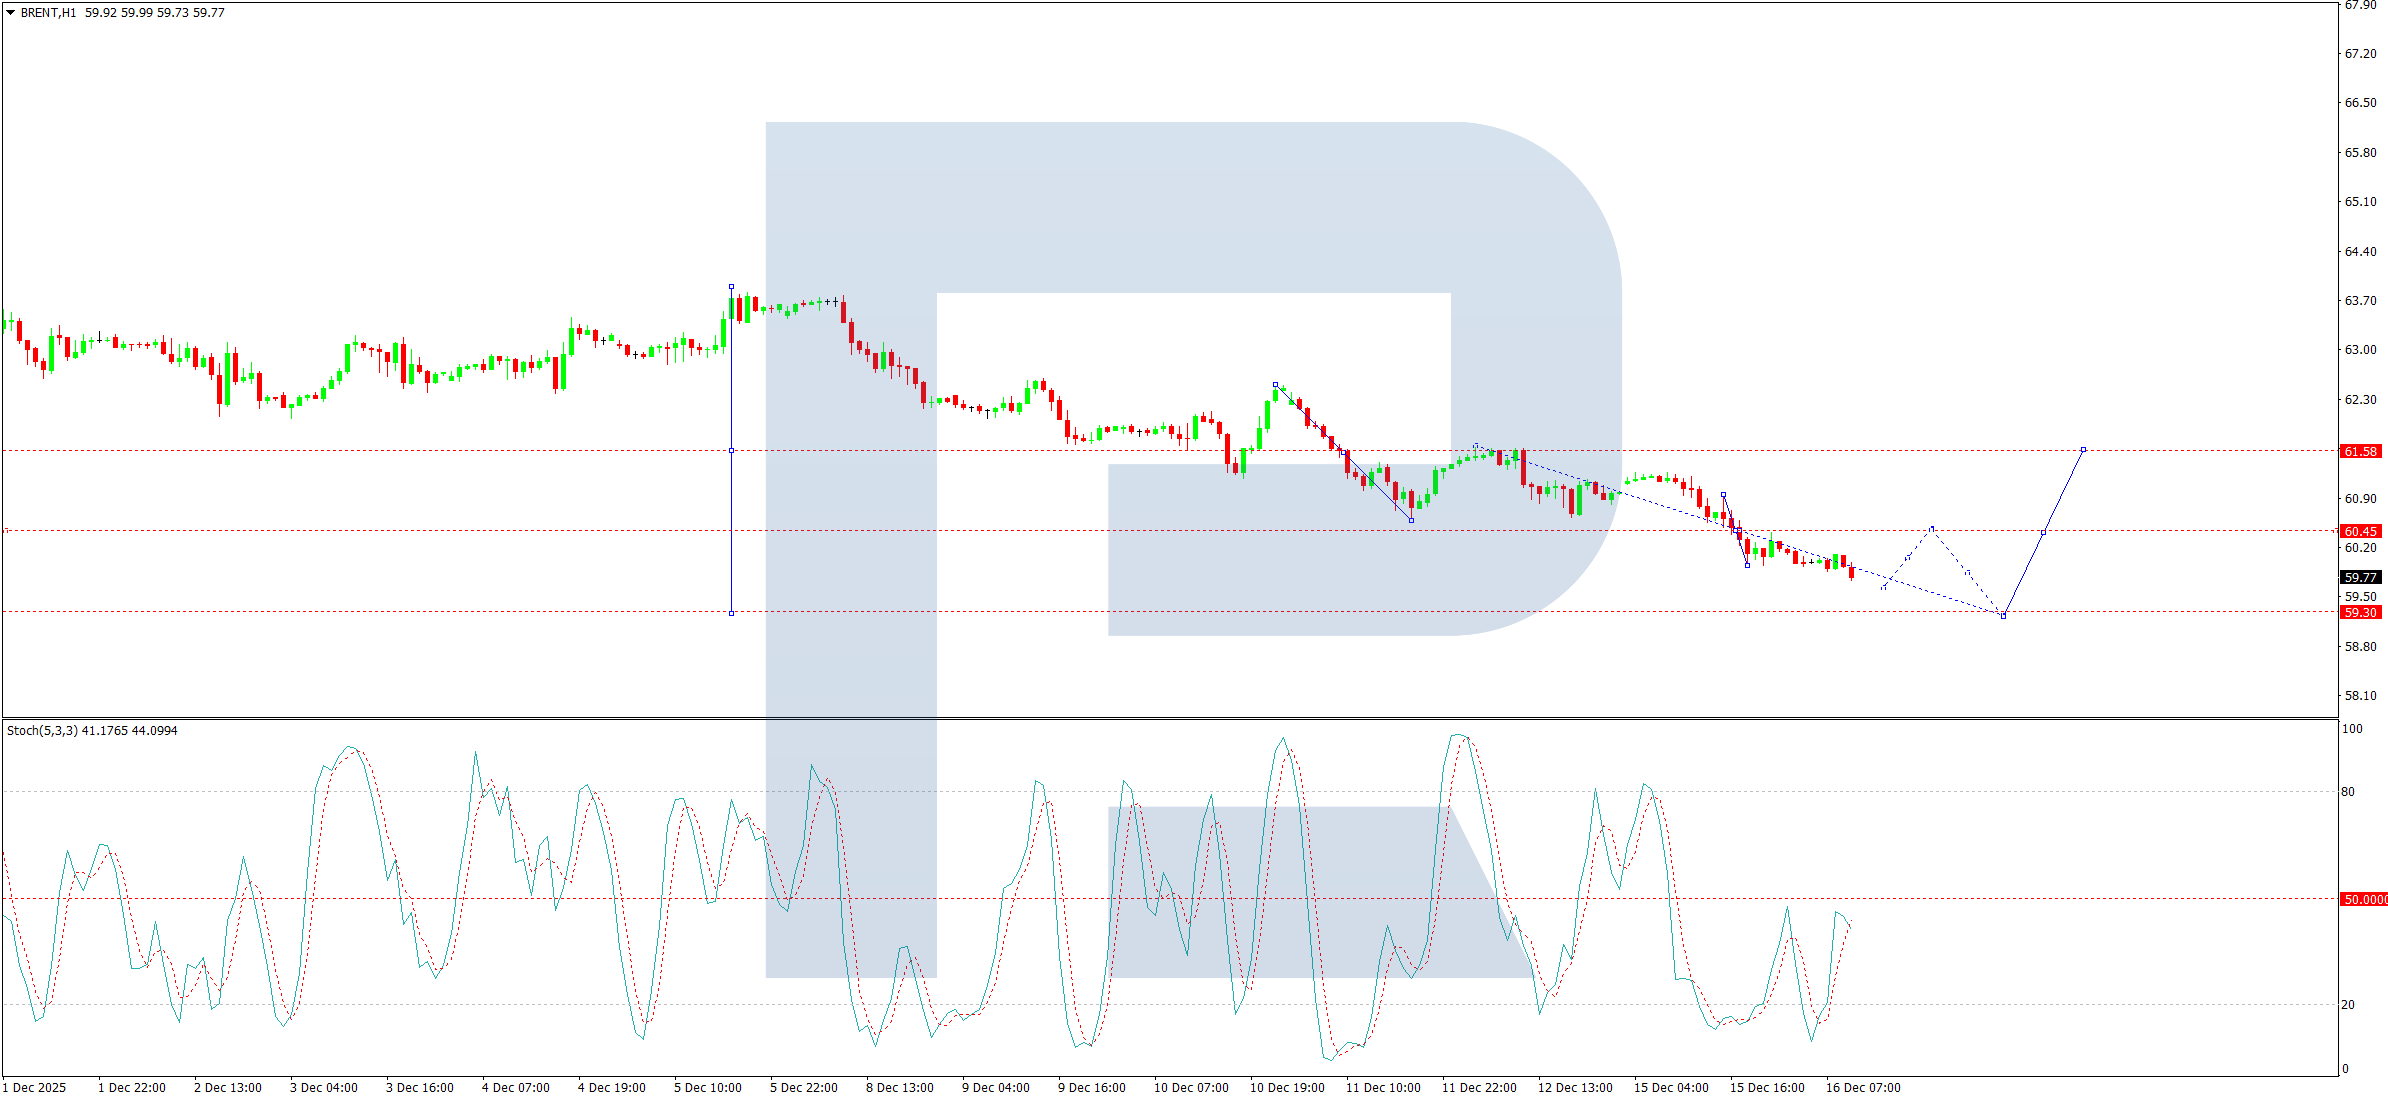
H1 Chart:

On the H1 chart, the market is forming a downward impulse targeting 1.3290 as its initial objective. Following this, a correction towards 1.3370 is likely. Upon completion of this corrective phase, the focus will shift to the potential continuation of the downtrend.
This outlook is supported by the Stochastic oscillator. Its signal line is below the 50 level and is pointing firmly downwards towards 20.
Conclusion
The pound remains under clear pressure ahead of Thursday’s pivotal BoE meeting, with soft inflation and growth data significantly raising the odds of a rate cut. The technical posture is bearish across timeframes, suggesting any near-term corrective bounce is likely to be sold into, paving the way for a test of lower support levels.
Disclaimer:
Any forecasts contained herein are based on the author’s particular opinion. This analysis may not be treated as trading advice. RoboForex bears no responsibility for trading results based on trading recommendations and reviews contained herein.