Archive for Financial News – Page 300

Japanese Candlesticks Analysis 29.08.2022 (USDCAD, AUDUSD, USDCHF)

Article By RoboForex.com

USDCAD, “US Dollar vs Canadian Dollar”

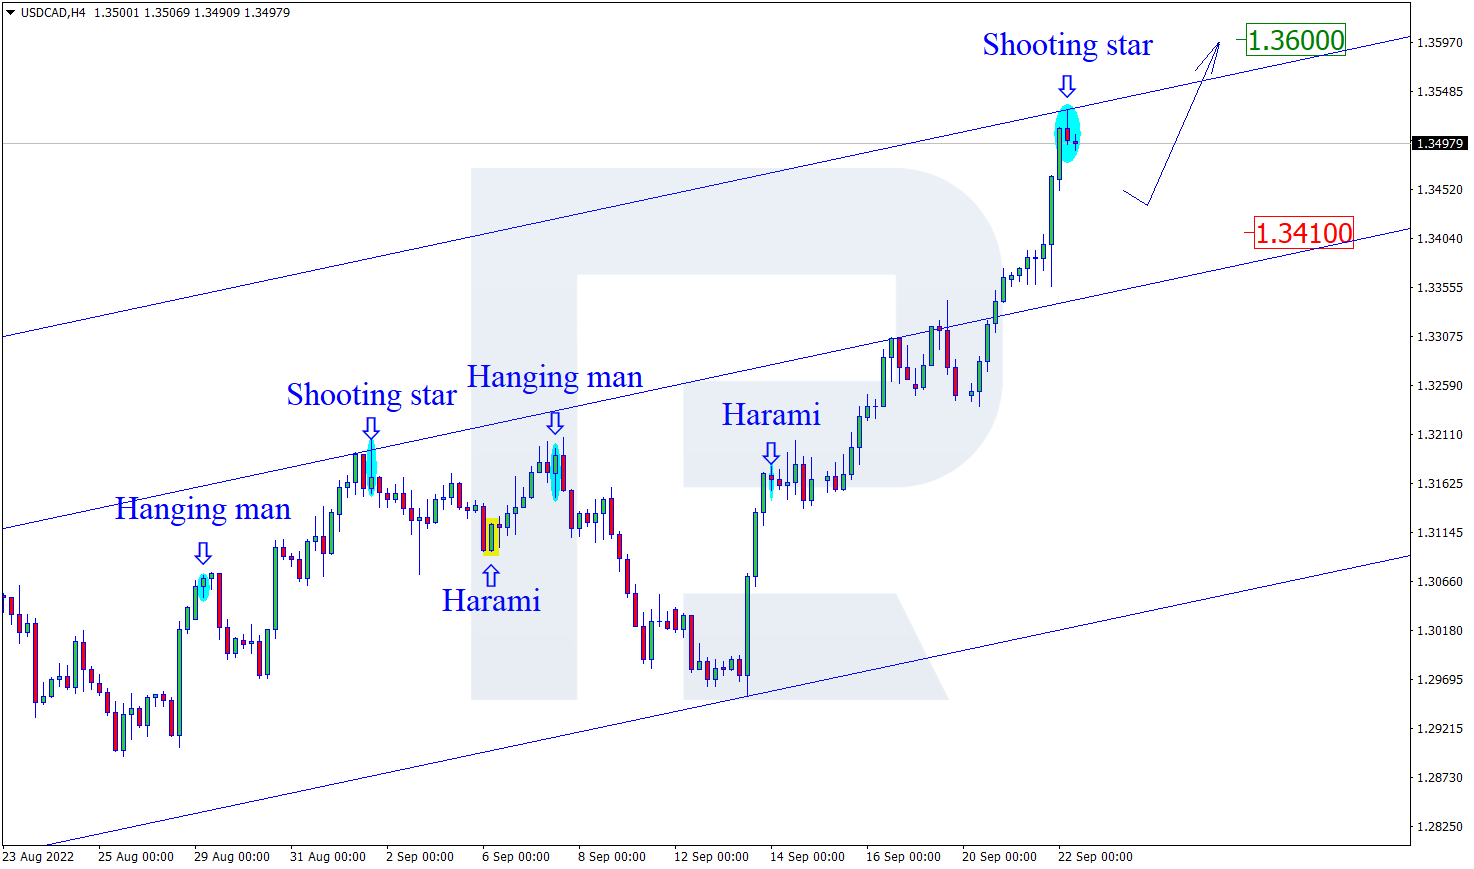
As we can see in the H4 chart, after forming a Hanging Man reversal pattern close to the resistance level, USDCAD may reverse in the form of a new descending impulse. In this case, the downside correctional target may be at 1.2990. Later, the market may rebound from this level and resume growing. However, an alternative scenario implies that the asset may continue growing to reach 1.3125 without any pullbacks down to the support area.

USDCAD
Risk Warning: the result of previous trading operations do not guarantee the same results in the future

AUDUSD, “Australian Dollar vs US Dollar”

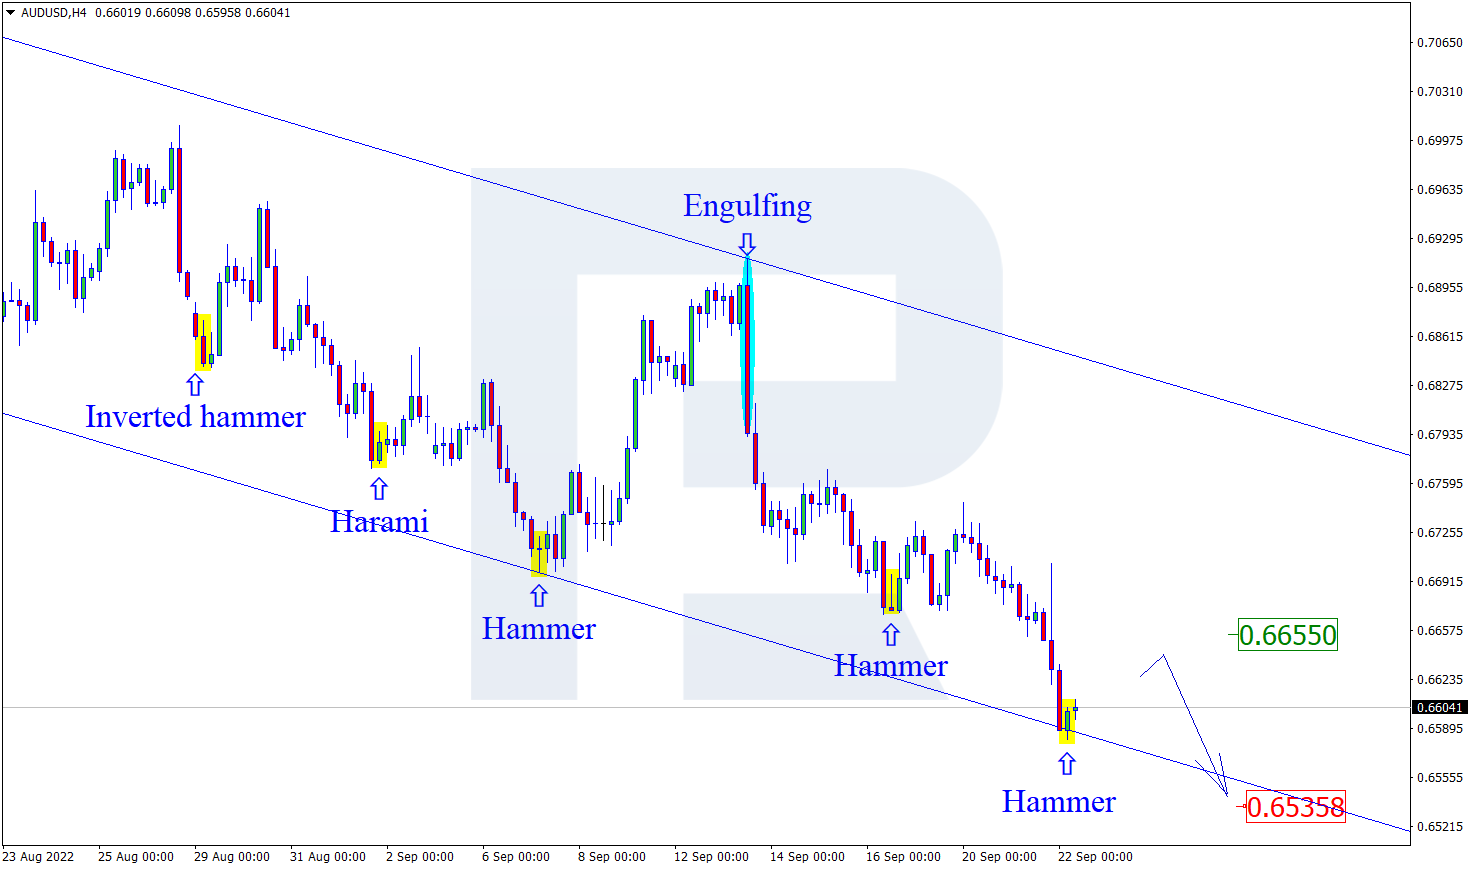
As we can see in the H4 chart, AUDUSD has formed an Inverted Hammer reversal pattern near the support area. At the moment, the asset is reversing in the form of a new rising impulse. In this case, the upside target may be the resistance level at 0.6970. After testing the level, the price may break it and continue the ascending tendency. At the same time, the opposite scenario implies that the price may correct to reach 0.6825 and continue the uptrend only after the pullback down to support area.

AUDUSD
Risk Warning: the result of previous trading operations do not guarantee the same results in the future

USDCHF, “US Dollar vs Swiss Franc”

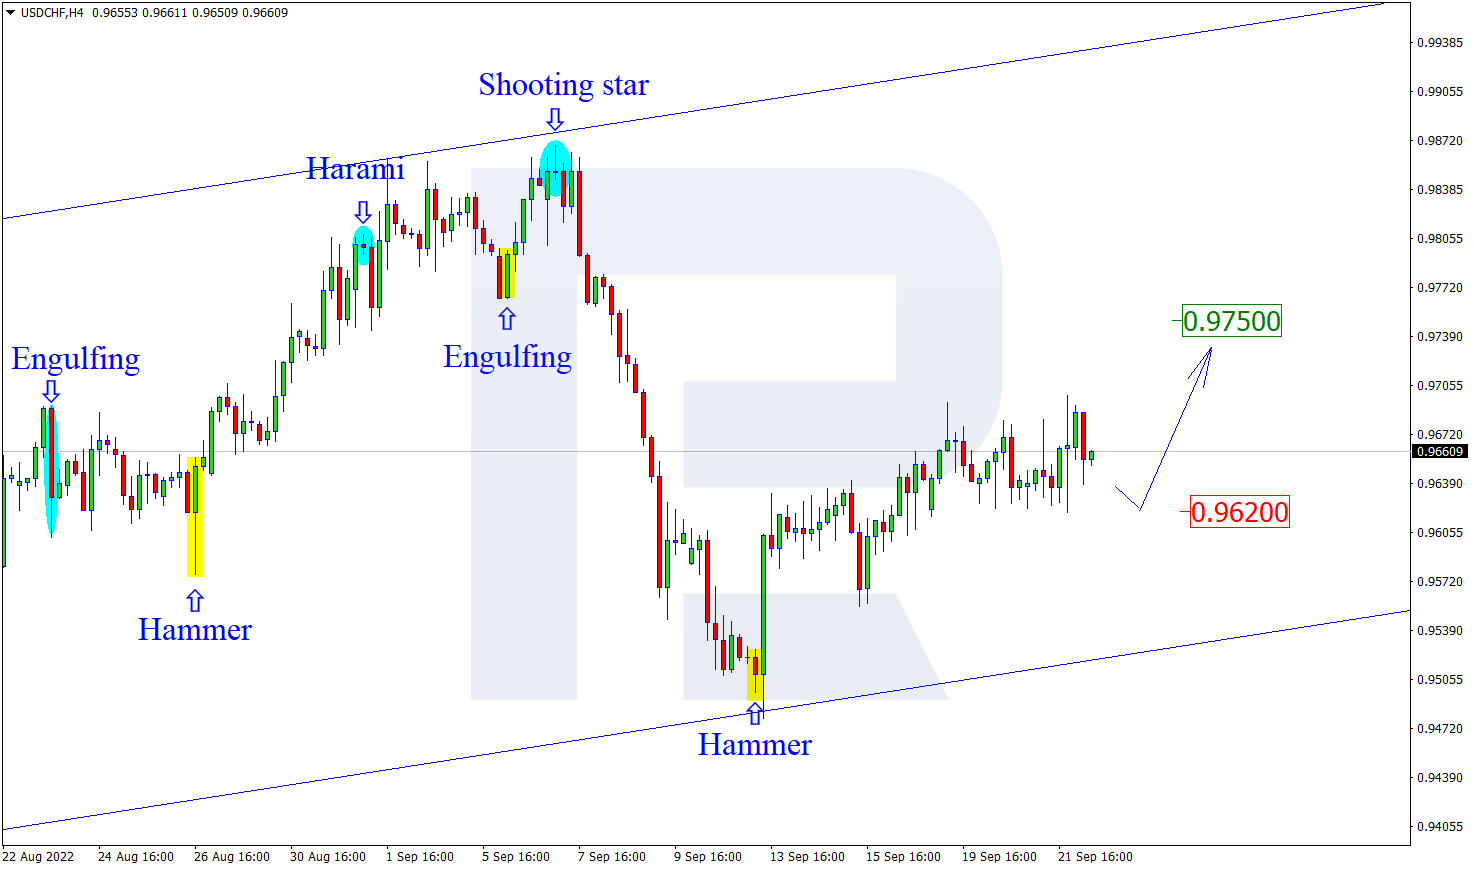
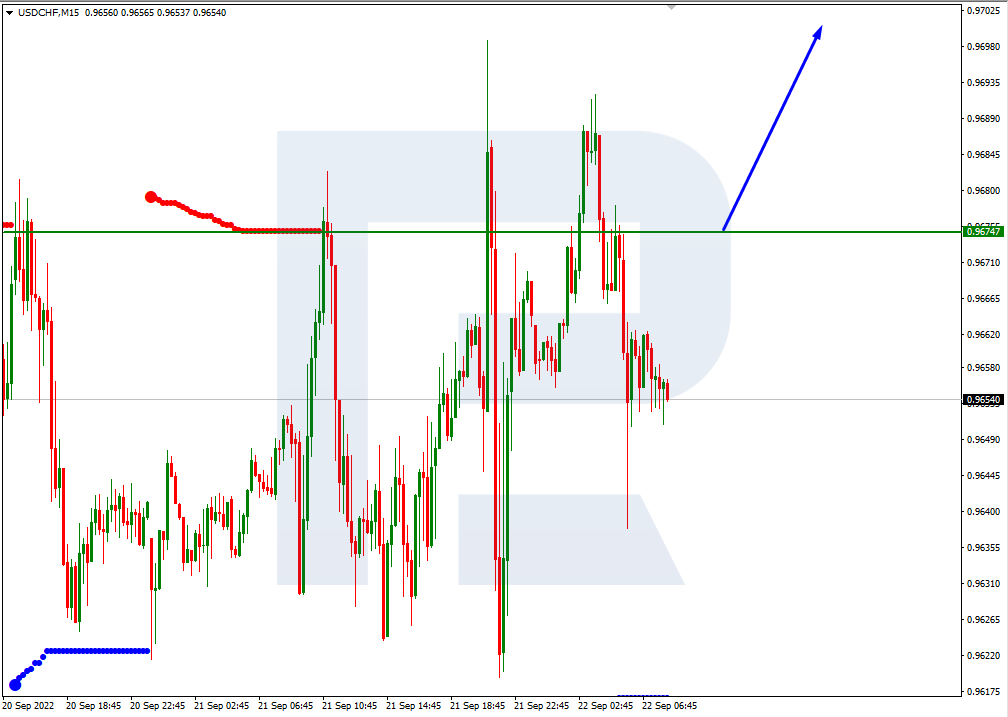
As we can see in the H4 chart, after testing the support area, the pair has formed a Hammer reversal pattern. At the moment, USDCHF may reverse in the form of a new ascending impulse. In this case, the upside target may be the resistance level at 0.9750. After testing this level, the price may break it and continue trading upwards. Still, there might be an alternative scenario, in which the asset may correct to reach 0.9621 and continue the ascending tendency only after the pullback.

USDCHF

Article By RoboForex.com

Attention!
Forecasts presented in this section only reflect the author’s private opinion and should not be considered as guidance for trading. RoboForex LP bears no responsibility for trading results based on trading recommendations described in these analytical reviews.

Murrey Math Lines 29.08.2022 (EURUSD, GBPUSD)

Article By RoboForex.com

EURUSD, “Euro vs US Dollar”

In the H4 chart, EURUSD is trading below the 200-day Moving Average to indicate a possible descending tendency. In this case, the price is expected to test 2/8, break it, and then continue falling to reach the support at 1/8. Still, this scenario may no longer be valid if the price breaks the resistance at 3/8 to the upside. After that, the instrument may reverse and grow towards 5/8.

EURUSD
Risk Warning: the result of previous trading operations do not guarantee the same results in the future

As we can see in the M15 chart, the pair has broken the downside line of the VoltyChannel indicator and, as a result, may continue its decline.

EURUSD
Risk Warning: the result of previous trading operations do not guarantee the same results in the future

GBPUSD, “Great Britain Pound vs US Dollar”

In the H4 chart, GBPUSD is moving inside the “oversold area”. In this case, the price is expected to rebound from -1/8 and resume growing to reach the resistance at 2/8. However, this scenario may no longer be valid if the price breaks -1/8 to the downside. After that, the instrument may continue falling towards the support at -2/8.

GBPUSD
Risk Warning: the result of previous trading operations do not guarantee the same results in the future

As we can see in the M15 chart, the upside line of the VoltyChannel indicator is pretty far away from the price, that’s why the pair may resume trading upwards only after rebounding from -1/8 in the H4 chart.

GBPUSD_M15

Article By RoboForex.com

Attention!
Forecasts presented in this section only reflect the author’s private opinion and should not be considered as guidance for trading. RoboForex LP bears no responsibility for trading results based on trading recommendations described in these analytical reviews.

The Analytical Overview of the Main Currency Pairs on 2022.08.29

By JustForex

The EUR/USD currency pair

Technical indicators of the currency pair:
  • Prev Open: 0.9973
  • Prev Close: 0.9964
  • % chg. over the last day: -0.09%

A recession in the Eurozone is now very likely. Still, it alone will not lower inflation, and the European Central Bank should opt for a significant interest rate hike next month, ECB policymaker Martins Kazaks said on Saturday. The ECB raised rates by 50 basis points in July, and a similar move is scheduled for September 8, but some policymakers have begun talking about even more hikes as the outlook for inflation worsens. Mr. Kazacs also added that with zero rates now, the ECB is still supporting the economy, and by the first quarter of next year, the bank should reach a neutral level that does not slow or stimulate the economy.

Trading recommendations
  • Support levels: 0.9931
  • Resistance levels: 1.0032, 1.0112, 1.0146, 1.0230, 1.0286, 1.0365

From the technical point of view, the trend on the EUR/USD currency pair on the hourly time frame is bearish. The price is trading below the moving averages again. The MACD indicator has become negative. Under such market conditions, buy trades are best sought on intraday time frames from the support level of 0.9931, but with confirmation. Sell trades can be considered from resistance levels of 1.0032, but only after the additional confirmation.

Alternative scenario: if the price breaks out of the 1.0146 resistance level and fixes above, the uptrend will likely resume.

EUR/USD
News feed for 2022.08.29:
  • – US FOMC Member Brainard Speaks at 21:15 (GMT+3).

The GBP/USD currency pair

Technical indicators of the currency pair:
  • Prev Open: 1.1833
  • Prev Close: 1.1737
  • % chg. over the last day: -0.82%

Amid talk that inflation will exceed 18% next year and families across the country are likely to face energy poverty this winter, Britain’s economic woes are worsening by the day. Analysts agree that the Bank of England will have no choice but to plunge the economy into a serious recession and cause massive job cuts to curb price pressures. Rising energy prices are fueling financial markets with higher inflation forecasts, leading traders to believe the Bank of England should be more aggressive. Money markets are now showing expectations of a 4.25% rise in the benchmark interest rate next year, the highest level since 2008.

Trading recommendations
  • Support levels: 1.1659
  • Resistance levels: 1.1838, 1.1901, 1.1994, 1.2035, 1.2167, 1.2215, 1.2294

From the technical point of view, the trend on the GBP/USD currency pair on the hourly time frame is bearish. The British pound is losing ground again and doing it faster than the euro. The MACD indicator has turned negative, and prices are below the moving levels again. At the moment, it is better to look for sell trades from the resistance level of 1.1838 or 1.1901, but only after the additional confirmation. Buy trades can be considered on intraday time frames from the support level of 1.1659, but only with confirmation and short targets.

Alternative scenario: if the price breaks out through the 1.1994 resistance level and fixes above, the uptrend will likely resume.

GBP/USD
There is no news feed for today.

The USD/JPY currency pair

Technical indicators of the currency pair:
  • Prev Open: 136.48
  • Prev Close: 137.52
  • % chg. over the last day: +0.76%

According to analysts, wage growth in Japan will lag behind inflation for the next 12 months. And that’s bad news for the economy. And it is one of the reasons why the Bank of Japan should keep its massive monetary stimulus and dovish policy until wages show more clear signs of growth. Thus, the Japanese yen will be under the pressure of low rates at least till the end of the year, which will contribute to the further growth of USD/JPY quotes amid the tightening of the policy by the US Fed.

Trading recommendations
  • Support levels: 136.85, 135.89, 135.35, 134.23, 133.47, 132.27, 131.08, 130.85
  • Resistance levels: 138.55

From the technical point of view, the medium-term trend on the currency pair USD/JPY is bullish. The price is trading above the moving average lines again, and the buyers’ pressure is increasing. The MACD indicator has become positive. Under such market conditions, buy trades can be searched for from the support level of 136.85, but with additional confirmation. For sell deals, it is possible to consider the resistance level of 138.55, but only with additional confirmation, as fundamentally, USD/JPY quotes are inclined to grow.

Alternative scenario: If the price fixes below 135.35, the downtrend will likely resume.

USD/JPY
There is no news feed for today.

The USD/CAD currency pair

Technical indicators of the currency pair:
  • Prev Open: 1.2927
  • Prev Close: 1.3027
  • % chg. over the last day: +0.77%

The US Energy Information Administration says oil and natural gas will remain the dominant energy sources through 2050. Although renewables will expand rapidly, 70% of the world’s energy in 2050 will still come from fossil fuels. Canada is the world’s fifth-largest producer and fourth-largest exporter of oil and natural gas. The future of Canada’s oil and gas sector is to produce them with the lowest possible greenhouse gas emissions. This takes advantage of the fact that G7 countries, including Canada and the European Union, classify natural gas as a transitional form of green energy. Thus, the Canadian dollar will be even more dependent on the dynamics of oil and natural gas prices. And that is the reason why rising energy prices, along with monetary tightening by the Bank of Canada, are keeping the Canadian dollar in line with the US dollar.

Trading recommendations
  • Support levels: 1.3036, 1.2965, 1.2943, 1.2900, 1.2858, 1.2809, 1.2761
  • Resistance levels: 1.3090, 1.3105

From the point of view of technical analysis, the trend on the USD/CAD currency pair is bullish. The price is currently trading at the resistance level, with buyer pressure temporarily prevailing. Under such market conditions, buy trades should be considered on the lower time frames from the support level of 1.3036, but only with confirmation. For sell deals, it is best to consider the resistance level of 1.3090, but only with short targets.

Alternative scenario: if the price breaks down and consolidates below the 1.2900 support level, the downtrend will likely resume.

USD/CAD
There is no news feed for today.

By JustForex


This article reflects a personal opinion and should not be interpreted as an investment advice, and/or offer, and/or a persistent request for carrying out financial transactions, and/or a guarantee, and/or a forecast of future events.


The US Federal Reserve signals that there will be no pause in rate hikes aimed at lowering inflation

By JustForex

Federal Reserve Chairman Jerome Powell signaled at a speech in Jackson Hole that the US Сentral Bank will likely continue to raise interest rates and leave them elevated for a while to suppress inflation, and rejected any idea that the Fed would change course soon. Powell added that lowering inflation to the 2% target is the Сentral Bank’s top priority right now, even though consumers and businesses will feel the economic pain. He reiterated that another unusually large increase in the benchmark lending rate might be appropriate when officials meet next month. Amid these statements, the US stock indices saw a sell-off on Friday. The Dow Jones (US30) decreased by 3.03% (-3.88% for the week). The S&P 500 (US500) fell by 3.37% (-3.28% for the week) at Friday’s close of the stock market. The NASDAQ Technology Index (US100) was down by 3.94% (-3.05% for the week).

Two-year Treasury yields rose on Powell’s statements to 3.44%. Mark Spindel, chief investment officer at MBB Capital Partners, said the strong tone of Powell’s speech points to another big 75 basis point rate hike next month.

In a new report on factors driving Canada’s provincial economies from 2022 to 2024, the nonprofit think tank says growth will come mainly from oil and gas. With regions like Saskatchewan and Alberta leading the way in that sector.

Equity markets in Europe fell mostly on Friday. German DAX (DE30) decreased by 2.26% (-3.71% for the week), French CAC 40 (FR40) lost 1.68% (-2.71% for the week), Spanish IBEX 35 (ES35) fell by 1.51% (-2.75% for the week), British FTSE 100 (UK100) was 0.70% down (-1.63% for the week).

Isabel Schnabel of the European Central Bank’s Executive Board urged policymakers to act decisively to bring stubbornly high inflation back under control and warned against backing down at the first sign that price pressures might be easing. Another ECB Governing Council spokesman, François Villrois de Galleau, said during the same discussion that policymakers must be determined to fight record inflation so as not to be forced to resort to “unnecessarily harsh” interest rate changes later on. The ECB raised rates by 50 basis points in July, and a similar move is scheduled for September 8, but some policymakers have begun talking about even more hikes as the outlook for inflation worsens.

The UK inflation hit a 40-year high of 10.1% year-over-year last month, and Citigroup Inc. said it could surpass 18% in January. According to consulting firm Baringa Partners, more than half of British households are at risk of energy poverty this winter because of soaring bills. In theory, higher rates should lead to a stronger currency. But the opposite is true for the UK right now. Investors believe that further aggressive increases in borrowing costs, necessary to reduce rising prices, will exacerbate Britain’s economic malaise, putting the country in a worse position than the US and the Eurozone.

The spot price of gas in Europe has once again hit a 5-month high. The price of the nearest TTF futures on the ICE Futures exchange reached $3456 per thousand cubic meters in September. The historical maximum for the gas price in Europe was recorded on March 7, 2022, when the April futures price was $3,898 at one point.

According to the Financial Times, EU foreign ministers are set to suspend the visa agreement with Russia as early as this week.

On Friday, OPEC+ states such as Iraq, Venezuela, and Kazakhstan expressed willingness as part of an alliance of 23 oil producers to step in and restore balance to the oil market. The word “balance” is OPEC+’s key phrase for production cuts, a situation OPEC+ considers necessary whenever oil prices are at risk of falling. But the problem with any OPEC+ production cut is that it will raise not only the price of oil but also the price of gasoline, which the Biden administration is trying hard to prevent. Thus the situation in the oil market remains uncertain. On top of that, Russia is selling its oil at a discount of $30 a barrel to Brent in order to keep its economy running under widespread sanctions and to get money for the war with Ukraine, with China and India being the main buyers of Russian oil.

Asian markets traded without a single dynamic last week. Japan’s Nikkei 225 (JP225) decreased by 0.04% over the week, Hong Kong’s Hang Seng (HK50) gained 3.05% last week, and Australia’s S&P/ASX 200 (AU200) ended the week down by 0.15%.

In China, the real estate market crisis has flared up, and sales have been falling there for several months. Because of this, developers are becoming cheaper to tear down the new building than to keep it. The authorities support the demolition by offsetting the costs. Already 2/3 of developers have gone bankrupt or are at the stage of bankruptcy. According to Citigroup, by cutting key rates in August, the People’s Bank of China (PBOC) may cut banks’ required reserves as early as next month.

In the commodities market, futures on coffee (+12.05%), wheat (+7.63%), corn (+6.23%), Brent oil (+4.01%), WTI oil (+2.8%), and sugar (+2.05%) showed the biggest gains over the week. Futures on gasoline (-5.57%), lumber (-4.85%), platinum (-4.05%), orange juice (-4.04%), and soybeans (-1.61%) showed the biggest drop.

S&P 500 (F) (US500) 4,057.66 −141.46 (−3.37%)

Dow Jones (US30) 32,283.40 −1,008.38 (−3.03%)

DAX (DE40) 12,971.47 −300.49 (−2.26%)

FTSE 100 (UK100) 7,427.31 −52.43 (−0.70%)

USD Index 108.84 +0.37 (+0.34%)

Important events for today:
  • – Australia Retail Sales (m/m) at 04:30 (GMT+3);
  • – US FOMC Member Brainard Speaks at 21:15 (GMT+3).

By JustForex


This article reflects a personal opinion and should not be interpreted as an investment advice, and/or offer, and/or a persistent request for carrying out financial transactions, and/or a guarantee, and/or a forecast of future events.

Why You Should Expect a Pickup in Stock-Market Volatility

“Traders are convinced the market volatility will remain subdued”

By Elliott Wave International

When things get quiet in a horror movie, that’s when you need to really brace yourself. The monster or the killer will soon be on the scene.

That’s a close enough analogy to what can happen in the stock market. Just when investors get comfortable with a stretch of low volatility — wham! — volatility picks up in a major way.

Back on Nov. 27, 2019, our U.S. Short Term Update, a thrice weekly Elliott Wave International publication which provides near-term forecasts for major U.S. financial markets, showed a chart titled “Calm Before the Craziness,” and said:

The CBOE volatility Index (VIX) closed below 12.00 for the third straight session… In fact, investors are so complacent that, paradoxically, it signals a coming pick up in volatility.

About three months later, our Feb. 24, 2020 U.S. Short Term Update noted:

The VIX surged 69% intraday and is now up 130% since the November 26 low. The VIX should eventually move even higher as stocks prices work lower.

As you may recall, a hair-raising stock market decline that had started in mid-February continued to plummet into March 23 of that year.

What does this have to do with today?

This chart and commentary from our August 15, 2022 U.S. Short Term Update provides the answer:

VolatilityPickup

We have inverted the scale to align the VIX with prices. The DSI Indicator (trade-futures.com) has declined to 15, the lowest reading since March 29 (DSI of 13), which coincided with [an Elliott wave high]. The VIX itself declined to 19.12 on August 12 and traders are convinced the market volatility will remain subdued. As shown by the vertical dashed lines, the prior two times that traders were equally confident that volatility will remain muted occurred at or near prior market highs.

Indeed, an August Yahoo Finance headline reflects an example of this confidence:

10 reasons to be bullish on stocks right now, according to [a strategist at the largest U.S. bank]

That strategist may turn out to be correct.

On the other hand, volatility has already picked up since our August 15 analysis published. Of course, during periods of high volatility, there’s the potential for big moves on the up- as well as downside.

Now it’s time to learn what the Elliott wave pattern of the stock market is suggesting.

If you’re new to Elliott wave analysis or need a refresher, you may want to read Elliott Wave Principle: Key to Market Behavior by Frost & Prechter. Here’s a quote from the book:

It is a thrilling experience to pinpoint a turn, and the Wave Principle is the only approach that can occasionally provide the opportunity to do so.

The ability to identify such junctures is remarkable enough, but the Wave Principle is the only method of analysis that also provides guidelines for forecasting.

You can read the entirety of this Wall Street classic for free once you become a member of Club EWI, the world’s largest Elliott wave educational community (about 500,000 worldwide members).

You can join Club EWI for free and members enjoy complimentary access to a wealth of Elliott wave resources on financial markets, investing and trading without any obligations.

Just follow this link to get started right away: Elliott Wave Principle: Key to Market Behavior – get instant access – free.

This article was syndicated by Elliott Wave International and was originally published under the headline Why You Should Expect a Pickup in Stock-Market Volatility. EWI is the world’s largest market forecasting firm. Its staff of full-time analysts led by Chartered Market Technician Robert Prechter provides 24-hour-a-day market analysis to institutional and private investors around the world.

Japanese Candlesticks Analysis 26.08.2022 (XAUUSD, NZDUSD, GBPUSD)

Article By RoboForex.com

XAUUSD, “Gold vs US Dollar”

As we can see in the H4 chart, XAUUSD has formed a Hammer reversal pattern not far from the support area. At the moment, the asset may reverse in the form of a new ascending impulse. In this case, the upside target may be at 1770.50. At the same time, the opposite scenario implies that the price may correct to reach 1745.00 first and then resume trading upwards.

GOLD
Risk Warning: the result of previous trading operations do not guarantee the same results in the future

NZDUSD, “New Zealand vs US Dollar”

As we can see in the H4 chart, during the pullback, NZDUSD has formed a Harami reversal pattern close to the resistance area. At the moment, the asset is reversing in the form of another descending impulse. In this case, the downside correctional target may be at 0.6175. After that, the asset may rebound from the support level and resume moving upwards. However, an alternative scenario implies that the price may grow to reach 0.6270 without testing the support level.

NZDUSD
Risk Warning: the result of previous trading operations do not guarantee the same results in the future

GBPUSD, “Great Britain Pound vs US Dollar”

As we can see in the H4 chart, GBPUSD has formed a Hammer reversal pattern near the support level. At the moment, the pair may reverse in the form of a new ascending impulse. In this case, the upside target may be the resistance area at 1.1885. Later, the market may rebound from this level and resume falling. Still, there might be an alternative scenario, in which the asset may continue falling to reach the support level at 1.1725 without testing the resistance area.

GBPUSD

Article By RoboForex.com

Attention!
Forecasts presented in this section only reflect the author’s private opinion and should not be considered as guidance for trading. RoboForex LP bears no responsibility for trading results based on trading recommendations described in these analytical reviews.

Murrey Math Lines 26.08.2022 (Brent, S&P 500)

Article By RoboForex.com

Brent

As we can see in the H4 chart, Brent is trading below the 200-day Moving Average, thus indicating a descending tendency. In this case, the price is expected to break 4/8 and continue moving downwards to reach the support at 3/8. However, this scenario may no longer be valid if the asset breaks 5/8 to the upside. After that, the instrument may reverse and grow to return to the resistance at 6/8.

Brent
Risk Warning: the result of previous trading operations do not guarantee the same results in the future

In the M15 chart, the pair may break the downside line of the VoltyChannel indicator and, as a result, continue its decline.

Brent
Risk Warning: the result of previous trading operations do not guarantee the same results in the future

S&P 500

As we can see in the H4 chart, after breaking the consolidation range, the S&P Index is trading below 3/8. In this case, the price is expected to test 2/8, break it, and then continue falling towards the support at 1/8. However, this scenario may no longer be valid if the asset breaks the resistance at 3/8 to the upside. After that, the instrument may reverse and grow to reach 4/8.

S&P 500
Risk Warning: the result of previous trading operations do not guarantee the same results in the future

In the M15 chart, the pair may break the downside line of the VoltyChannel indicator and, as a result, continue trading downwards to reach 1/8 from the H4 chart.

S&P 500_M15

Article By RoboForex.com

Attention!
Forecasts presented in this section only reflect the author’s private opinion and should not be considered as guidance for trading. RoboForex LP bears no responsibility for trading results based on trading recommendations described in these analytical reviews.

Week Ahead: EURUSD to fall further below parity?

By ForexTime 

Allow me to begin with an important note: this article was published before Fed Chair Jerome Powell is due to make his Jackson Hole speech later today (Friday, August 26th), which may trigger an almighty reaction across global financial markets.

Still, that shouldn’t stop us from already giving you a heads up on major economic data releases and events for the coming week:


Monday, August 29

  • AUD: Australia July retail sales
  • UK markets closed

Tuesday, August 30

  • JPY: Japan July jobless rate
  • EUR: Eurozone August economic confidence, Germany August CPI
  • USD: US August consumer confidence, New York Fed President John Williams speech

Wednesday, August 31

  • JPY: Japan July industrial production, retail sales, August consumer confidence
  • CNH: China August PMIs
  • EUR: Eurozone August CPI, Germany August unemployment
  • EUR: Russian gas flow to Europe halted for 3 days due to Nord Stream pipeline maintenance
  • CAD: Canada June/2Q GDP
  • USD: Fed speak – Cleveland Fed President Loretta Mester, Atlanta Fed President Raphael Bostic
  • US crude: EIA weekly oil inventory report

Thursday, September 1

  • AUD: Australia August manufacturing PMI
  • CNH: Caixin China August manufacturing PMI
  • EUR: Eurozone July unemployment, August manufacturing PMI (final)
  • GBP: UK August manufacturing PMI (final)
  • USD: US weekly jobless claims, ISM August manufacturing

Friday, September 2

  • USD: US August nonfarm payrolls


The euro has already been beleaguered by a confluence of economic woes, including record-high inflation, the ECB’s apparent lag behind the Fed in its own rate hikes, and a darkening economic outlook (no thanks to the war that’s still raging off its eastern borders).

All that has already combined to drag EURUSD below parity, down to levels not seen in 20 years!


And the shared currency may find little solace from the data dump due out of the Eurozone in the coming week:

  • August economic confidence (due Tuesday, Aug 30): forecasted to slip further to 97.8 compared to 99.0 in the month prior
  • August CPI (due Wednesday, Aug 31): 8.8% estimate, a slight reprieve in the year-on-year headline inflation figure from July’s 8.9% – a record high.

Even an upside surprise in the headline CPI print to a fresh record high (above 8.9%) which potentially pushes the European Central Bank into a steeper rate-hiking cycle, may not be enough to offer support for the euro currency, considering the major concerns swirling about the Eurozone economy.


Worsening energy crisis for Europe?

Also crucially, EU policymakers fear that Russian gas flows may be halted, after the Wednesday-Friday maintenance to the crucial Nord Stream pipeline is completed.

Such a drastic event would only exacerbate Europe’s energy crisis, while dragging EURUSD to lower depths!


US jobs report to have major say on EURUSD

And of course, the USD half of EURUSD will also hold tremendous sway over the world’s most popularly-traded currency pair.

And markets will be keenly awaiting the August US nonfarm payrolls report, due on September 2nd.

The median estimate in Bloomberg’s survey of economists predict a 300,000 increase in US jobs created this month. If so, that would be lower than July’s 528k print, and also the lowest number of monthly jobs created since December 2019.

However, the US unemployment rate is forecasted to remain at a five-decade low of 3.5%.

Investors and traders worldwide may still interpret the relatively lower headline NFP print as a sign that US jobs growth momentum is waning.

That may suggest that the Fed will take a more gradual approach with its rate hikes (shy away from supersized 75 basis point hikes and instead be more comfortable with 50-bps hikes or even back to the customary 25bps adjustments).

Such a narrative may translate into a softer US dollar which in turn alleviates the downward pressure on EURUSD and lift this currency pair back above parity.


EURUSD forecasted to remain below parity going into September

As things stand (again, before Powell’s speech due later today at Jackson Hole), here are some probabilities over potential EURUSD levels for you to mull over:

  • Using 2002’s price action for reference, further declines for EURUSD below its recent cycle low of 0.99 should see stronger support around the 0.96 region.
    However, markets are only pricing in a mere 1.8% chance of such a drastic drop to such lows in the week ahead (at the time of writing).
  • To the upside, the 1.0000 parity level now plays the crucial role as immediate resistance, with stronger resistance set to arrive around 1.009 (late-July cycle lows), following by EURUSD’s 50-day simple moving average around 1.02.
  • Overall, there appears to be a greater-than-even chance (58%) that EURUSD should stay below parity over the coming week.


In summary, as long as king dollar remains well bid in anticipation of more supersized Fed rate hikes, coupled with growing pessimism surrounding the Eurozone, that should heap more downward pressure on EURUSD.


Forex-Time-LogoArticle by ForexTime

ForexTime Ltd (FXTM) is an award winning international online forex broker regulated by CySEC 185/12 www.forextime.com

The Analytical Overview of the Main Currency Pairs on 2022.08.26

By JustForex

The EUR/USD currency pair

Technical indicators of the currency pair:
  • Prev Open: 0.9963
  • Prev Close: 0.9973
  • % chg. over the last day: +0.10%

The US GDP contraction in the second quarter was revised to 0.6% from 0.9%. Weekly jobless claims fell by 2,000 to 243,000. Thus the US labor market remains strong, and the economy is contracting, but not as fast as originally anticipated. All these signs give the US Federal Reserve the room to raise interest rates further aggressively.

Trading recommendations
  • Support levels: 0.9941
  • Resistance levels: 0.9996, 1.0112, 1.0146, 1.0230, 1.0286, 1.0365

From the technical point of view, the trend on the EUR/USD currency pair on the hourly time frame is bearish. In the run-up to the Fed head’s speech, volatility has decreased, and the price forms a balance. The MACD indicator has become inactive. Under such market conditions, buy trades are best to be sought on intraday time frames from the support level of 0.9941, but with confirmation. Sell trades can be considered from resistance levels of 0.9996, but only after additional confirmation, as the level has already been tested twice.

Alternative scenario: if the price breaks out of the 1.0146 resistance level and fixes above, the uptrend will likely resume.

EUR/USD
News feed for 2022.08.26:
  • – US PCE Price index (m/m) at 15:30 (GMT+3);
  • – Jackson Hole Symposium at 16:00 (GMT+3);
  • – US Fed Chair Powell Speaks at 17:00 (GMT+3);
  • – US Michigan Consumer Sentiment (m/m) at 17:00 (GMT+3).

The GBP/USD currency pair

Technical indicators of the currency pair:
  • Prev Open: 1.1791
  • Prev Close: 1.1835
  • % chg. over the last day: +0.37%

Economic observers are warning of a harsh winter in the UK as utilities prepare for an unprecedented increase in energy bills in October, followed by another increase in January. The British pound is under pressure for three main reasons: the energy crisis, the interest rate differential between the US Fed and the Bank of England, and policy uncertainty.

Trading recommendations
  • Support levels: 1.1787, 1.1659
  • Resistance levels: 1.1903, 1.2000, 1.2035, 1.2167, 1.2215, 1.2294

From the technical point of view, the trend on the GBP/USD currency pair on the hourly time frame is bearish. The price is now forming an accumulation zone. The MACD indicator has become inactive, and the sellers’ pressure has slightly decreased, but the main priority is still downward. At the moment, it is better to look for sell deals from the resistance level of 1.1903 or 1.2000, but only after the additional confirmation. Buy trades can be considered on intraday time frames from the support level of 1.1787, but only with confirmation and short targets.

Alternative scenario: if the price breaks out through the 1.2000 resistance level and fixes above, the uptrend will likely resume.

GBP/USD
There is no news feed for today.

The USD/JPY currency pair

Technical indicators of the currency pair:
  • Prev Open: 136.99
  • Prev Close: 136.50
  • % chg. over the last day: -0.36%

“Moving to tighten monetary policy when demand remains inadequate to supply will hurt Japan’s economy and be a major constraint on households and business activity,” a Bank of Japan official said yesterday. According to policymakers, although core consumer inflation is slowly accelerating due to rising energy, food, and durable goods prices, such growth is likely to dissipate by the end of the year. For this reason, the Bank of Japan continues to maintain an ultra-soft monetary policy while other central banks worldwide are raising interest rates.

Trading recommendations
  • Support levels: 135.89, 135.35, 134.23, 133.47, 132.27, 131.08, 130.85
  • Resistance levels: 137.01, 137.43, 138.25

From the technical point of view, the medium-term trend on the currency pair USD/JPY is bullish. The USD/JPY has corrected to the levels of the moving averages and is forming a balance. The MACD indicator has become inactive. Under such market conditions, buy trades can be sought from the support level of 135.89 or 135.35, but with additional confirmation. For sell deals, traders can consider the resistance level of 137.01, but only with additional confirmation, as fundamentally, USD/JPY quotes are inclined to grow.

Alternative scenario: If the price fixes below 135.35, the downtrend will likely resume.

USD/JPY
News feed for 2022.08.26:
  • – Japan Tokyo Core CPI (m/m) at 02:30 (GMT+3).

The USD/CAD currency pair

Technical indicators of the currency pair:
  • Prev Open: 1.2966
  • Prev Close: 1.2922
  • % chg. over the last day: -0.34%

Oil prices declined on Thursday due to volatile trade as investors prepare for the possible return of sanctioned Iranian oil exports to global markets and fears that rising US interest rates will dampen fuel demand. On the other hand, the prospect that the OPEC+ producer group may limit oil supplies limits the fall in oil prices. The Canadian dollar is a commodity currency, so it is highly dependent on indicators such as the dollar index as well as oil prices. Fundamentally, traders should not expect any medium-term trends in the currency pair USD/CAD.

Trading recommendations
  • Support levels: 1.2900, 1.2858, 1.2809, 1.2761
  • Resistance levels: 1.2985, 1.3016, 1.3090, 1.3105

From the point of view of technical analysis, the trend on the USD/CAD currency pair is bullish. The price is now trading at the levels of the moving averages, with the sellers’ pressure temporarily prevailing. Under such market conditions, buy trades should be considered on the lower time frames from the support level of 1.2900, but only with confirmation. For sell deals, it is better to consider the resistance level of 1.2985.

Alternative scenario: if the price breaks down and consolidates below the 1.2900 support level, the downtrend will likely resume.

USD/CAD
There is no news feed for today.

By JustForex


This article reflects a personal opinion and should not be interpreted as an investment advice, and/or offer, and/or a persistent request for carrying out financial transactions, and/or a guarantee, and/or a forecast of future events.

RoboMarkets is Recognised as the Best ECN Broker in Europe

RoboMarkets won the title of “Best ECN Broker – Europe” at the annual Global Brands Awards 2022. In the past, organisers have rewarded RoboMarkets with this nomination twice – in 2020 and 2021.

The event organiser, Global Brands Magazine, is the leading media in providing the latest and most detailed analytics and information about global brands from various segments, which demonstrate outstanding results in different business areas. Global Brands Awards are given to the most successful representatives in the spheres of finance, education, tourism, lifestyle, technology, and the car industry. The major goal is building the awareness of the most outstanding brands in their areas to reward them for their effort in achieving leading positions in the market.

Denis Golomedov, Chief Marketing Officer at RoboMarkets, says: “RoboMarkets has been named the “Best ECN Broker – Europe” for the third consecutive year, and it has become a good tradition with us. We’d like to express our profound gratitude to the jury panel and promise to do our utmost to make the list of winners next year”.

About RoboMarkets

RoboMarkets is an investment company with the CySEC license No. 191/13. RoboMarkets offers investment services in many European countries by providing traders, who work on financial market, with access to its proprietary trading platforms. More detailed information about the Company’s products and activities can be found on the official website at www.robomarkets.com.