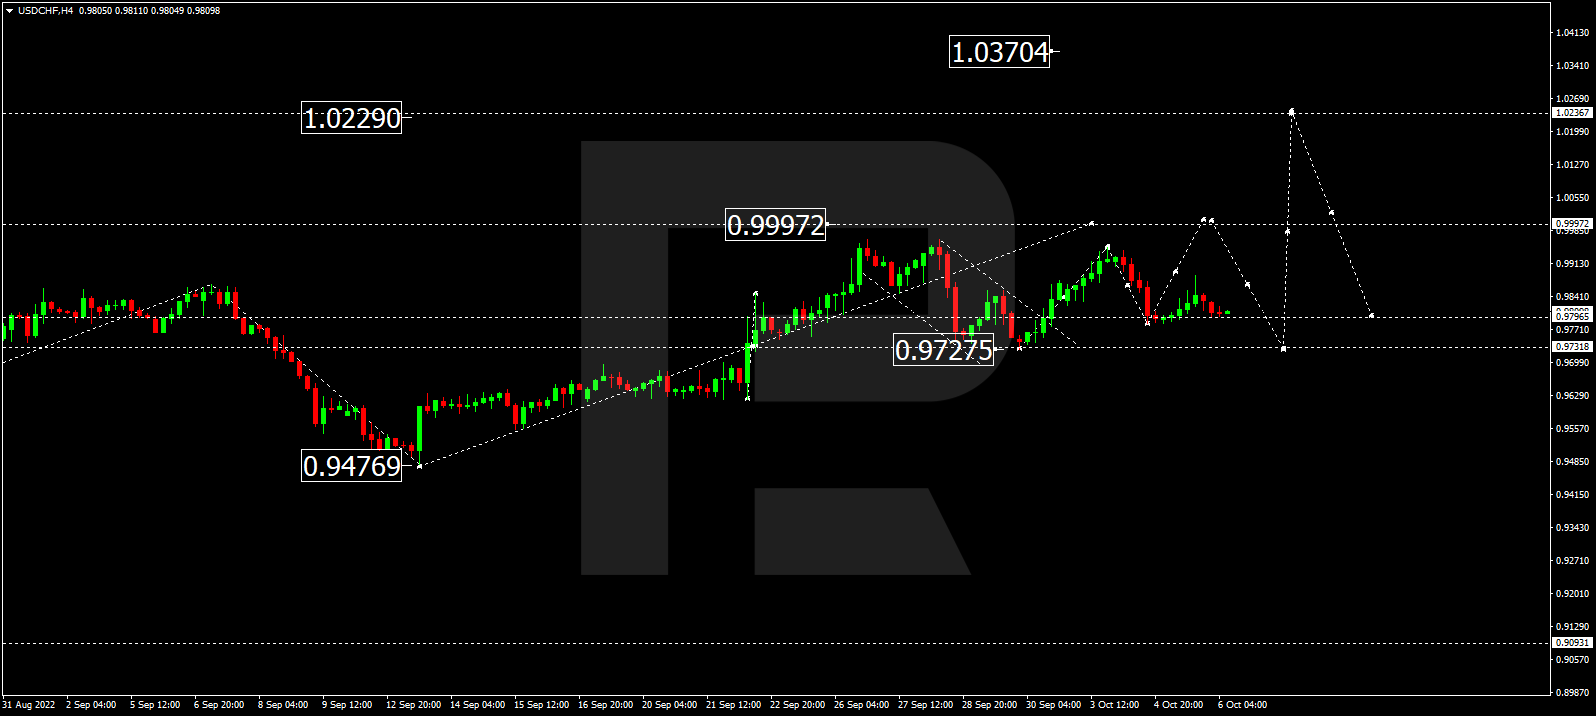
The pair is testing the upper border of the Cloud. The quotes are above the Cloud, which indicates an uptrend. A test of the lower border of the Cloud at 1.1510 is expected, followed by growth to 1.2025. One more signal confirming the growth will be a bounce off the upper border of the bearish channel. The scenario can be cancelled by a breakaway of the lower border of the Cloud and securing under 1.1445, which will mean further falling to 1.1355.
USDCAD, “US Dollar vs Canadian Dollar”
The pair is pushing off the Tenkan-Sen line, going under the Ichimoku Cloud, which means the prevalence of a downtrend. A test of the lower border of the Cloud is expected at 1.3040, followed by falling to 1.2765. An additional signal confirming the decline will be a bounce off the upper border of the descending channel. The scenario can be cancelled by a breakaway of the upper border of the Cloud and securing above 1.3175, which will entail further growth to 1.3265.
NZDUSD, “New Zealand Dollar vs US Dollar”
The pair is getting ready to break through the Cloud. The pair is going inside the Cloud, indicating a flat. A test of the lower border of the Cloud is expected at 0.6075, followed by growth to 0.6295. Growth of the pair will be signaled by a bounce off the upper border of the descending channel. The scenario can be cancelled by a breakaway of the lower border of the Cloud and securing under 0.6020, which will entail further falling to 0.5925.
Attention! Forecasts presented in this section only reflect the author’s private opinion and should not be considered as guidance for trading. RoboForex LP bears no responsibility for trading results based on trading recommendations described in these analytical reviews.
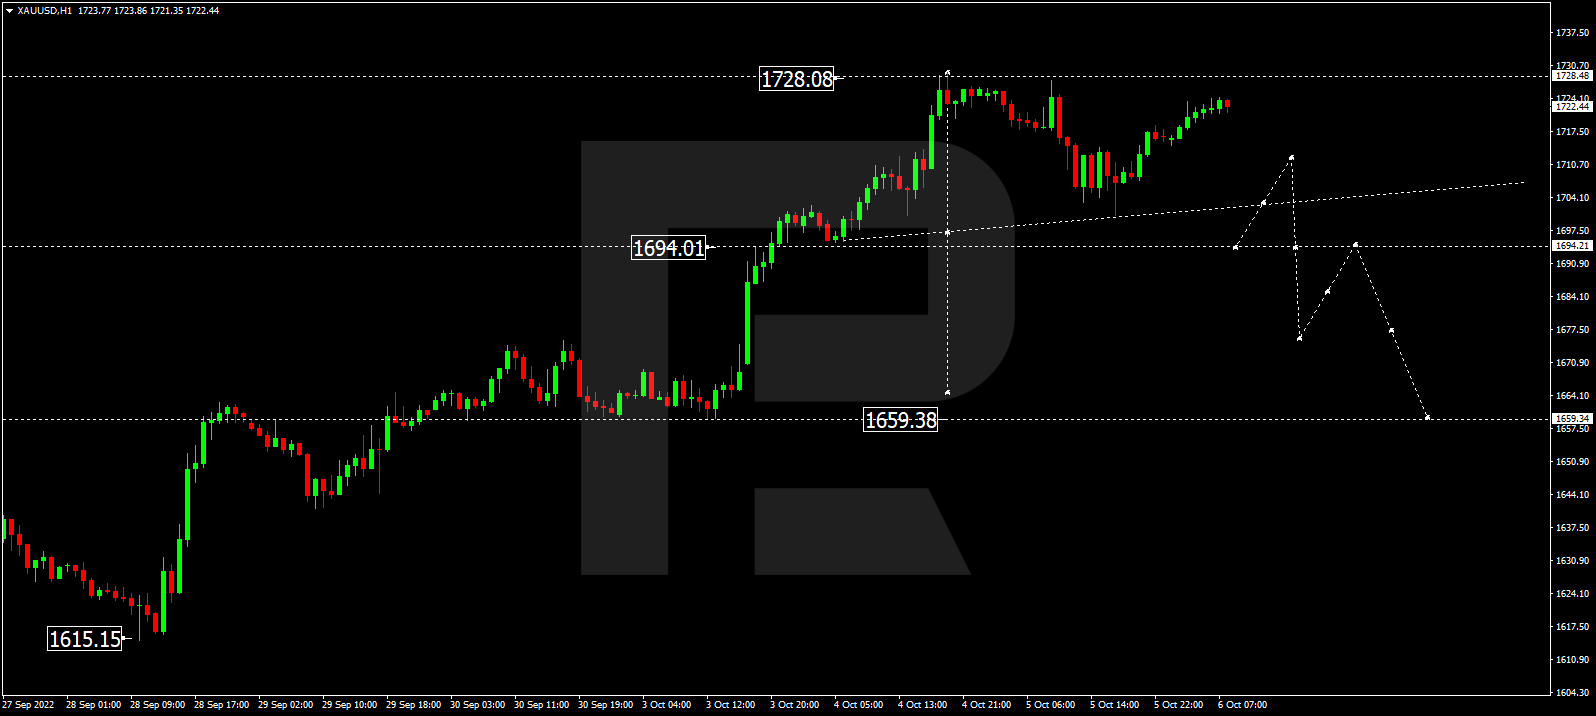
At a pullback, near the support area, gold has formed a Harami reversal pattern. The pair is going by the pattern by an ascending impulse. The goal of growth might be 1740.00. However, the quotes might fall to 1710.50 before growing.
NZDUSD, “New Zealand Dollar vs US Dollar”
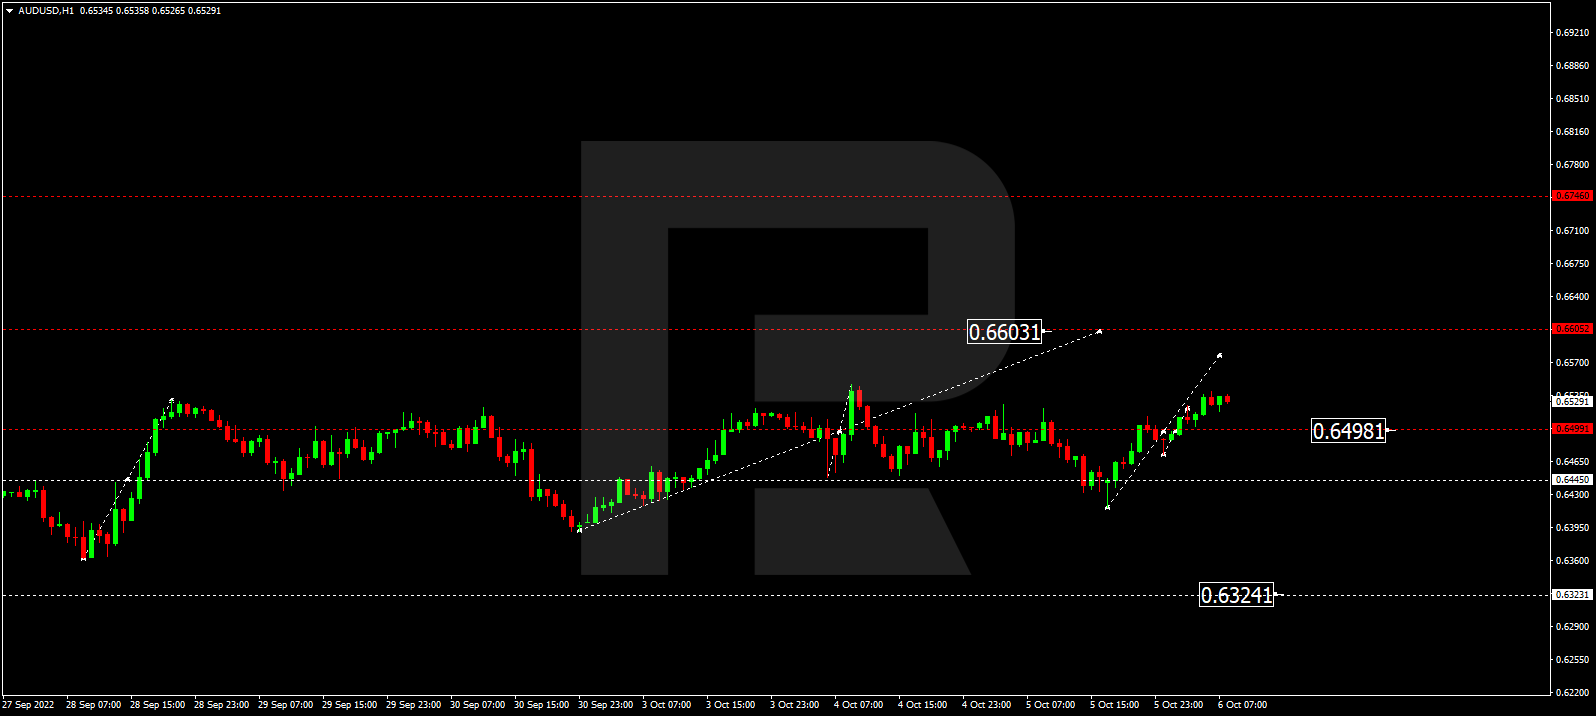
On H4 near the resistance area the pair has formed a Harami reversal pattern. Currently, going by the signal, the pair might end up in a descending impulse. The goal of the decline might be 0.5965. After a breakaway of the support level, the pair might continue the downtrend. However, the price might still grow to 0.6205 before declining.
GBPUSD, “Great Britain Pound vs US Dollar”
On H4, at the support level, the pair has formed a reversal Engulfing pattern. The pair is now going by the pattern in an ascending impulse. The goal of growth might be the resistance level at 1.1845, and if the price manages to break through it, the pair will have a chance for an uptrend. However, the price might fall to 1.1650 before growing to the resistance level.
Attention! Forecasts presented in this section only reflect the author’s private opinion and should not be considered as guidance for trading. RoboForex LP bears no responsibility for trading results based on trading recommendations described in these analytical reviews.
The European Central Bank started working on its quantitative easing (QT) program. Policymakers will potentially announce it formally at the ECB’s October meeting. There are a lot of speeches planned by ECB officials this week, so traders need to watch for new hints regarding the next steps in interest rate hikes. Special attention should be paid to the EU energy meeting. The euro rose to a three-week high against the dollar as European Central Bank officials are in favor of further aggressive tightening of monetary policy.
Trading recommendations
Support levels: 1.0111, 1.0016, 0.9971, 0.9912
Resistance levels: 1.0230
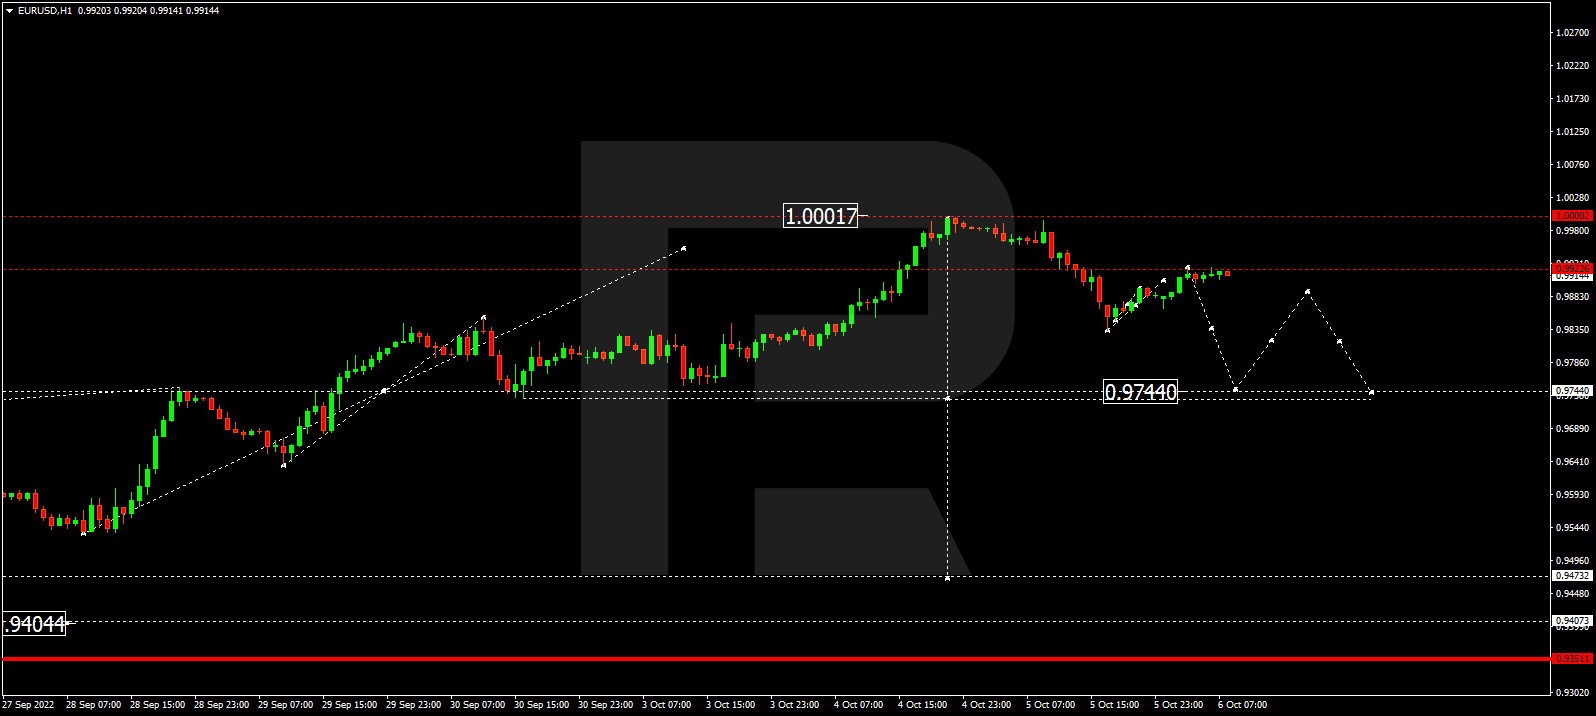
From the technical point of view, the trend on the EUR/USD currency pair on the hourly time frame has changed to bullish. The price has consolidated above the priority change level and is trading above the moving averages. The MACD indicator has become positive, but the buying pressure remains. Under such market conditions, buy trades are best sought on intraday time frames from the support level of 1.0111. Sell trades can be considered from the resistance levels of 1.0230, but only after an additional confirmation in the form of a false breakout of the level and reverse initiative.
Alternative scenario: if the price breaks down through the support level of 0.9912 and fixes below, the downtrend will likely resume.
News feed for 2022.09.013:
– Eurozone German Consumer Price Index (m/m) at 09:00 (GMT+3);
– Eurozone Spanish Consumer Price Index (m/m) at 10:00 (GMT+3);
– Eurozone German ZEW Economic Sentiment (m/m) at 12:00 (GMT+3);
– Eurozone ZEW Economic Sentiment (m/m) at 12:00 (GMT+3);
– US Consumer Price Index (m/m) at 15:30 (GMT+3).
The GBP/USD currency pair
Technical indicators of the currency pair:
Prev Open: 1.1640
Prev Close: 1.1679
% chg. over the last day: +0.33 %
UK GDP rose by 0.2% last month. At the same time, industrial production decreased by 0.3%. GDP growth is small, but it’s positive. But on the other hand, falling economic indicators are still negatively affecting the British currency. The new British government has confirmed the independence of the Bank of England but hinted that the Bank of England should not be so aggressive in tightening as it will only worsen the already large number of problems in the economy.
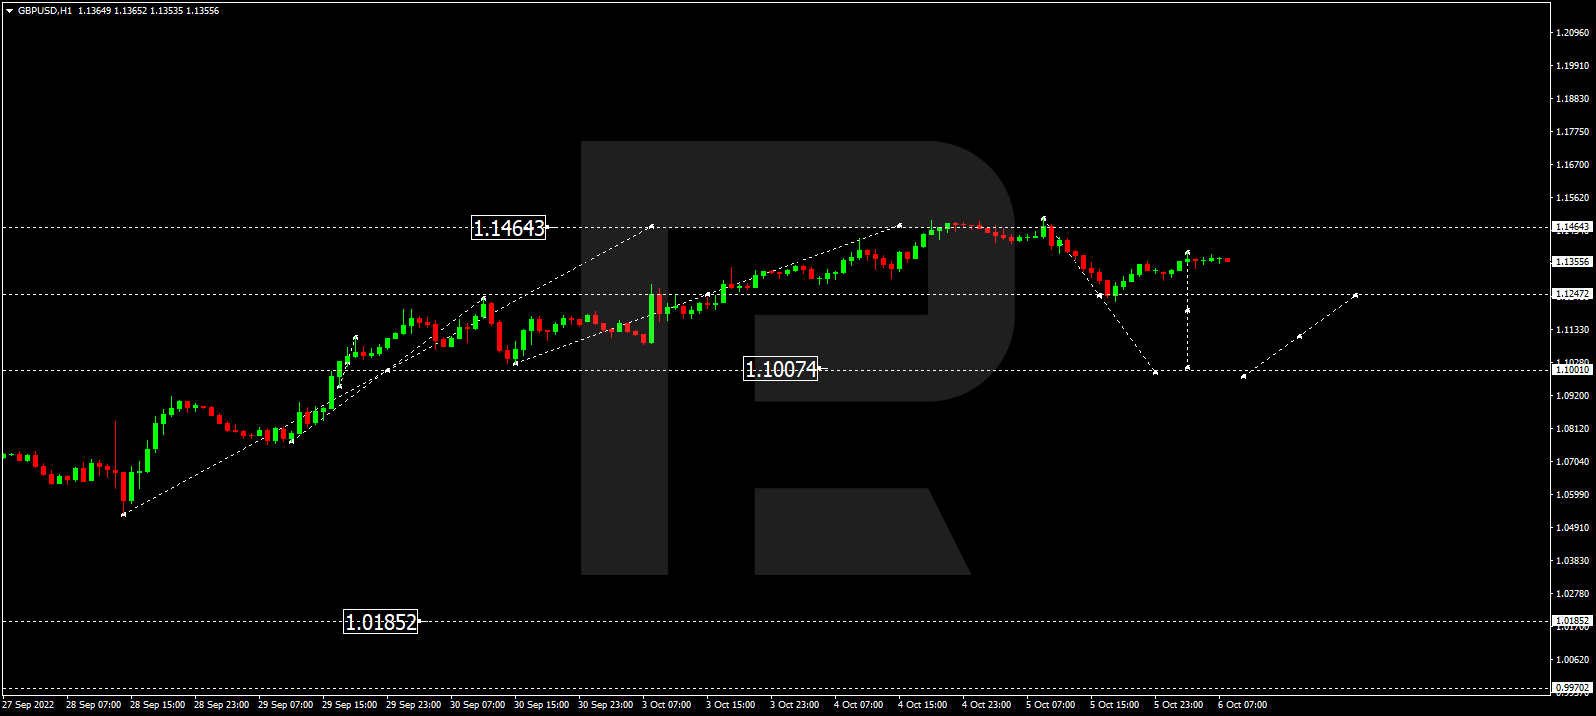
From the technical point of view, the GBP/USD currency pair trend on the hour timeframe has changed to bullish. At the moment, the price is trading above the moving averages, and the MACD indicator is in the positive zone. Buy trades can be considered from the support level of 1.1623, but only with confirmation. It is best to look for sell deals on intraday time frames, and the nearest resistance level is 1.1816.
Alternative scenario: if the price breaks down the support level of 1.1449 and fixes below it, the downtrend will likely resume.
News feed for 2022.09.013:
– UK GDP (q/q) at 09:00 (GMT+3);
– UK Average Earnings Index (m/m) at 09:00 (GMT+3);
– UK Claimant Count Change (m/m) at 09:00 (GMT+3);
– UK Unemployment Rate (m/m) at 09:00 (GMT+3).
The USD/JPY currency pair
Technical indicators of the currency pair:
Prev Open: 142.11
Prev Close: 142.82
% chg. over the last day: +0.49 %
The Japanese Finance Ministry has repeatedly and strongly expressed its dissatisfaction with the yen depreciation this year, but the Central Bank is independent and is legally obliged to monitor inflation and the economy, not the exchange rate. So the Bank of Japan will not raise interest rates or adjust its stimulus policy to support the yen. Japan’s economic weakness gives the Bank of Japan little reason to cancel monetary stimulus. The central bank intends to maintain ultra-low interest rates and a dovish policy at its meeting on September 21 and 22. When the Ministry of Finance expresses its dissatisfaction with the yen’s fall, it is said to hint that it may intervene in the market to support the currency. This is done to make traders cautious when selling the yen, a kind of verbal intervention.
Trading recommendations
Support levels: 141.77, 141.00, 139.61, 138.78, 137.65, 136.80, 135.20
Resistance levels: 144.05, 145.00
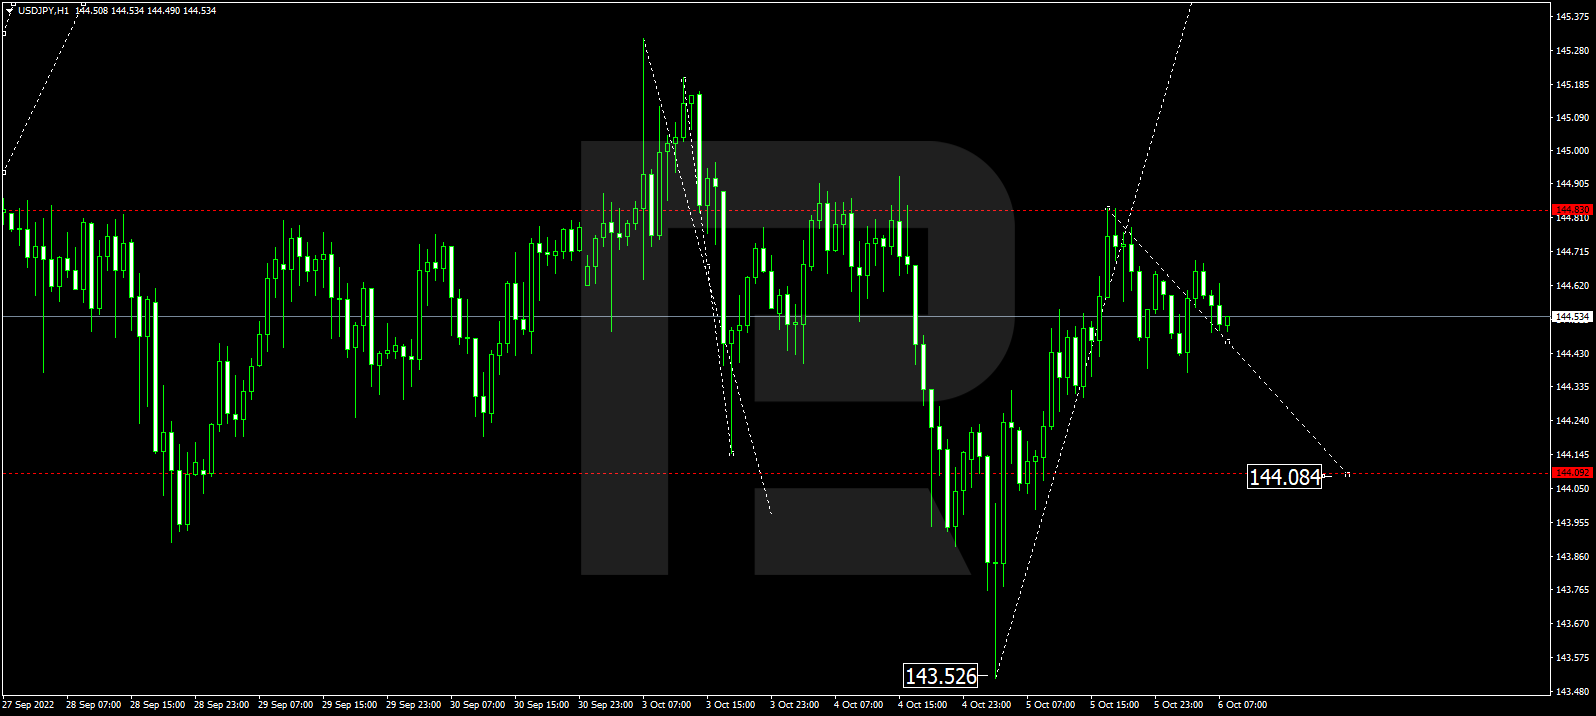
From the technical point of view, the medium-term trend on the currency pair USD/JPY is bullish. The price is trading at the level of moving averages, and a narrow balance is being formed. The MACD indicator has become inactive. Under such market conditions, buy trades can be sought from the support level of 141.77 or 141.00, but with additional confirmation. Sell positions can be searched for on the intraday time frames from the level of 144.05, but only with an additional confirmation because, fundamentally, USD/JPY quotes are inclined to grow.
Alternative scenario: If the price fixes below 141.00, the downtrend will likely resume.
There is no news feed for today.
The USD/CAD currency pair
Technical indicators of the currency pair:
Prev Open: 1.3029
Prev Close: 1.2983
% chg. over the last day: -0.35 %
The Canadian dollar continues to strengthen as the dollar index is down ahead of important US inflation data, while oil prices are rising on the back of the Iran nuclear deal being stalled again. All of these factors support the Canadian currency, which is a commodity currency. However, with new blockages in China due to falling demand, oil prices might drop in the coming days, which might negatively affect the Canadian currency.
Trading recommendations
Support levels: 1.2990, 1.2958, 1.2936, 1.2900
Resistance levels: 1.3108, 1.3220
From the point of view of technical analysis, the trend on the USD/CAD currency pair is bullish. The price is now trading below the moving averages, the MACD indicator has become negative and the price has consolidated below the priority change level. But it should be noted that at the moment, it looks like the formation of a false breakdown, as the price is consolidating below the level. Under such market conditions, buy trades should be considered on the lower time frames from the support level of 1.2990 if the price returns above the level. For sell deals, it is best to consider the resistance level of 1.3108, but only after the additional confirmation.
Alternative scenario: if the price breaks down and consolidates below the 1.2990 support level, the downtrend will likely resume.
This article reflects a personal opinion and should not be interpreted as an investment advice, and/or offer, and/or a persistent request for carrying out financial transactions, and/or a guarantee, and/or a forecast of future events.

The US stock indices rose ahead of key inflation data, which is expected to show a further cooling in consumer prices. At the close of the stock market yesterday, the Dow Jones Index (US30) increased by 0.72%, and the S&P 500 Index (US500) added 1.07%. Technology Index NASDAQ (US100) gained 1.34% on Monday.
The US will publish an important inflation report today. Analysts forecast that the consumer price index will show a decline for the second month in a row. The expectation of lower inflation has already put pressure on the US dollar in recent days.
According to the Federal Reserve Bank of New York’s monthly survey of consumer expectations released Monday, expectations for US inflation for the three years ahead fell to 2.8% in August from 3.2% the previous month and 3.6% in June. The one-year-ahead inflation forecast fell to 5.7% from 6.2%. Consumers now expect 2% inflation versus 2.3% on the five-year horizon. The US inflation expectations for gas price increases have also declined, and households now expect them to be flat one year from now. The US central banks, aiming for 2% inflation, are rapidly raising interest rates to curb the highest inflation in nearly 40 years. They are expected to hold their third consecutive 75 basis point hike when they meet next week.
Equity markets in Europe mostly rose yesterday. Germany’s DAX (DE30) gained 2.40%, France’s CAC 40 (FR40) gained 1.95%, Spain’s IBEX 35 Index (ES35) jumped by 2.01%, and Britain’s FTSE 100 (UK100) closed up 1.66%.
According to ECB Vice President Luis de Guindos, the European Central Bank’s massive interest rate hike last week was designed to keep inflation expectations anchored. The ECB followed the Federal Reserve in choosing a massive move, with some officials signaling that they are open to a repeat of this step when they next meet in October. ECB policymakers see growing risks that the central bank will have to raise its key interest rate to 2% or more to curb record Eurozone inflation.
In the oil market, the Iran nuclear deal has again stalled, pushing oil prices higher. Also, it should be noted that OPEC+ countries decided to cut oil production starting in October in order to keep oil prices from falling significantly. And all this is because from October, the “low season” begins for oil when oil prices tend to go down. Analysts at ANZ believe that the outlook for oil still looks challenging as Chinese authorities are likely to tighten restrictions ahead of the Communist Party meeting in October.
Gold and silver prices continue to rise as the dollar index, and government bond yields fall. But it should be noted that the current growth is temporary because, at the moment, there are no fundamental factors for gold and silver price growth, as the US Federal Reserve is in the cycle of tightening monetary policy.
Asian markets traded higher last week. Japan’s Nikkei 225 (JP225) gained 1.16% yesterday, Hong Kong’s Hang Seng (HK50) gained 2.69% for the day, and Australia’s S&P/ASX 200 (AU200) was up 1.02% on Monday.
Wholesale inflation in Japan reached 9% in August. Wholesale prices increased by 0.2% in August compared to the previous month.
In Australia, business confidence rose to 10 index points. The report indicates employment growth and improved trading conditions in most sectors. Only the construction sector remains problematic.
S&P 500 (F) (US500) 4,110.69 +43.33 (+1.07%)
Dow Jones (US30) 32,383.18 +231.47 (+0.72%)
DAX (DE40) 13,402.27 +314.06 (+2.40%)
FTSE 100 (UK100) 7,473.03 +121.96 (+1.66%)
USD Index 108.34 −0.67 (−0.61%)
Important events for today:
– Australia NAB Business Confidence (m/m) at 04:30 (GMT+3);
– UK Average Earnings Index (m/m) at 09:00 (GMT+3);
– UK Claimant Count Change (m/m) at 09:00 (GMT+3);
– UK Unemployment Rate (m/m) at 09:00 (GMT+3);
– Eurozone German Consumer Price Index (m/m) at 09:00 (GMT+3);
– Eurozone Spanish Consumer Price Index (m/m) at 10:00 (GMT+3);
– Eurozone German ZEW Economic Sentiment (m/m) at 12:00 (GMT+3);
– Eurozone ZEW Economic Sentiment (m/m) at 12:00 (GMT+3);
This article reflects a personal opinion and should not be interpreted as an investment advice, and/or offer, and/or a persistent request for carrying out financial transactions, and/or a guarantee, and/or a forecast of future events.

The commodity market remains extremely volatile. On Monday, a Brent barrel is declining to 91.50 USD and looks unstable. Previously, the market was afraid that Russia will cut down on supply and pushed prices upwards, but risks of stable demand have become more serious now.
This week, investors will keep an eye on the flow of inflation statistics both from the EU and the US. In the latter case, the information will help to form clearer expectations from the results of the Fed’s meeting in September.
Baker Hughes statistics, published earlier, demonstrated a decline in the number of active oil rigs in the US – by 5 units to 591 rigs.
Regardless of Brent falling on, the current movement can still be interpreted as a correction of a mighty bullish trend. The quotes are now testing the support area that used to be a strong resistance level in 2018 and 2020. It was broken away only at the beginning of this year. The price pattern is a bullish 5-0. By this pattern, after a correction the price will head for renewing the high, so in the long run, the quotes may rise to 139.00. The downtrend may start again only if the lower border of the Cloud is broken and prices secure under 70.00.
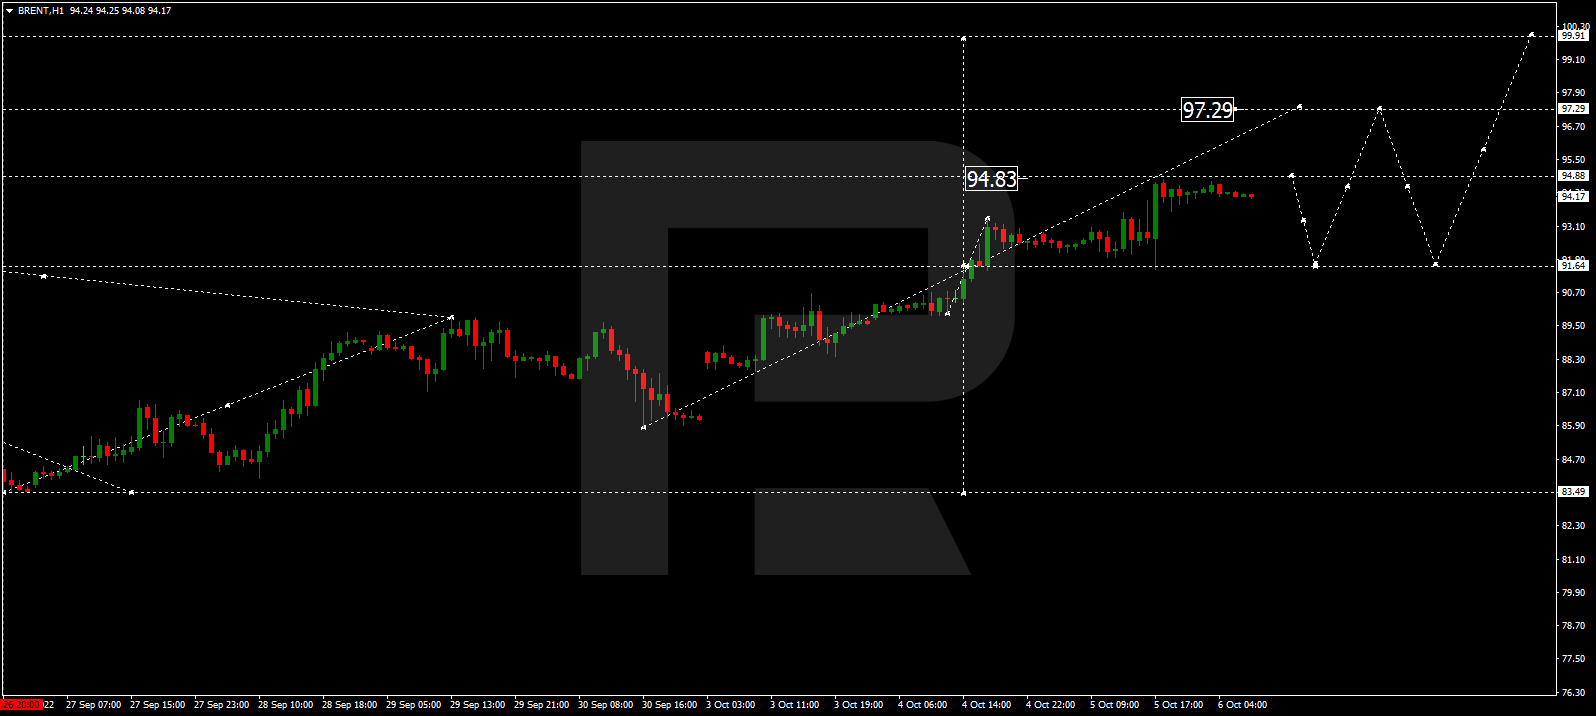
On H4, Brent has bounced off the lower border of a bullish Wolfe Wave. The goal of the movement is 105.45. A strong signal confirming the growth of the pair will be a breakaway of the upper border of the descending channel. With it, the descending movement that started at the end of August will be over. The second signal is a Double Bottom reversal pattern forming on the RSI. The indicator is already testing the upper border of the pattern, and as soon as it is broken away, they might hit 80. A negative scenario for the bulls will be another price decline and securing under 86.00, which will cancel the bullish pattern and indicate further falling.
Disclaimer
Any forecasts contained herein are based on the author’s particular opinion. This analysis may not be treated as trading advice. RoboForex bears no responsibility for trading results based on trading recommendations and reviews contained herein.
On H4, the quotes are under the 200-day Moving Average, which indicates the prevalence of a downtrend. A breakaway of 5/8 downwards is expected, followed by falling to the support level of 3/8. The scenario can be cancelled by rising over the resistance level of 6/8, which might lead to a trend reversal and growth to 7/8.
On M15, falling can be additionally supported by a breakaway of the lower border of VoltyChannel.
GBPUSD, “Great Britain Pound vs US Dollar”
On H4, the quotes are under the 200-day Moving Average, which indicates the prevalence of a downtrend. A downward breakaway of the support level of 3/8 should be expected, followed by further falling to 2/8. The scenario can be cancelled by an upward breakaway of the resistance level of 4/8. If it happens, the pair might rise to 5/8.
On M15, a breakaway of the VoltyChannel lower border will increase the probability of further price falling.
Attention! Forecasts presented in this section only reflect the author’s private opinion and should not be considered as guidance for trading. RoboForex LP bears no responsibility for trading results based on trading recommendations described in these analytical reviews.
On Monday, the BTC grew to 21,716 USD. This is good news, because previously there was little chance that digital assets would be able to recover after sales and a lengthy flat.
So, an important local resistance area in the BTC is now at 21,900-22,000 USD. The next spto is 22,500 USD. The market will remain under bearish control until it manages to secure above the mentioned levels.
This week, the market will be focused on the update of Ethereum. After The Merge update comes into power, the market will get access to the Proof-of-Stake mechanism, and mining of the ETH will become impossible in the current form.
Moreover, investors will focus on fresh inflation statistics from the US. Previously, assets and indices dropped quite a bit, so if no surprises occur, the market will be buying them back and going up. Correlation remains between the S&P 500 and Nasdaq indices and the BTC, so crypto might follow the indices.
For the first time since quite long ago, capitalisation of the crypto market has reached 1.019 trillion USD.
Google launched count-down before Ethereum update
To support the upcoming Merge update of the Ethereum network, Google launched a count-down before the event. The Merge is scheduled for 15 September. Near the timer, there is a cartoon shown about two pandas running towards each other with their paws stretched.
Association of Blockchains joined in trial of Ripple
The world’s leading association of blockchains Chamber of digital commerce is ready to speak in court against Ripple. The main accusation remains the same: XRP sales could be interpreted as offering unregistered securities, but the token as such is not a security.
Coinbase token accumulated over 1 billion USD of investments
The cbETH token of the Coinbase crypto exchange attracted over 1 billion USD of investments. The token is an inverted digital asset that yields profit on stacking.
Attention! Forecasts presented in this section only reflect the author’s private opinion and should not be considered as guidance for trading. RoboForex LP bears no responsibility for trading results based on trading recommendations described in these analytical reviews.
According to Bundesbank President Joachim Nagel, the European Central Bank will have to keep raising interest rates if the current trend in Сonsumer Prices continues. The ECB tightened policy by a historic 75 basis points last week. Officials are poised to announce another major interest rate hike at its October meeting if inflation data shows signs of growth later this week. Although there are now some signs that the economy could stagnate or even contract in the second half of 2022 and that this trend could continue into next year, Nagel said any recession could be shallow.
Trading recommendations
Support levels: 1.0016, 0.9971, 0.9912
Resistance levels: 1.0111, 1.0150
From the technical point of view, the trend on the EUR/USD currency pair on the hourly time frame is bearish, but the price is trading at the priority change level, and the probability of a trend change is very high. Technically, the price is still trading in a wide balance with a range of 0.9912-1.0111. The MACD indicator became positive, and there is buying pressure. Under such market conditions, buy trades are best sought on intraday time frames from the support level of 1.0016 or 0.9971. Sell trades can be considered from the resistance levels of 1.0111, but only after an additional confirmation in the form of a false breakout of the level and reverse initiative.
Alternative scenario: if the price breaks out of the 1.0111 resistance level and fixes above, the uptrend will likely resume.
There is no news feed for today.
The GBP/USD currency pair
Technical indicators of the currency pair:
Prev Open: 1.1497
Prev Close: 1.1587
% chg. over the last day: +0.78 %
This week the UK will publish a lot of economic data. Today traders should pay attention to GDP data. At the same time, the Bank of England postponed the interest rate decision due to the death of the Queen of Great Britain. The Central Bank said that its Monetary Policy Committee (MPC) would hold its next meeting on Thursday, a week later than planned, as Britain is observing a period of national mourning.
From the technical point of view, the trend on the GBP/USD currency pair on the hourly time frame is bearish. At the moment, the price is trading at the level of moving averages, and the MACD indicator is positive again. It is best to look for sell trades on intraday time frames, and the nearest resistance level is 1.1669. Buy trades can be considered from the support level of 1.1516, but only with confirmation.
Alternative scenario: if the price breaks out through the 1.1669 resistance level and fixes above, the uptrend will likely resume.
News feed for 2022.09.012:
– UK GDP (q/q) at 09:00 (GMT+3);
– UK Industrial Production (m/m) at 09:00 (GMT+3);
– UK Manufacturing Production (m/m) at 09:00 (GMT+3).
The USD/JPY currency pair
Technical indicators of the currency pair:
Prev Open: 144.09
Prev Close: 142.55
% chg. over the last day: -1.08 %
The Japanese yen is trading at a 24-year low against the US dollar. The Japanese government must take the necessary measures to counter the excessive yen decline, a senior government official said Sunday. These are signs of deep concern on the part of the authorities. The government is considering lifting Japan’s visitor restrictions by October. This would help boost demand for the Japanese currency.
Trading recommendations
Support levels: 141.77, 141.00, 139.61, 138.78, 137.65, 136.80, 135.20
Resistance levels: 144.05, 145.00
From the technical point of view, the medium-term trend on the currency pair USD/JPY is bullish. The price is trading at the level of moving averages. The MACD indicator has become inactive. Under such market conditions, buy trades can be sought from the support level of 141.77 or 141.00, but with additional confirmation. Sell positions can be searched for on the intraday time frames from the level of 144.05, but only with an additional confirmation because, fundamentally, USD/JPY quotes are inclined to grow.
Alternative scenario: If the price fixes below 141.00, the downtrend will likely resume.
There is no news feed for today.
The USD/CAD currency pair
Technical indicators of the currency pair:
Prev Open: 1.3092
Prev Close: 1.3020
% chg. over the last day: -0.55 %
The Canadian dollar strengthened on Friday despite a significant change in labor market dynamics. Canada reported a 39,700 job loss in August, reinforcing economists’ expectations of a recession and a slowdown in the pace of interest rate hikes by the Bank of Canada. Even with the Bank of Canada’s (BoC) earlier 75 bps interest rate hike, the narrative is shifting in favor of the US dollar, which remains supported by an aggressive Federal Reserve, a strong economy, and demand for safe-haven assets as recession fears grow. In the oil market, crude oil could face significant downward pressure as lower demand gathers momentum, which could cause the Canadian dollar to plummet.
Trading recommendations
Support levels: 1.2990, 1.2958, 1.2936, 1.2900
Resistance levels: 1.3108, 1.3220
From the point of view of technical analysis, the trend on the USD/CAD currency pair is bullish. The price is now trading below the moving averages, the MACD indicator has become negative, and there is slight seller pressure. Under such market conditions, buy trades should be considered on the lower time frames from the support level 1.2990 or 1.2936, but only with confirmation. For sell deals, it is best to consider the resistance level of 1.3108, but only after the additional confirmation.
Alternative scenario: if the price breaks down and consolidates below the 1.3020 support level, the downtrend will likely resume.
This article reflects a personal opinion and should not be interpreted as an investment advice, and/or offer, and/or a persistent request for carrying out financial transactions, and/or a guarantee, and/or a forecast of future events.
Federal Reserve officials expect another major interest rate hike this month as they rush to curb demand. Fed spokesman Chris Waller said Friday that he supports another significant 75 basis point hike. Earlier, St. Louis Fed President James Bullard said he is also leaning toward another massive move when officials meet September 20-21.
A growing number of major banks changed their forecasts this month by 75 from 50 basis points, including economists at Goldman Sachs Group Inc, Deutsche Bank AG, Barclays Plc, and Bank of America Corp.
At the close of the stock market on Friday, the Dow Jones Index (US30) increased by 1.19% (+1.09% for the week), and the S&P 500 Index (US500) added 1.53% (+1.82% for the week). Technology Index NASDAQ (US100) gained 0.27% (+4.72% for the week).
Equity markets in Europe were mostly up on Friday. German DAX (DE30) gained 1.43% (+2.03% for the week), French CAC 40 (FR40) gained 1.41% (+2.71% for the week), Spanish IBEX 35 (ES35) jumped by 1.47% (+2.95% for the week), British FTSE 100 (UK100) added 1.23% (+0.96% for the week).
Thousands of Russian troops retreated in the face of a lightning-fast Ukrainian offensive in the Kharkiv region that thwarted the Kremlin’s attempts to consolidate control over eastern Ukraine. The Institute for the Study of War, a US-based think tank, now estimates about 2,500 square kilometers liberated. In response, Russia hit critical infrastructure with missiles and temporarily left several areas without power and water. Thus, Russia once again demonstrated that it is a terrorist state.
The EU countries failed to agree on a price limit for gas from Russia. The maximum price would be expected to be $520 per thousand cubic meters. However, the EU countries failed to reach an agreement. The gas price cap is the main emergency measure called for by the European Commission’s Energy Agency to help households and businesses with rising energy bills.
On Sunday, Britain rejected as false Russian President Vladimir Putin’s claim that only a small portion of the grain exported from Ukraine in an international deal was going to poor countries. Without citing a source, Putin said Wednesday that only two of the 87 ships carrying 60,000 tons of produce went to poor countries. Citing UN data, the UK Defense Department said that about 30% of the grain exported in the deal went to low and middle-income countries in Africa, the Middle East, and Asia. Thus, Putin has once again confirmed that he is a liar. According to a daily British intelligence bulletin, Russia is employing a deliberate strategy of disinformation to deflect blame for food security problems, discredit Ukraine, and minimize opposition to its invasion.
Gold prices rose slightly on Monday, maintaining last week’s slight gains, as the dollar retreated from a 20-year high ahead of this week’s release of key US inflation data. With fuel costs now declining, inflation could see new signs of cooling. This could give gold a temporary boost.
Asian markets traded higher last week. Japan’s Nikkei 225 (JP225) gained 2.35% over the week, Hong Kong’s Hang Seng (HK50) gained 0.33% over the week, and Australia’s S&P/ASX 200 (AU200) was up by 0.96% over the week.
At the commodities market, futures on wheat (+7.52%), palladium (+7.3%), lumber (+7.05%), platinum (+6.68%), silver (+5.06%), copper (+4.15%), and corn (+2.89%) showed the biggest gains last week. Natural gas futures (-8.51%) and cocoa futures (-2.11%) showed the biggest drop.
S&P 500 (F) (US500) 4,067.36 +61.18 (+1.53%)
Dow Jones (US30) 32,151.71 +377.19 (+1.19%)
DAX (DE40) 13,088.21 +183.89 (+1.43%)
FTSE 100 (UK100) 7,351.07 +89.01 (+1.23%)
USD Index 108.97 −0.73 (−0.67%)
Important events for today:
– UK GDP (q/q) at 09:00 (GMT+3);
– UK Industrial Production (m/m) at 09:00 (GMT+3);
– UK Manufacturing Production (m/m) at 09:00 (GMT+3).
This article reflects a personal opinion and should not be interpreted as an investment advice, and/or offer, and/or a persistent request for carrying out financial transactions, and/or a guarantee, and/or a forecast of future events.

With recent advances in artificial intelligence and robotics technology, there is growing interest in developing and marketing household robots capable of handling a variety of domestic chores.
Tesla is building a humanoid robot, which, according to CEO Elon Musk, could be used for cooking meals and helping elderly people. Amazon recently acquired iRobot, a prominent robotic vacuum manufacturer, and has been investing heavily in the technology through the Amazon Robotics program to expand robotics technology to the consumer market. In May 2022, Dyson, a company renowned for its power vacuum cleaners, announced that it plans to build the U.K.’s largest robotics center devoted to developing household robots that carry out daily domestic tasks in residential spaces.
Despite the growing interest, would-be customers may have to wait awhile for those robots to come on the market. While devices such as smart thermostats and security systems are widely used in homes today, the commercial use of household robots is still in its infancy.
As a robotics researcher, I know firsthand how household robots are considerably more difficult to build than smart digital devices or industrial robots.
Robots that can handle a variety of domestic chores are an age-old staple of science fiction.
Handling objects
One major difference between digital and robotic devices is that household robots need to manipulate objects through physical contact to carry out their tasks. They have to carry the plates, move the chairs and pick up dirty laundry and place it in the washer. These operations require the robot to be able to handle fragile, soft and sometimes heavy objects with irregular shapes.
The state-of-the-art AI and machine learning algorithms perform well in simulated environments. But contact with objects in the real world often trips them up. This happens because physical contact is often difficult to model and even harder to control. While a human can easily perform these tasks, there exist significant technical hurdles for household robots to reach human-level ability to handle objects.
Robots have difficulty in two aspects of manipulating objects: control and sensing. Many pick-and-place robot manipulators like those on assembly lines are equipped with a simple gripper or specialized tools dedicated only to certain tasks like grasping and carrying a particular part. They often struggle to manipulate objects with irregular shapes or elastic materials, especially because they lack the efficient force, or haptic, feedback humans are naturally endowed with. Building a general-purpose robot hand with flexible fingers is still technically challenging and expensive.
It is also worth mentioning that traditional robot manipulators require a stable platform to operate accurately, but the accuracy drops considerably when using them with platforms that move around, particularly on a variety of surfaces. Coordinating locomotion and manipulation in a mobile robot is an open problem in the robotics community that needs to be addressed before broadly capable household robots can make it onto the market.
A sophisticated robotic kitchen is already on the market, but it operates in a highly structured environment, meaning all of the objects it interacts with – cookware, food containers, appliances – are where it expects them to be, and there are no pesky humans to get in the way.
They like structure
In an assembly line or a warehouse, the environment and sequence of tasks are strictly organized. This allows engineers to preprogram the robot’s movements or use simple methods like QR codes to locate objects or target locations. However, household items are often disorganized and placed randomly.
Home robots must deal with many uncertainties in their workspaces. The robot must first locate and identify the target item among many others. Quite often it also requires clearing or avoiding other obstacles in the workspace to be able to reach the item and perform given tasks. This requires the robot to have an excellent perception system, efficient navigation skills, and powerful and accurate manipulation capability.
For example, users of robot vacuums know they must remove all small furniture and other obstacles such as cables from the floor, because even the best robot vacuum cannot clear them by itself. Even more challenging, the robot has to operate in the presence of moving obstacles when people and pets walk within close range.
Keeping it simple
While they appear straightforward for humans, many household tasks are too complex for robots. Industrial robots are excellent for repetitive operations in which the robot motion can be preprogrammed. But household tasks are often unique to the situation and could be full of surprises that require the robot to constantly make decisions and change its route in order to perform the tasks.
Think about cooking or cleaning dishes. In the course of a few minutes of cooking, you might grasp a sauté pan, a spatula, a stove knob, a refrigerator door handle, an egg and a bottle of cooking oil. To wash a pan, you typically hold and move it with one hand while scrubbing with the other, and ensure that all cooked-on food residue is removed and then all soap is rinsed off.
There has been significant development in recent years using machine learning to train robots to make intelligent decisions when picking and placing different objects, meaning grasping and moving objects from one spot to another. However, to be able to train robots to master all different types of kitchen tools and household appliances would be another level of difficulty even for the best learning algorithms.
Not to mention that people’s homes often have stairs, narrow passageways and high shelves. Those hard-to-reach spaces limit the use of today’s mobile robots, which tend to use wheels or four legs. Humanoid robots, which would more closely match the environments humans build and organize for themselves, have yet to be reliably used outside of lab settings.
A solution to task complexity is to build special-purpose robots, such as robot vacuum cleaners or kitchen robots. Many different types of such devices are likely to be developed in the near future. However, I believe that general-purpose home robots are still a long way off.