Archive for Financial News – Page 290

The Analytical Overview of the Main Currency Pairs on 2022.09.21

By JustForex

The EUR/USD currency pair

Technical indicators of the currency pair:
  • Prev Open: 1.0020
  • Prev Close: 0.9967
  • % chg. over the last day: -0.53 %

In her speech yesterday, ECB head Christine Lagarde said that inflation in the Eurozone has been stronger than previously forecast. The main reasons for that are the pandemic and Russia’s invasion of Ukraine. The ECB will continue to pursue a strategy of monetary policy normalization. Normalization implies stopping net asset purchases and raising rates to a neutral level, i.e., a level that is neither stimulative nor restrictive. Thus, the ECB will continue to raise interest rates over the next few meetings.

Trading recommendations
  • Support levels: 0.9912
  • Resistance levels: 1.0148, 1.0111, 1.0162, 1.0230

From the technical point of view, the trend on the EUR/USD currency pair on the hourly time frame is bullish. But now, ahead of the Fed meeting, the price is forming a balance, gaining liquidity before an impulse move. The MACD indicator has become negative again. Buy trades can be considered from the level of 0.9912. Sell deals are best to look for from resistance levels of 1.0111 or 1.0162.

Alternative scenario: if the price breaks down through the support level of 0.9912 and fixes below, the downtrend will likely resume.

EUR/USD
News feed for 2022.09.21:
  • – US Existing Home Sales (m/m) at 17:00 (GMT+3);
  • – US Fed Interest Rate Decision at 21:00 (GMT+3);
  • – US FOMC Statement at 21:00 (GMT+3);
  • – US FOMC Economic Projections at 21:00 (GMT+3);
  • – US FOMC Press Conference at 21:30 (GMT+3).

The GBP/USD currency pair

Technical indicators of the currency pair:
  • Prev Open: 1.1411
  • Prev Close: 1.1379
  • % chg. over the last day: -0.28 %

According to analysts, the Bank of England has not yet determined the size of the interest rate hike this week. The situation is complicated by the government’s recently announced energy price guarantee. This will limit households’ energy bills for the next two years and probably significantly reduce short-term inflation forecasts while likely boosting inflation in the medium term. A 50 basis point increase would bring the bank rate to 2.25%. That said, only one bank representative favors a 25 basis point increase. This week’s meeting will also decide on a balance sheet reduction. The bank intends to sell 10 billion pounds each quarter to reduce the balance sheet by 80 billion pounds a year. However, the sales will depend on economic and market conditions.

Trading recommendations
  • Support levels: 1.1351, 1.1300
  • Resistance levels: 1.1449, 1.1626, 1.1693, 1.1816, 1.1901, 1.1994, 1.2035, 1.2167

From the technical point of view, the GBP/USD currency pair trend on the hourly time frame has changed to bearish. The price is currently trading at the level of the moving averages and forming a balance. The MACD indicator is in the negative zone, with sellers’ pressure. The price may be forming a false breakdown zone now, which can be used as a support if the price again consolidates above the level of 1.1449. Sell trades are better in the intraday time frames, and the nearest resistance level is 1.1626.

Alternative scenario: if the price breaks out of the 1.1693 resistance level and fixes above it, the uptrend will likely resume.

GBP/USD
News feed for 2022.09.21:
  • – US Fed Interest Rate Decision at 21:00 (GMT+3);
  • – US FOMC Statement at 21:00 (GMT+3);
  • – US FOMC Economic Projections at 21:00 (GMT+3);
  • – US FOMC Press Conference at 21:30 (GMT+3).

The USD/JPY currency pair

Technical indicators of the currency pair:
  • Prev Open: 143.19
  • Prev Close: 143.70
  • % chg. over the last day: +0.35 %

The yen has temporarily strengthened recently due to news that the Bank of Japan has conducted a currency “check,” a move seen as a precursor to official intervention. Bank of Japan Governor Kuroda said that intervention was “on the table” and, if necessary, it would be carried out quickly and without warning. Meanwhile, Japanese Finance Minister Shunichi Suzuki said that the Bank of Japan would appropriately guide policy, considering prices and the state of the economy. He confirmed that reserve funds would be used for core output and price increases, hinting that additional support measures, rather than currency intervention, may be introduced. Analysts believe that the Bank of Japan (BOJ) is unlikely to change its policy before the end of the year.

Trading recommendations
  • Support levels: 142.57, 141.77, 141.00, 139.61, 138.78, 137.65, 136.80, 135.20
  • Resistance levels: 144.21, 145.00

From the technical point of view, the medium-term trend on the currency pair USD/JPY is bullish. The price is trading at the level of the moving averages and forming a balance. The MACD indicator has become positive, and there is a slight buying pressure. Under such market conditions, buy trades can be sought from the support level of 142.57 or 142.10, but with additional confirmation. Sell deals can be searched for on intraday time frames from the resistance level of 144.21 or 145.00, but only with additional confirmation, as fundamentally, USD/JPY quotes are inclined to grow.

Alternative scenario: If the price fixes below 141.00, the downtrend will likely resume.

USD/JPY
News feed for 2022.09.21:
  • – US Fed Interest Rate Decision at 21:00 (GMT+3);
  • – US FOMC Statement at 21:00 (GMT+3);
  • – US FOMC Economic Projections at 21:00 (GMT+3);
  • – US FOMC Press Conference at 21:30 (GMT+3).

The USD/CAD currency pair

Technical indicators of the currency pair:
  • Prev Open: 1.3248
  • Prev Close: 1.3366
  • % chg. over the last day: +0.89 %

Canada has seen a decline in inflation indicators. For example, the annual consumer price index declined from 7.6% to 7.0%. Core inflation (which excludes food and energy prices) also declined from 6.1% to 5.8% in annual terms. This is the second month in a row that Canada has seen a decrease in annualized inflation, indicating a slowdown. However, it should be noted that the Bank of Canada currently keeps the interest rate at 3.25%, the highest among the major economies. Analysts think that the drop in inflation will cool down the aggression of the Bank of Canada, and its next steps will either be the minimum or the central bank will take a break. Against the backdrop, the Canadian dollar is losing ground against the dollar, as the US Fed is going to raise its interest rate again today.

Trading recommendations
  • Support levels: 1.3298, 1.3212, 1.3053, 1.2990, 1.2958, 1.2936, 1.2900
  • Resistance levels: 1.3390

From the point of view of technical analysis, the trend on the USD/CAD currency pair is bullish. The MACD indicator has become inactive, there is buying pressure, but the divergence is increasing. Under such market conditions, buy trades should be considered on the lower time frames from the support level of 1.3298 or 1.3212. For sell deals, it is better to consider the resistance level of 1.3390, but only after an additional confirmation in the form of a false breakout.

Alternative scenario: if the price breaks down and consolidates below the 1.2990 support level, the downtrend will likely resume.

USD/CAD
News feed for 2022.09.21:
  • – US Crude Oil Reserves (w/w) at 17:30 (GMT+3);
  • – US Fed Interest Rate Decision at 21:00 (GMT+3);
  • – US FOMC Statement at 21:00 (GMT+3);
  • – US FOMC Economic Projections at 21:00 (GMT+3);
  • – US FOMC Press Conference at 21:30 (GMT+3).

By JustForex


This article reflects a personal opinion and should not be interpreted as an investment advice, and/or offer, and/or a persistent request for carrying out financial transactions, and/or a guarantee, and/or a forecast of future events.

The main focus for investors today is the US Federal Reserve’s interest rate meeting

By JustForex

The US indices fell on Tuesday as investors raised their bearish rates over fears that the Federal Reserve might signal a continuation of aggressive rate hikes. The Fed’s willingness to continue tightening monetary policy brings the economic recession closer. The bond market continues to signal the risk of a broader recession as the continued inversion in the key part of the Treasury yield curve has intensified further. As the stock market closed on Tuesday, the Dow Jones Index (US30) decreased by 1.01%, and the S&P 500 Index (US500) lost 1.13%. The NASDAQ Technology Index (US100) fell by 2.52% yesterday.

The Fed has an important monetary policy meeting today. Analysts expect the US Federal Reserve to raise interest rates by 0.75% for the third time in a row. If the data is worse than expected and the Fed raises the rate by 1%, the dollar index may see upward momentum. If, on the contrary, the Fed raises interest rates by 0.5%, the dollar index is likely to fall sharply as the Fed is less aggressive. If the fact is as expected, there is a high probability that the market will just temporarily increase volatility.

ECB head Christine Lagarde said yesterday that Europe is experiencing a record-high inflation rate for the tenth month in a row, and this streak will continue soon. When inflation is high, monetary policy cannot remain expansionary. That is why the ECB is pursuing a strategy of monetary policy normalization. Normalization involves stopping net asset purchases and then raising rates to a neutral level that is neither stimulative nor restrictive. This is why the ECB has not only begun to raise interest rates but has indicated that it expects to raise interest rates further over the next few meetings. The ECB will reconsider whether the normalization strategy is enough to return to 2% inflation in the medium term.

The Netherlands imposed price caps on gas and electricity on January 1.

Oil falls ahead of the Fed’s interest rate decision. The dollar rose for the third time in four sessions, adding weight to oil prices as industry analysts forecast a third consecutive weekly increase in domestic crude inventories.

Gold prices are stuck at $1,600 a dollar, falling for the fifth time in six days. The rise in the dollar index is the main catalyst for gold’s weakness. Gold has lost about 4% in the last six sessions. Gold and silver could fall sharply if Powell can convince markets today not only that they will continue to aggressively tighten policy but that they will keep rates in place even as the economic downturn worsens.

Putin has announced a partial military mobilization in Russia. The Kremlin is still not calming down and has once again begun to intimidate Ukraine and the West with nuclear weapons.

Asian markets traded lower yesterday. Japan’s Nikkei 225 (JP225) gained 0.44%, Hong Kong’s Hang Seng (HK50) added 1.16% on Tuesday, while Australia’s S&P/ASX 200 (AU200) was up by 1.29% on the day.

China kept its benchmark lending rates on hold on Tuesday, as expected, as authorities postponed immediate monetary policy easing after a sharp drop in the local currency. The benchmark one-year lending rate (LPR) was kept at 3.65%, while the five-year LPR remained unchanged at 4.30%. Analysts believe that the growing divergence in the US and Chinese monetary policy could heighten fears of capital flight from China as Beijing seeks to mobilize resources to restore sluggish growth.

S&P 500 (F) (US500) 3,855.93  −43.96  (−1.13%)

Dow Jones (US30) 30,706.23 −313.45 (−1.01%)

DAX (DE40) 12,670.83  −132.41 (−1.03%)

FTSE 100 (UK100) 7,192.66 −44.02 (−0.61%)

USD Index 110.15 +0.41 (+0.38%)

Important events for today:
  • – US Existing Home Sales (m/m) at 17:00 (GMT+3);
  • – US Crude Oil Reserves (w/w) at 17:30 (GMT+3);
  • – US Fed Interest Rate Decision at 21:00 (GMT+3);
  • – US FOMC Statement at 21:00 (GMT+3);
  • – US FOMC Economic Projections at 21:00 (GMT+3);
  • – US FOMC Press Conference at 21:30 (GMT+3).

By JustForex


This article reflects a personal opinion and should not be interpreted as an investment advice, and/or offer, and/or a persistent request for carrying out financial transactions, and/or a guarantee, and/or a forecast of future events.

Forex Technical Analysis & Forecast 20.09.2022

Article By RoboForex.com

EURUSD, “Euro vs US Dollar”

EURUSD is still consolidating around 0.9992; it has already expanded the range up to 1.0049 and is currently falling to return to 0.9992. If later the price breaks this range to the downside, the market may form a new descending wave to reach 0.9800; if to the upside – resume trading upwards with the target at 1.0200.

EURUSD
Risk Warning: the result of previous trading operations do not guarantee the same results in the future

GBPUSD, “Great Britain Pound vs US Dollar”

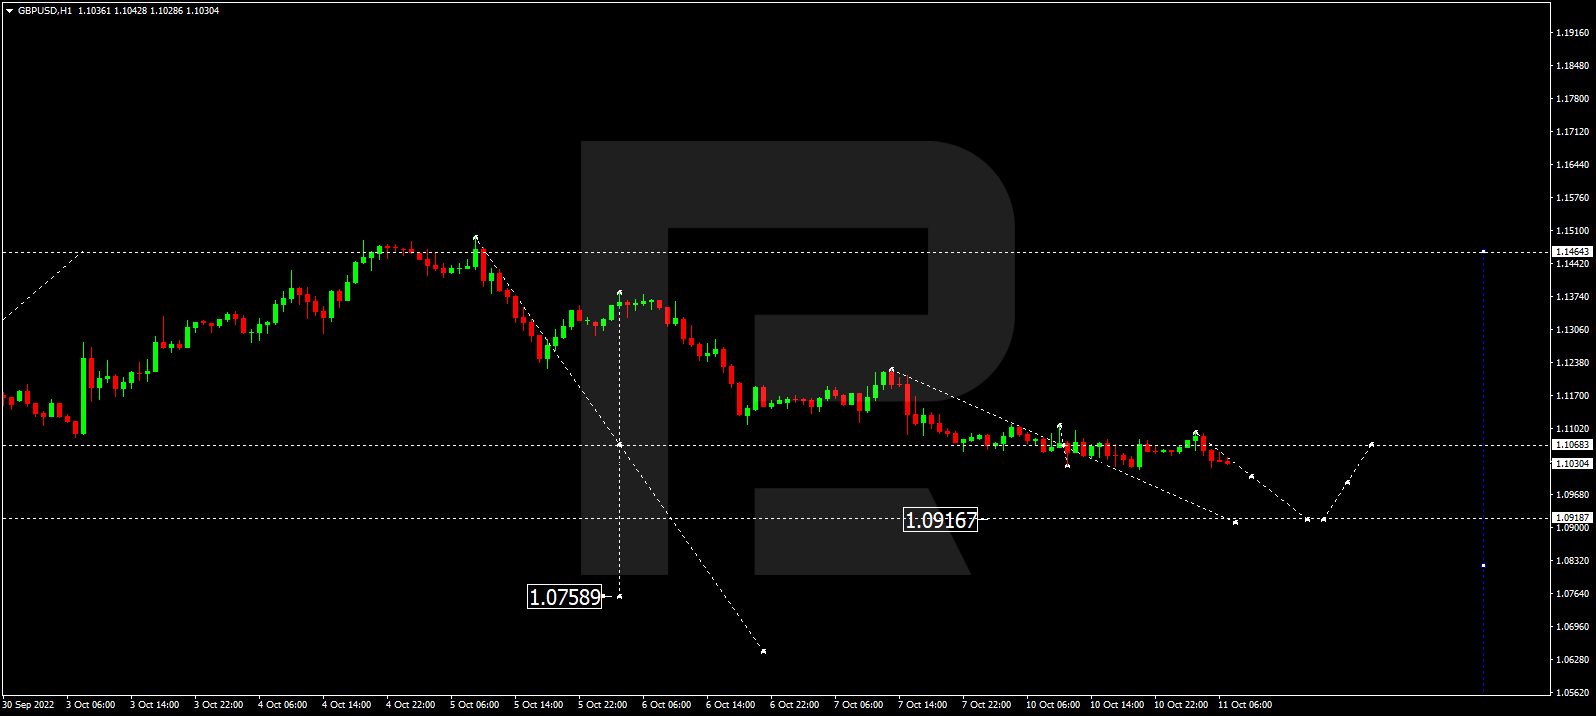
GBPUSD continues growing towards 1.1472 and may later start another decline to reach 1.1380. If later the price breaks this range to the downside, the market may resume trading downwards to reach 1.1212; if to the upside – form one more ascending wave with the target at 1.1550.

GBPUSD
Risk Warning: the result of previous trading operations do not guarantee the same results in the future

USDJPY, “US Dollar vs Japanese Yen”

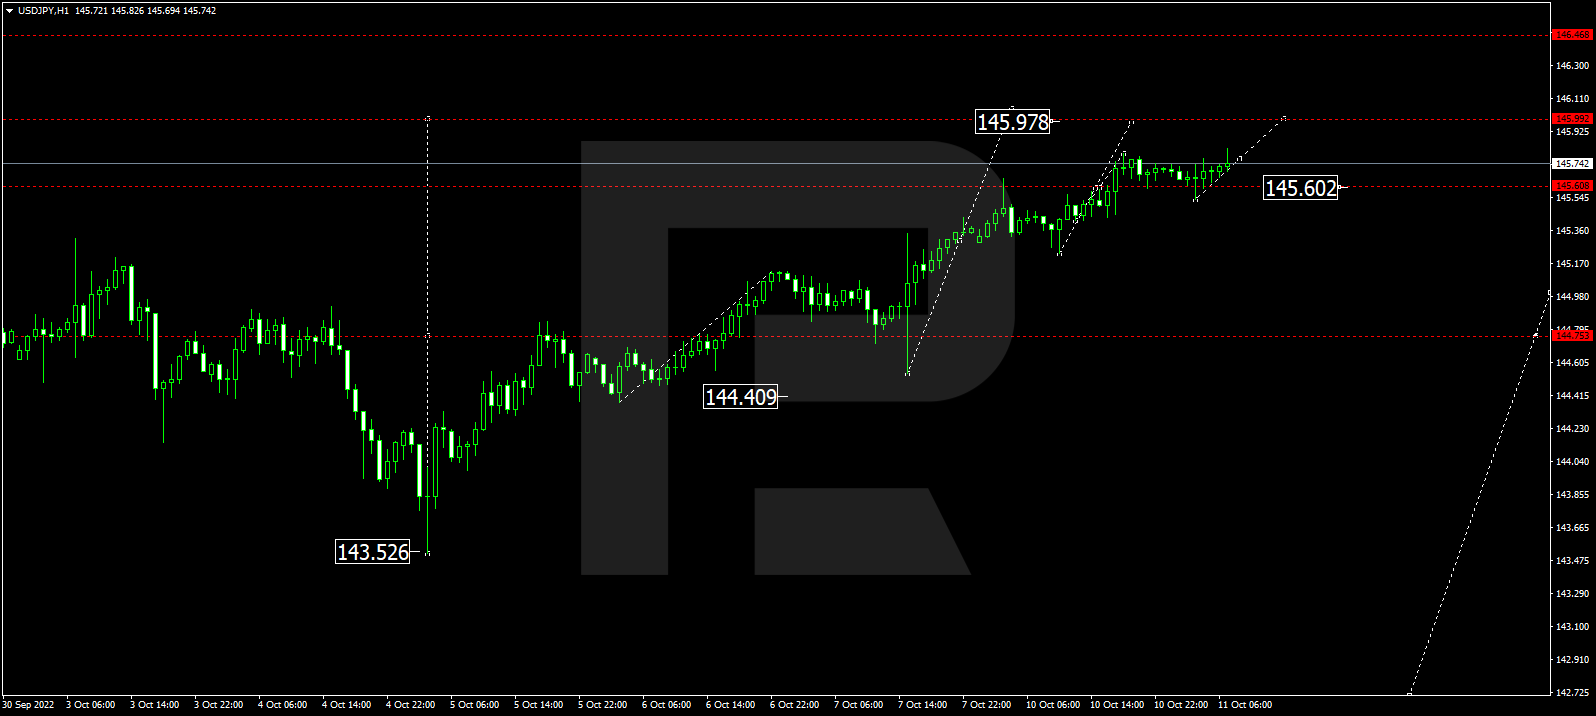
USDJPY is still consolidating around 143.25 without any specific direction. Possibly, today the pair may expand the range up to 144.00 and then fall to return to 143.25. If later the price breaks this range to the upside, the market may form one more ascending wave to reach 144.99; if to the downside – resume trading downwards to break 141.99 and then continue falling with the target at 140.99.

USDJPY
Risk Warning: the result of previous trading operations do not guarantee the same results in the future

USDCHF, “US Dollar vs Swiss Franc”

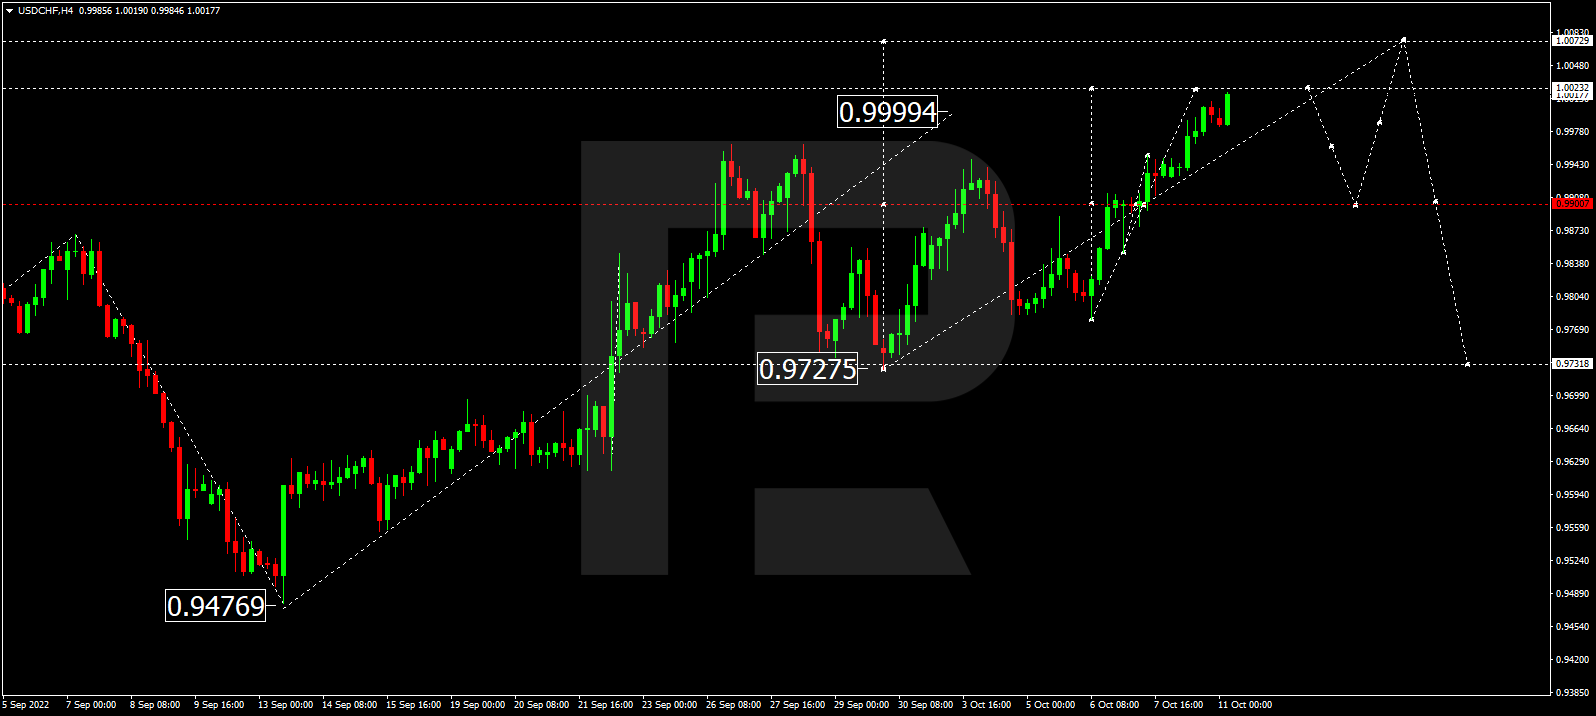
After finishing the ascending wave at 0.9694 along with the correction down to 0.9630, USDCHF is expected to resume trading upwards with the short-term target at 0.9713.

USDCHF
Risk Warning: the result of previous trading operations do not guarantee the same results in the future

AUDUSD, “Australian Dollar vs US Dollar”

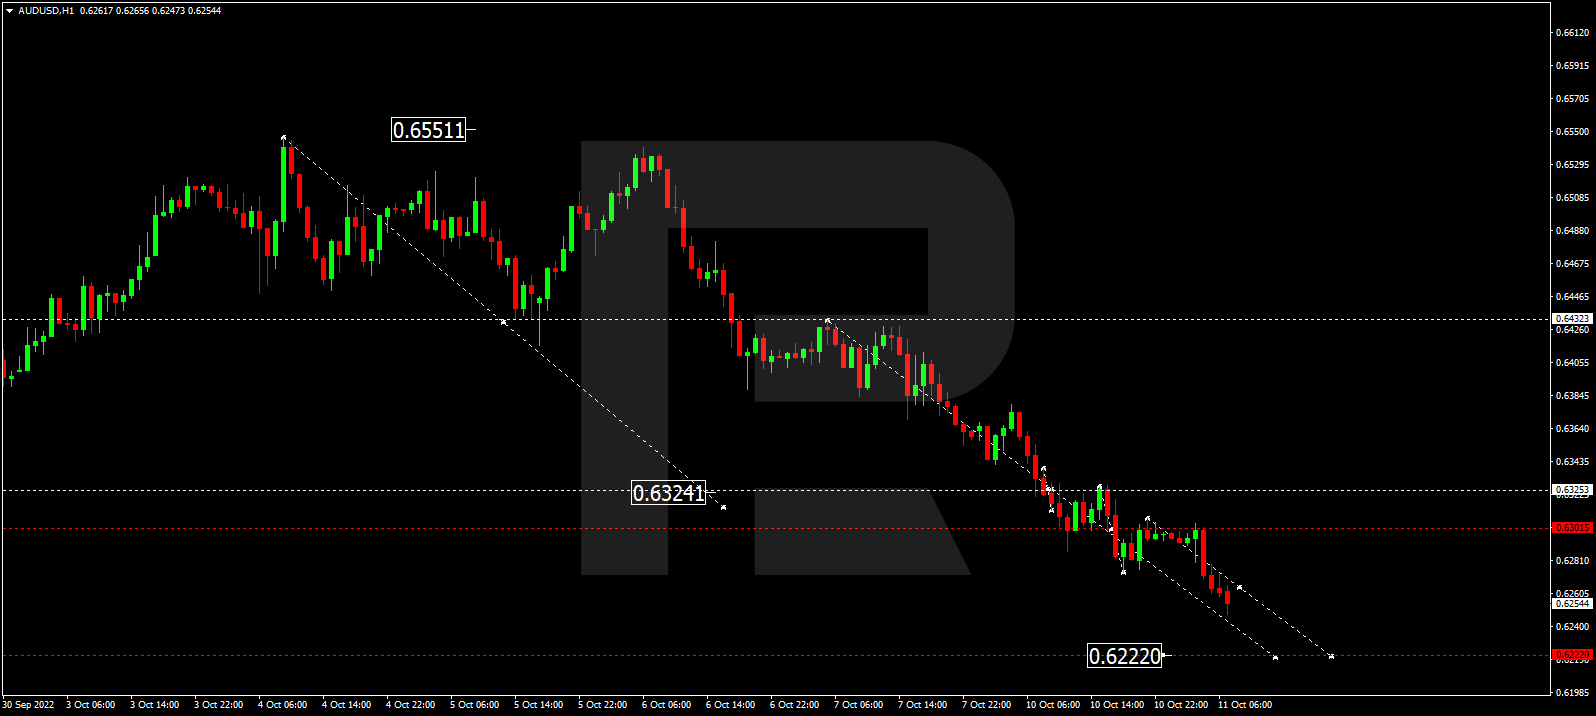
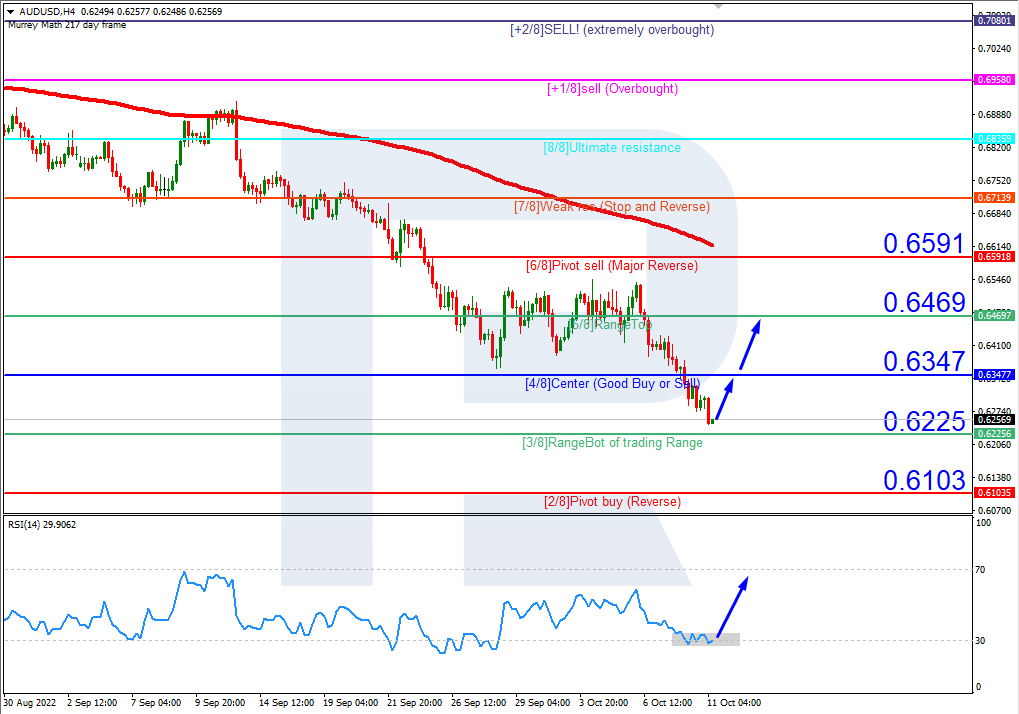
AUDUSD has completed the ascending wave at 0.6740; right now, it is falling towards 0.6690. If later the price breaks this range to the downside, the market may form a new descending wave to reach 0.6600; if to the upside – resume trading upwards with the target at 0.6800 and then start another decline towards 0.6525.

AUDUSD
Risk Warning: the result of previous trading operations do not guarantee the same results in the future

BRENT

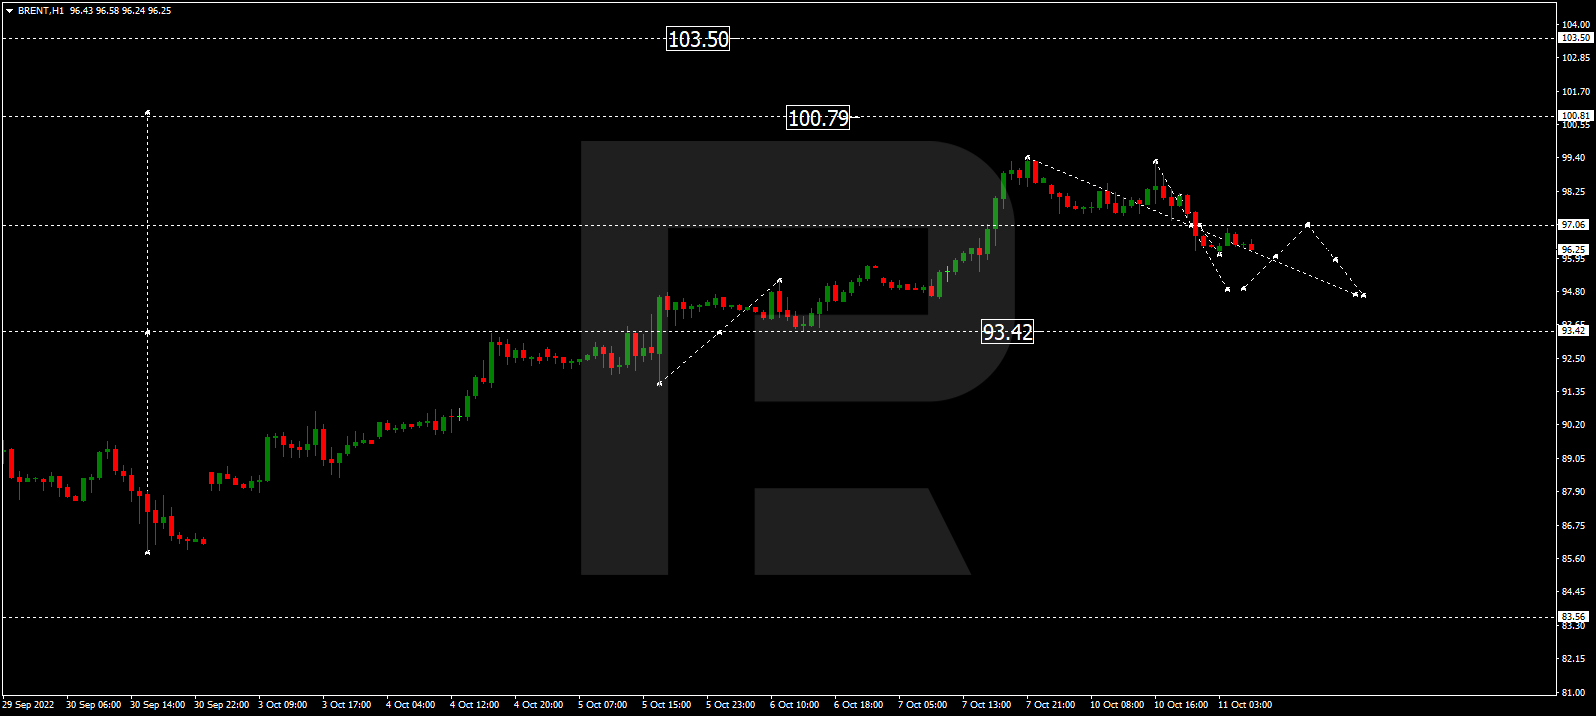
Brent has finished the descending wave at 88.60; right now. it is growing towards 93.00 and may later correct down to 90.50. After that, the instrument may start another growth to reach 97.00, or even extend this structure up to 100.00.

BRENT
Risk Warning: the result of previous trading operations do not guarantee the same results in the future

XAUUSD, “Gold vs US Dollar”

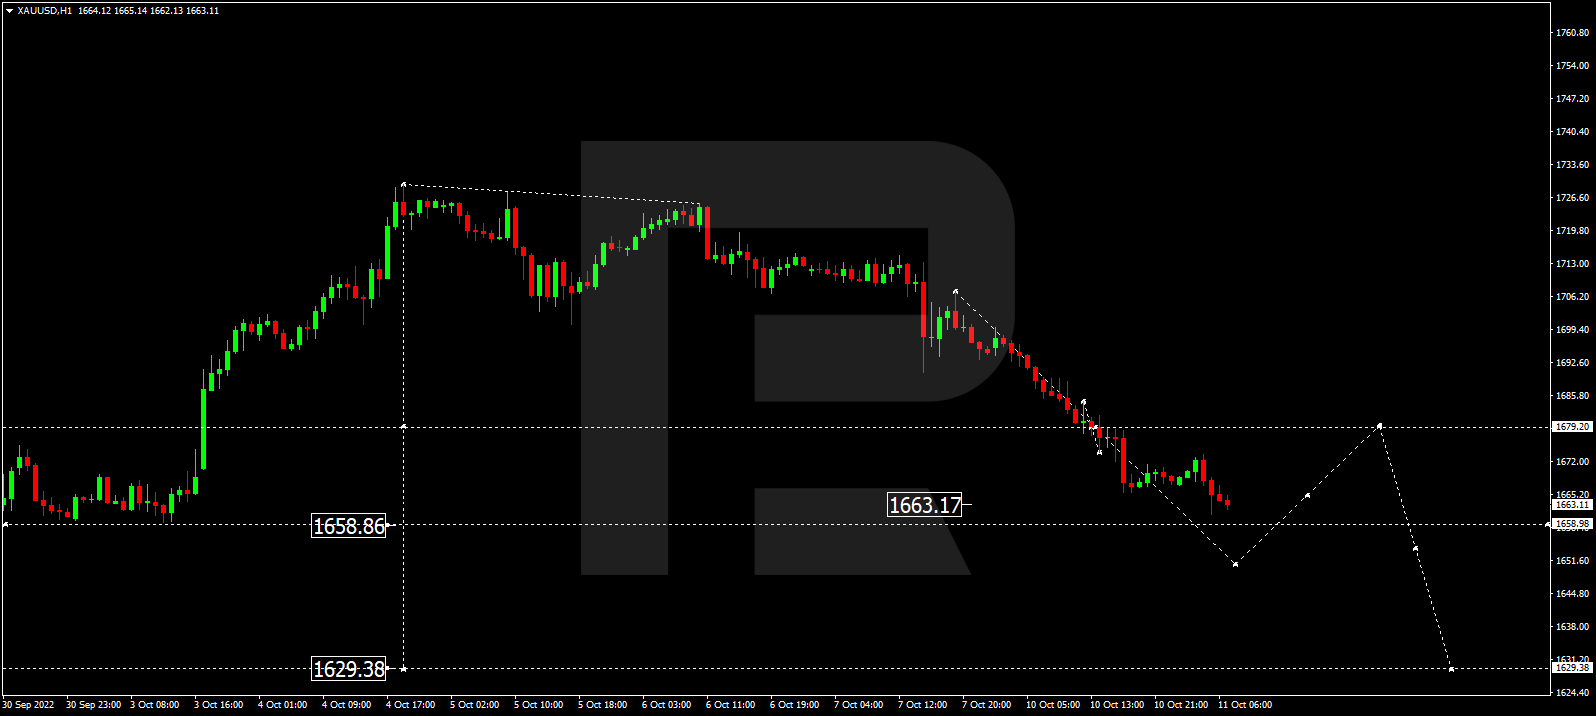
Gold is still consolidating around 1668.60. Today, the metal may fall to reach 1660.00 and then resume growing towards 1683.11. Later, the market may start a new decline to reach 1652.00 and then form one more ascending wave with the target at 1700.00.

GOLD
Risk Warning: the result of previous trading operations do not guarantee the same results in the future

S&P 500

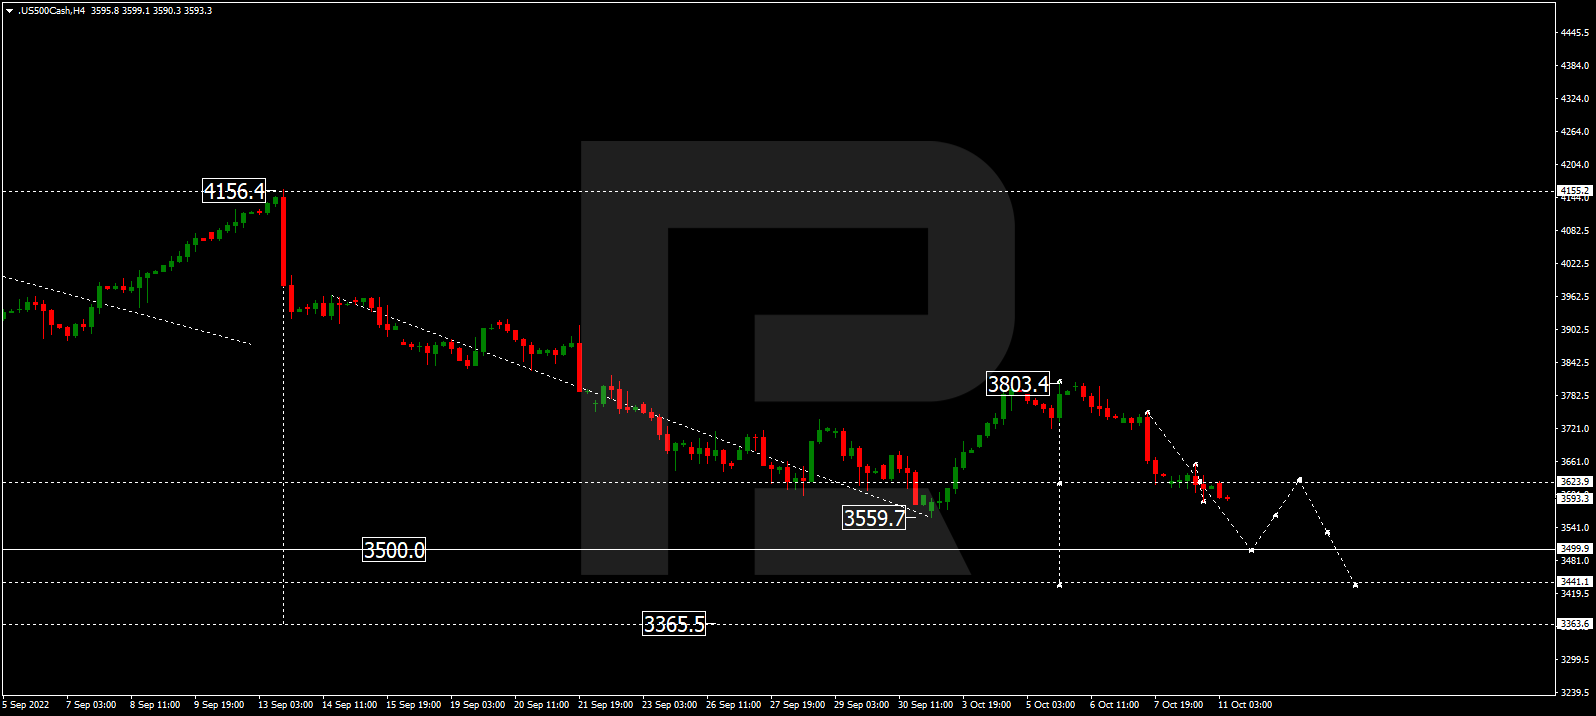
After completing the descending structure at 3832.0 and then returning to test 3912.0 from below, the S&P index is expected to start another decline with the target at 3770.0.

S&P 500

Article By RoboForex.com

Attention!
Forecasts presented in this section only reflect the author’s private opinion and should not be considered as guidance for trading. RoboForex LP bears no responsibility for trading results based on trading recommendations described in these analytical reviews.

Ichimoku Cloud Analysis 20.09.2022 (EURUSD, XAUUSD, USDCAD)

Article By RoboForex.com

EURUSD, “Euro vs US Dollar”

EURUSD is correcting within the Wedge pattern. The instrument is currently moving inside Ichimoku Cloud, thus indicating a sideways tendency. The markets could indicate that the price may test the cloud’s upside border at 1.0045 and then resume moving downwards to reach 0.9845. Another signal in favour of a further downtrend will be a rebound from the upside border of the Wedge pattern. However, the bearish scenario may no longer be valid if the price breaks the cloud’s upside border and fixes above 1.0110. In this case, the pair may continue growing towards 1.0215. To confirm a further downtrend, the price must break the pattern’s downside border and fix below 0.9965.

EURUSD
Risk Warning: the result of previous trading operations do not guarantee the same results in the future

XAUUSD, “Gold vs US Dollar”

XAUUSD is testing Tenkan-Sen and Kijun-Sen. The instrument is currently moving below Ichimoku Cloud, thus indicating a descending tendency. The markets could indicate that the price may test Kijun-Sen at 1675.00 and then resume moving downwards to reach 1625.00. Another signal in favour of a further downtrend will be a rebound from the descending channel’s upside border. However, the bearish scenario may no longer be valid if the price breaks the cloud’s upside border and fixes above 1705.00. In this case, the pair may continue growing towards 1745.00.

XAUUSD
Risk Warning: the result of previous trading operations do not guarantee the same results in the future

USDCAD, “US Dollar vs Canadian Dollar”

USDCAD is rebounding from the support area. The instrument is currently moving above Ichimoku Cloud, thus indicating an ascending tendency. The markets could indicate that the price may test Kijun-Sen at 1.3225 and then resume moving upwards to reach 1.3425. Another signal in favour of a further uptrend will be a rebound from the rising channel’s downside border. However, the bullish scenario may no longer be valid if the price breaks the cloud’s downside border and fixes below 1.3045. In this case, the pair may continue falling towards 1.2955.

USDCAD

Article By RoboForex.com

Attention!
Forecasts presented in this section only reflect the author’s private opinion and should not be considered as guidance for trading. RoboForex LP bears no responsibility for trading results based on trading recommendations described in these analytical reviews.

The Analytical Overview of the Main Currency Pairs on 2022.09.20

By JustForex

The EUR/USD currency pair

Technical indicators of the currency pair:
  • Prev Open: 1.0007
  • Prev Close: 1.0020
  • % chg. over the last day: -0.13 %

The risk of recession in the Eurozone has reached its highest level since July 2020 as fears grow that winter energy shortages will cause economic activity to decline. Economists surveyed by Bloomberg now estimate the probability of two consecutive quarters of GDP contraction at 80% over the next 12 months, up from 60% in the previous survey. Germany, the bloc’s largest economy and one of the most exposed to shrinking gas supplies, is likely to contract as soon as this quarter. Inflation is now expected to peak at 9.6% in the next three months, nearly five times the European Central Bank’s target.

Trading recommendations
  • Support levels: 0.9989, 0.9912
  • Resistance levels: 1.0148, 1.0111, 1.0162, 1.0230

From the technical point of view, the trend on the EUR/USD currency pair on the hourly time frame is bullish. On Friday, the price formed a false breakdown area below the level of 0.9971, and then on Monday, tested this zone. The MACD indicator became positive, and there is a slight buying pressure. Buy trades may be considered from the 0.9989 level. It is better to look for sell deals from the resistance levels of 1.0111 or 1.0162.

Alternative scenario: if the price breaks down through the support level of 0.9912 and fixes below, the downtrend will likely resume.

EUR/USD
News feed for 2022.09.20:
  • – US Building Permits (m/m) at 15:30 (GMT+3);
  • – Eurozone ECB President Lagarde Speaks (m/m) at 20:00 (GMT+3).

The GBP/USD currency pair

Technical indicators of the currency pair:
  • Prev Open: 1.1411
  • Prev Close: 1.1415
  • % chg. over the last day: +0.04 %

This week the Bank of England will consider whether to hold the largest interest rate hike in 33 years to respond to rising inflation and weakening confidence in British assets. With inflation, at five times the UK Central Bank’s goal of 2%, and the pound falling almost daily, policymakers led by Governor Andrew Bailey are forced to consider tightening monetary policy. The arguments for a 75 basis point hike are already more persuasive than those for a 50 basis point hike. But Prime Minister Liz Truss’ actions to protect households from rising energy bills will give a boost to the economy by softening the recession. So on the other hand, the government’s emergency energy support package reduces the need for an aggressive rate hike.

Trading recommendations
  • Support levels: 1.1400
  • Resistance levels: 1.1449, 1.1626, 1.1693, 1.1816, 1.1901, 1.1994, 1.2035, 1.2167

From the technical point of view, the trend on the GBP/USD currency pair on the hourly time frame has changed to bearish. At the moment, the price is trading at the level of moving averages, and the MACD indicator has become inactive. It is quite possible that the price is now forming a false-breakdown zone, which can be used as support if the price again consolidates above the level of 1.1449. Sell trades are better to consider in the intraday time frames, and the nearest resistance level is 1.1626.

Alternative scenario: if the price breaks out of the 1.1693 resistance level and fixes above it, the uptrend will likely resume.

GBP/USD
There is no news feed for today.

The USD/JPY currency pair

Technical indicators of the currency pair:
  • Prev Open: 142.88
  • Prev Close: 143.20
  • % chg. over the last day: +0.23 %

The nationwide Consumer Price Index rose to an annualized 2.8% (2.6% previously), the highest reading in 8 years. And while inflation remains above the 2% target, the Bank of Japan cannot be expected to abandon its ultra-soft monetary policy suddenly. Analysts predict that traders should not expect any changes in the Bank of Japan’s monetary policy before the year’s end. Therefore, considering that the US Fed keeps raising the interest rates, the gap between the rates continues to widen, which will put negative pressure on the yen.

Trading recommendations
  • Support levels: 142.57, 141.77, 141.00, 139.61, 138.78, 137.65, 136.80, 135.20
  • Resistance levels: 144.21, 145.00

From the technical point of view, the medium-term trend on the currency pair USD/JPY is bullish. The price is trading at the level of the slips and forming a balance. The MACD indicator has become inactive. Under such market conditions, buy trades can be sought from the support level of 142.57, but with additional confirmation. Sell deals can be considered on intraday time frames from the resistance level of 144.21 or 145.00, but only with additional confirmation since, fundamentally, the USD/JPY is inclined to grow.

Alternative scenario: If the price fixes below 141.00, the downtrend will likely resume.

USD/JPY
News feed for 2022.09.20:
  • – Japan National Core Consumer Price Index (m/m) at 02:30 (GMT+3);

The USD/CAD currency pair

Technical indicators of the currency pair:
  • Prev Open: 1.3260
  • Prev Close: 1.3250
  • % chg. over the last day: -0.08 %

Canada will release Consumer Price Index data today. Canada’s inflation rate is expected to fall for the second month to 7.3% from 7.6% annualized. But the Bank of Canada focuses more on the Core Index, which excludes food and energy prices, and the situation there is much more complicated. The annual core CPI is expected to rise to 6.2% from 6.1%. Therefore, the Bank of Canada is likely to maintain its aggressive stance. On the other hand, a deviation from expectations will signal a continued downward trajectory for inflation. That could revive the discussion about the extent to which the Bank of Canada will hold back tightening at its next meeting. As for the Canadian dollar, its weakness is due to the expectation that the Bank of Canada will “reverse” first. But if core inflation continues to rise, the BOC will remain aggressive, and the USD/CAD uptrend could be interrupted. Of course, the situation can change if inflation shows a decrease, in which case the BOC can take a break from rate hikes.

Trading recommendations
  • Support levels: 1.3220, 1.3053, 1.2990, 1.2958, 1.2936, 1.2900
  • Resistance levels: 1.3303, 1.3326

From the point of view of technical analysis, the trend on the USD/CAD currency pair is bullish. The price is trading at the level of moving averages, and the MACD indicator has become inactive. Under such market conditions, buy trades should be considered on the lower time frames from the support level of 1.3220. The best way to sell is to consider the resistance level of 1.3303, but only after an additional confirmation in the form of a false breakdown.

Alternative scenario: if the price breaks down and consolidates below the 1.2990 support level, the downtrend will likely resume.

USD/CAD
News feed for 2022.09.20:
  • – Canada Consumer Price Index (m/m) at 15:30 (GMT+3).

By JustForex


This article reflects a personal opinion and should not be interpreted as an investment advice, and/or offer, and/or a persistent request for carrying out financial transactions, and/or a guarantee, and/or a forecast of future events.

The RBA will continue to tighten monetary policy. Germany’s economy is already in recession

By JustForex

At Monday’s close, the Dow Jones Index (US30) increased by 0.64%, while the S&P 500 Index (US500) added 0.69%. The NASDAQ technology Index (US100) jumped 0.76% yesterday.

The Federal Reserve is going to raise interest rates on Wednesday but is unlikely to raise them by 100 basis points, the CFRA reported Monday. On the other hand, Federal Reserve Chairman Jerome Powell explicitly warned in a speech last month that the Fed’s effort to rein in inflation by aggressively raising interest rates would “bring some pain” to the economy. Another sign of the Fed’s growing concern about inflation could be that it plans to raise rates much higher by the end of the year than predicted three months ago and to hold them higher for a longer period. Economists expect the US Federal Reserve’s key rate could rise to 4% by the end of this year. That said, there is a high probability of a rate hike to 4.5% next year. Most economists expect the Fed to stop raising rates in early 2023.

CME Group, the world’s leading derivatives marketplace, yesterday announced the launch of event contracts. The new event contracts will provide market users with innovative and inexpensive ways to trade oil, gold, stock indices, and foreign currencies. Individuals will be able to trade their opinion on whether prices in key futures markets will move up or down by the end of each day’s trading session, including gold, silver, copper, crude oil, natural gas, E-mini S&P 500, E-mini Nasdaq-100, E-mini Dow Jones Industrial Average, E-mini Russell 2000 and EUR/USD currency futures. These new daily futures options will also allow participants to know their maximum profit or loss when entering a trade. The size of each event contract is $20 per contract.

Equity markets in Europe traded without a single dynamic yesterday. Germany’s DAX (DE30) gained 0.49%, France’s CAC 40 (FR40) fell by 0.26%, Spain’s IBEX 35 Index (ES35) gained 0.11%, and Britain’s FTSE 100 (UK100) was not trading on Monday.

Economists believe a recession in the eurozone is almost inevitable. Households and companies in Europe are preparing for the possibility of energy rationing after Russia restricted gas supplies to the region and are already grappling with record-high inflation and other supply bottlenecks. Business surveys show that activity has been declining since July, and there are few signs of improvement in the near term. President Christine Lagarde and her colleagues are justifying higher price increases as a sign of their determination to tame rising prices, although economists believe their time for such action is running out. Respondents now see the ECB pausing its rate hike cycle early but raising interest rates to a peak of 2% on the deposit rate by February. More than half expect a 75 basis point increase at the ECB’s next meeting in October.

Germany’s Central Bank warned that the economy has already entered a recession. The Bank said business activity could decline slightly in the current quarter and fall markedly in the fall and winter months, even if strict gas rationing can be avoided as industry cuts or freezes production. Germany’s energy supply problems became especially acute after Gazprom cut gas supplies through the Nord Stream 1 pipeline, after which the pipeline was completely shut down.

Oil prices are rising as China’s easing of quarantine fuels demand hopes. Chengdu, a major Chinese city of about 21 million people, reopened after a two-week quarantine.

Australia supported a G7 price cap on Russian oil. The treasurer said there would be no downside to limiting the price of Russian oil imports, but the move could limit its ability to finance the invasion of Ukraine. The G7 countries – the United States, Japan, Germany, United Kingdom, France, Italy, and Canada – agreed to set a price ceiling on Russian oil imports in early September. The price cap is expected to fall between $40 and $60 a barrel.

Asian markets traded lower yesterday. Japan’s Nikkei 225 (JP225) decreased by 1.11%, Hong Kong’s Hang Seng (HK50) lost 1.04% on Monday, and Australia’s S&P/ASX 200 (AU200) was down by 0.28% on the day.

The national CPI rose to 2.8% y/y (2.6% previously), the highest reading in 8 years. And while inflation remains above the 2% target, the Bank of Japan cannot be expected to suddenly abandon its ultra-soft monetary policy. Analysts predict that no changes in the monetary policy of the Bank of Japan should be expected before the end of the year.

The RBA minutes of the monetary policy meeting showed that the RBA expects inflation to peak by the end of this year, after which inflation will fall to the target range of 2-3%. The Bank’s main forecast was for CPI inflation to be around 7.75% in 2022, just above 4% in 2023, and around 3% in 2024. The outlook for global economic growth has worsened and caused key uncertainty. Central banks in several major advanced economies have expressed further resolve to tighten monetary policy to prevent high inflation from taking hold, and this will likely entail a period of much lower growth.

S&P 500 (F) (US500) 3,899.89  +26.56  (+0.69%)

Dow Jones (US30) 31,019.68 +197.26 (+0.64%)

DAX (DE40) 12,803.24 +61.98 (+0.49%)

FTSE 100 (UK100) 7,236.68 0 (0%)

USD Index 109.81 +0.04 (+0.04%)

Important events for today:
  • – Japan National Core Consumer Price Index (m/m) at 02:30 (GMT+3);
  • – China PBoC Loan Prime Rate (m/m) at 04:15 (GMT+3);
  • – Australia RBA Meeting Minutes (m/m) at 04:30 (GMT+3);
  • – US Building Permits (m/m) at 15:30 (GMT+3);
  • – Canada Consumer Price Index (m/m) at 15:30 (GMT+3);
  • – Eurozone ECB President Lagarde Speaks (m/m) at 20:00 (GMT+3).

By JustForex


This article reflects a personal opinion and should not be interpreted as an investment advice, and/or offer, and/or a persistent request for carrying out financial transactions, and/or a guarantee, and/or a forecast of future events.

Markets Cautious Ahead Of Fed Meeting

By ForexTime

European shares edged cautiously higher on Tuesday as investors braced for a busy trading week, jampacked with central bank decisions and headlined by the U.S Federal Reserve.

Overnight, Wall Street concluded the session on a positive note despite oscillating between losses and gains, while king dollar very lightly loosened its grip on the FX throne. In the commodity space, gold prices are struggling for direction, waiting for the FOMC meeting but oil seems to be stabilising after experiencing volatility in the previous session on growth and demand concerns.

It’s all about central banks this week with the Fed’s two-day monetary policy meeting beginning today. The US central bank is widely expected to fire another monetary policy bazooka at inflation after the surprise move higher in US CPI last week. On Thursday, the spotlight shines on the Bank of Japan, Bank of England, the Swiss National Bank and Central Bank of Norway who are set to hold their respective policy meetings. These high-risk events have the potential to intensify volatility across currency, commodity, and equity markets.

In the meantime, caution should remain the name of the game with investors finding comfort on the sidelines. As the Fed and other major central banks ramp up efforts to contain inflation, fears around a hard landing for their respective economies could leave market players jittery. The lack of appetite for risk amid growth fears could drain equity bulls further, opening the doors for fresh losses across global stock markets.

Fed expected to fire another monetary missile

The Federal Reserve is widely expected to raise interest rates by 75 basis points for a third straight meeting tomorrow. However, much of the focus will fall on the updated summary of economic projections and Fed Chair Jerome Powell’s post-meeting press conference. Investors will have their magnifying glasses on the “dot plot” for key clues on when and where the Fed’s hiking cycle might be coming to an end. Markets currently see US rates reaching 4% by December 2022 which suggests two smaller 50 basis point rate increases in November and December after a three-quarter point rate rise at Wednesday’s meeting.  Powell’s press conference may provide some insight into this and what we can expect from the Fed over the coming months and 2023.

If the Fed moves ahead with the expected 75-basis point rate rise, this could inject dollar bulls with some fresh energy. But such a move would need to be accompanied by hawkish comments from Powell and a “dot plot” that projects more aggressive rate hikes in the final quarter of this year and potentially into 2023. If the Fed catches markets off guard with a smaller than expected hike, this would hit the dollar hard with a dovish-sounding Powell accelerating the selloff. We expect the dollar to display volatility whatever the outcome of the meeting, with action expected across the FX space.

Currency spotlight – GBPUSD

Last week, GBPUSD tumbled to levels not seen since 1985 as uncertainty over the UK’s economic outlook haunted investor attraction towards the pound. A strong dollar bruised sterling further with prices trading around 1.1430 as of writing. 

On Thursday, the majority of economists surveyed by Bloomberg expect the Bank of England to raise rates by a half-percentage point. Although the annual inflation rate in the UK unexpectedly cooled to 9.9% in August from 10.1%, it’s still at uncomfortably high levels and close to five times higher than the bank’s 2% target.

The pound could receive a short-term boost if the BoE strikes a hawkish tone and signals more big rate hikes down the road. However, upside gains may be capped by growth fears as higher rates result in the UK economy experiencing a hard landing. Alternatively, a dovish-sounding BoE that expresses concerns over the UK economy will most likely drag the already tired pound lower. Talking technicals, GBPUSD is under pressure on the daily charts with the path of least resistance pointing south. A solid weekly close below 1.1400 could encourage bears to attack the downside with last week’s low at 1.1350.

Commodity spotlight – Gold

Gold could be destined for more pain this week thanks to the Fed.

It has been a rough month for the precious metal due to a stronger dollar and rising Treasury yields. After tumbling below the $1700 psychological level last week, it feels like bears have won the battle in September However, the war still rages on with various fundamental forces influencing gold prices.

Looking at price action through a technical lens, gold remains trapped within a short-term range, below key resistance. Sustained weakness below $1680 could open the doors toward levels below $1650 and not seen since early April 2020.


Forex-Time-LogoArticle by ForexTime

ForexTime Ltd (FXTM) is an award winning international online forex broker regulated by CySEC 185/12 www.forextime.com

Trade of the Week: GBPUSD to sink further?

By ForexTime 

GBPUSD has entered this trading week at its weakest levels since 1985!


And it’s not just GBPUSD that’s winding back the clocks to the 1980s.

This week, if forecasts in some segments of the financial markets are to be believed, the central banks of the US and the UK may also trigger their largest rate hikes respectively since 1989!

Here’s what markets are currently forecasting in the lead up to these pivotal events:

  • Fed rate decision: Wednesday, September 21st

Hike by at least 75-basis points (bps).
If so, that would be its third consecutive hike of such magnitude, following similar moves at its June and July policy meetings.

Markets forecast a 22% chance (low odds, but not negligible) for a gargantuan 100bps – which would be its largest hike since 1989.

  • Bank of England (BOE) rate decision: Thursday, September 22nd

75bps hike (similar to the Fed) fully priced in

If so, that would be the BOE’s largest hike in this ongoing rate-hike cycle that began in December 2021.
19% chance being accorded for a humongous 100bps hike this week – a move not seen since 1989.

How would Fed + BOE decisions impact GBPUSD?

1) The central bank that can pull off the larger rate hike this week, relative to the other central bank, could see its currency strengthen.

E.g. If the Fed does trigger a 100bps hike, while the BOE only does 50bps, then we should see a lower GBPUSD.

2) Also, it could well depend on which central bank signals that it has more rate hikes in the pipeline.

As things stand, here are the forecasted peaks for US vs. UK interest rates:

  • Fed’s forecasted peak = around 4.5% by March 2023
    (when markets think, for now, that the Fed will be done with its rate hikes).

    That’s about 190 basis points more from the current 2.5%, excluding this week’s anticipated hike.
  • BOE’s forecasted peak = around 4.5% by August 2023.
    That’s about 280 basis points higher than the current 1.75%, excluding this week’s anticipated hike.

Depending on the latest policy clues out of either the Fed or the BOE, the central bank with the higher forecasted peak (again, relative to the other) could see more currency strength this week.

E.g. If the Fed says it has a lot more room to hike US interest rates, while the Bank of England cites worries about raising rates too much for fear of dragging the UK economy into a protracted recession, such contrasting policy signals should lend itself to more GBPUSD declines.

Where to next for GBPUSD?

From a technical perspective, GBPUSD appears due for a technical rebound, seeing as its 14-day relative strength index  is on the cusp of breaking below the 30 threshold that denotes ‘oversold’ conditions (refer to above chart)

If so, any rebound for GBPUSD is likely to meet strong resistance around the following levels:

  • 1.160 = 21-day simple moving average (SMA)
  • 1.17382 = previous cycle high

To the downside, it’s tough to detect notable support levels in sub-1.14 territory, given the scattered price action from back in the mid-1980s when such levels were last seen.

However, at the time of writing, markets are predicting a greater-than-even chance (53%) that GBPUSD will remain below 1.14 for the next one-week period.

Some segments of the markets are even forecasting a 62% chance of GBPUSD touching levels as low as 1.125 over the same period!

Using a fundamental lens, markets are very much poised to react to the latest policy moves and clues out of the Fed and BOE in dictating how GBPUSD will perform this week.


Forex-Time-LogoArticle by ForexTime

ForexTime Ltd (FXTM) is an award winning international online forex broker regulated by CySEC 185/12 www.forextime.com

Investors Don’t Believe in Gold

By RoboForex Analytical Department

Gold continues falling – by Monday 19 September, it has reached $1,664. Earlier, it rebounded from the resistance level at $1,680 to indicate how strong the bearish pressure still is. This week, investors are expecting another aggressive rate hike from the US FOMC to continue its fight against growing inflation. Market players believe that it will be a 75-point hike, but if the regulator raises the rate by 1%, it might force Gold to continue plummeting.

Despite the fact that Gold usually acts as a “safe haven” asset” when inflation rises, high interest rates increase expenditures to store physical Gold. At the same time, increasing economic risks do not inspire market players to buy such “safe haven” assets, making the USD a more preferable investment.

Since mid-2020, Gold has been stuck inside a sideways channel between $2,065 and $1,680. If bears succeed to keep the metal at the current levels (and there are no fundamental reasons that might hint at a possible reversal so far), Gold might plummet to $1,300 in the long-term.

As we can see in the H4 chart, after rebounding from 1730.00, XAU/USD is forming another descending wave towards 1646.00. Later, the market may start a new growth with the target at 1727.00. From the technical point of view, this scenario is confirmed by MACD Oscillator: its signal line is moving below 0 outside the histogram area. In the future, the line may reverse and grow towards 0.

In the H1 chart, Gold continues trading downwards with the short-term target at 1650.00. Later, the market may grow towards 1690.00 and then resume falling to reach 1646.00. From the technical point of view, this scenario is confirmed by the Stochastic Oscillator: its signal is moving below 20 and may soon grow towards 50. After that, the line may resume falling to return to 20.

Disclaimer

Any predictions contained herein are based on the author’s particular opinion. This analysis shall not be treated as trading advice. RoboForex shall not be held liable for the results of the trades arising from relying upon trading recommendations and reviews contained herein.

Murrey Math Lines 19.09.2022 (EURUSD, GBPUSD)

Article By RoboForex.com

EURUSD, “Euro vs US Dollar”

As we can see in the H4 chart, EURUSD is trading below the 200-day Moving Average to indicate a possible descending tendency. In this case, the price is expected to test 3/8, break it, and then continue falling to reach the support at 2/8. Still, this scenario may no longer be valid if the price breaks the resistance at 4/8 to the upside. After that, the instrument may reverse and grow towards 5/8.

EURUSDH4
Risk Warning: the result of previous trading operations do not guarantee the same results in the future

In the M15 chart, the pair may break the downside line of the VoltyChannel indicator and, as a result, continue trading downwards.

EURUSD_M15
Risk Warning: the result of previous trading operations do not guarantee the same results in the future

GBPUSD, “Great Britain Pound vs US Dollar”

In the H4 chart, GBPUSD is also trading below the 200-day Moving Average, thus indicating a descending tendency. In this case, the price is expected to break the support at 1/8 and continue falling to reach 0/8. However, this scenario may no longer be valid if the price breaks the resistance at 2/8 to the upside. After that, the instrument may reverse and resume growing towards 3/8.

GBPUSD_H4
Risk Warning: the result of previous trading operations do not guarantee the same results in the future

As we can see in the M15 chart, the pair has broken the downside line of the VoltyChannel indicator and, as a result, may continue its decline.

GBPUSD_M15

Article By RoboForex.com

Attention!
Forecasts presented in this section only reflect the author’s private opinion and should not be considered as guidance for trading. RoboForex LP bears no responsibility for trading results based on trading recommendations described in these analytical reviews.