Archive for Financial News – Page 285

The cryptocurrency market digest. Overview for 03.10.2022

Article By RoboForex.com

On Monday, the BTC is balancing near 19,093 USD, slightly growing.

The market situation is not changing. The area between 18,000-19,000 USD remains the range of important support levels, and all the bearish attacks until now failed to break through the lower border of the channel. To go confidently and consistently, the BTC must rise above 22,000 USD.

There is definitely some issue with the correlation between the S&P 500, Nasdaq, and the BTC. The US market is sliding down without a pause or hope. Then why the BTC is not falling, if the connection between these two is still tight? The thing is, last week the US dollar index got weak, and it somehow smoothed out the negative influence of the S&P 500 decline.

Keep an eye on the DXY, anyway.

Totally, over Q3 the BTC lost 2.61% of its weight. Over September, the leading crypto dropped by 3.13%.

This week, the US stock market, namely, its reaction to statistics, will attract a lot of attention. A bunch of employment market reports for September are due. These reports are important for the Federal Reserve System, hence, reactions might be emotional.

Capitalisation of the crypto market today is 885.65 billion USD.

NFT: is the bubble ready to burst?

In September, the NFT trading volume amounted to 466 million USD, while in January this year, it was about 17 billion USD. In August already, the trading volume dropped abruptly to 9.34 million – against 2.7 billion in May. Investors seem to be discouraged by digital assets.

Ethereum network will be updated

The Ethereum network is getting prepared for 4 updates – Surge, Verge, Purge, and Splurge. They are to improve the scalability of the network and its safety. As soon as all updates are complete, Ethereum will be able to process up to 100 thousand transactions a second – against 20 transactions a second now.

Article By RoboForex.com

Attention!
Forecasts presented in this section only reflect the author’s private opinion and should not be considered as guidance for trading. RoboForex LP bears no responsibility for trading results based on trading recommendations described in these analytical reviews.

Pound is Keeping a Stiff Upper Lip

By RoboForex Analytical Department

The Pound Sterling keeps trying to reach stability against the USD. On Monday, 3 October, GBP/USD is balancing around 1.1211.

After the Bank of England revised its stance on supporting the country’s economy and decided to buy government bonds instead of selling them, the Pound got too much stress and dropped to multi-year lows.

The monetary and financial policy delivered by the Bank of England together with Her Majesty’s Treasury makes investors worry. It looks like London put up with an inflation boost and might try to improve the economy from the other side.

It does not necessarily mean that this strategy will work – market players should wait for real data that will help them to analyse the effect.

So far, the Pound remains fundamentally weak.

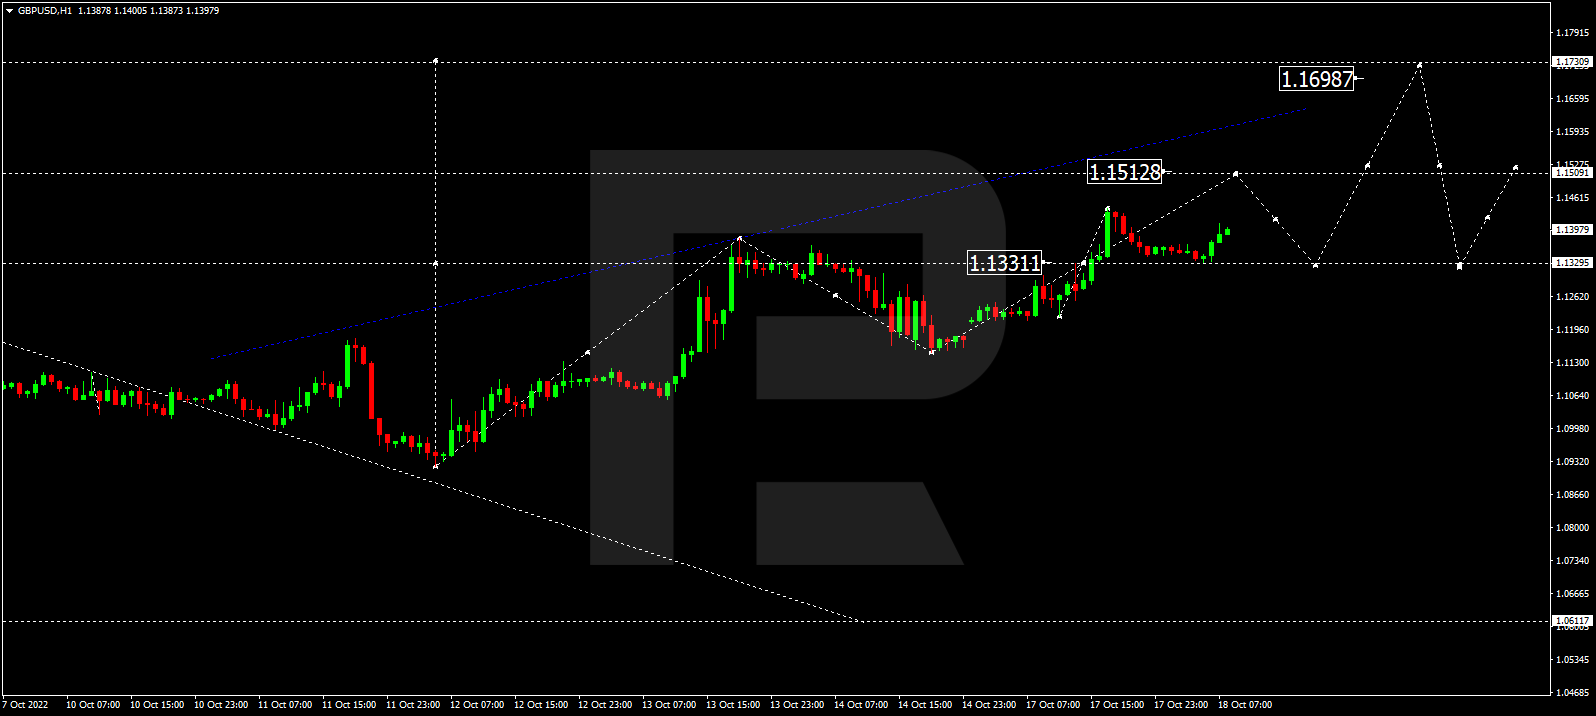
As we can see in the H4 chart, after finishing the descending wave at 1.1275, GBP/USD has formed a new consolidation range there. If later the price breaks the range to the downside, the market may resume trading downwards with the target at 1.0880; if to the upside – form one more ascending structure towards 1.1447 and then start another decline to reach 1.0185. From the technical point of view, this scenario is confirmed by the MACD Oscillator: its signal line is moving above 0 and may continue growing to reach new highs soon.

In the H1 chart, GBP/USD has completed the ascending structure with the short-term target at 1.1275. Possibly, the pair may fall towards 1.0880 and then start another growth to reach 1.1447. Later, the market may resume trading within the downtrend with the target at 1.0880. From the technical point of view, this scenario is confirmed by the Stochastic Oscillator: its signal line is moving below 80 and may fall to break 50. After that, the line may reach 20 and then resume growing to return to 80.

Disclaimer

Any forecasts contained herein are based on the author’s particular opinion. This analysis may not be treated as trading advice. RoboForex bears no responsibility for trading results based on trading recommendations and reviews contained herein.

The Analytical Overview of the Main Currency Pairs on 2022.10.03

By JustForex

The EUR/USD currency pair

Technical indicators of the currency pair:
  • Prev Open: 0.9817
  • Prev Close: 0.9795
  • % chg. over the last day: +0.25 %

For the first time in history, inflation in the Eurozone reached a double-digit number. It jumped to a record 10% (9.1% in August) on an annualized basis in September. The core inflation rate (excluding food and fuel prices) reached 4.8% (4.3% in August). The biggest surprise came in Germany, where overall inflation accelerated from 8.8% to 10.9%. Thus, of the big four eurozone economies, Germany is now the country with the highest inflation. The energy sector continues to be the biggest source of inflation. Even though oil prices have fallen, high market prices for gas and electricity continue to be reflected in consumer prices. Extremely high inflation figures mean the ECB will continue aggressively raising rates in upcoming meetings.

Trading recommendations
  • Support levels: 0.9666, 0.9601
  • Resistance levels: 0.9808, 0.9864, 0.9951, 1.0111, 1.0162, 1.0230

From the technical point of view, the trend on the EUR/USD currency pair on the hourly time frame is bearish, but the price has approached the priority change level. The MACD indicator is in the positive area, but the buyers’ pressure is weakening. It is best to look for sell deals from the resistance level of 0.9808 or 0.9864. Buy trades can be considered from the support level of 0.9666 or 0.9601, but only with confirmation.

Alternative scenario: if the price breaks out through the resistance level of 0.9808 and fixes above it, the uptrend will likely resume.

EUR/USD
News feed for 2022.10.03:
  • – Spanish Manufacturing PMI (m/m) at 10:15 (GMT+3);
  • – Italian Manufacturing PMI (m/m) at 10:45 (GMT+3);
  • – French Manufacturing PMI (m/m) at 10:50 (GMT+3);
  • – German Manufacturing PMI (m/m) at 10:55 (GMT+3);
  • – Eurozone Manufacturing PMI (m/m) at 11:00 (GMT+3);
  • – US ISM Manufacturing PMI (m/m) at 17:00 (GMT+3);
  • – US FOMC Member Williams Speaks (m/m) at 22:10 (GMT+3).

The GBP/USD currency pair

Technical indicators of the currency pair:
  • Prev Open: 1.1114
  • Prev Close: 1.1160
  • % chg. over the last day: +0.41 %

The Bank of England set the maximum amount it can buy each business day at 5 billion pounds, which means it can buy up to 65 billion pounds during the next two weeks. Analysts believe that the Bank of England has put a lot of pressure on itself by setting exact dates for the end of this temporary quantitative easing and the beginning of the quantitative easing operation. Thus, experts believe that the British pound will return to the declining phase at the end of the period (October 14).

Trading recommendations
  • Support levels: 1.0915, 1.0816, 1.0711, 1.03
  • Resistance levels: 1.1210, 1.1449, 1.1626, 1.1693, 1.1816, 1.1901

From the technical point of view, the trend on the GBP/USD currency pair on the hourly time frame is bearish. But the price has approached the priority change level. The MACD indicator remains positive, but buyer pressure is decreasing. Under such market conditions, sell trades are best to look for on intraday time frames, the nearest resistance level is 1.1210, which is the priority change level. Buy trades can be considered from the support level of 1.0915 or 1.0816, but only with confirmation and short targets.

Alternative scenario: if the price breaks out of the 1.1210 resistance level and fixes above it, the uptrend will likely resume.

GBP/USD
News feed for 2022.10.03:
  • – UK Manufacturing PMI (m/m) at 11:30 (GMT+3).

The USD/JPY currency pair

Technical indicators of the currency pair:
  • Prev Open: 144.43
  • Prev Close: 144.73
  • % chg. over the last day: +0.21 %

Stronger-than-expected industrial production and good labor market data suggest that Japan’s economy continues to recover this quarter. Further easing restrictions and the resumption of domestic traveler assistance programs will also support growth in the next quarter. Experts raised Japan’s 2022 GDP growth forecast to 1.6% from 1.2% annualized. Japan is recovering slower than other Asian economies, and the reopening effect is just starting to show, which should be a major factor in the positive outlook for the year’s second half. However, as the headwind of the global recession grows, the Bank of Japan is in no hurry to change its soft monetary policy.

Trading recommendations
  • Support levels: 143.00, 140.60, 139.61, 138.78, 137.65, 136.80, 135.20
  • Resistance levels: 145.35

From the technical point of view, the medium-term trend on the currency pair USD/JPY is bullish. The MACD indicator has become inactive, the price is trading at the level of the moving averages. Under such market conditions, buy trades can be sought on intraday time frames from the support level of 143, but with confirmation. Sell deals can be sought from the resistance level of 145.35, but only with additional confirmation.

Alternative scenario: If the price fixes below 140.60, the downtrend will likely resume.

USD/JPY
News feed for 2022.10.03:
  • – Japan Manufacturing PMI (m/m) at  3:30 (GMT+3).

The USD/CAD currency pair

Technical indicators of the currency pair:
  • Prev Open: 1.3672
  • Prev Close: 1.3829
  • % chg. over the last day: +1.15 %

The Canadian dollar is a commodity currency, so it is highly correlated with instruments like the dollar Index and oil. On Friday, oil prices were down, while the dollar Index was slightly stronger. As a result, the USD/CAD quotes are updated 2-year-high. However, investors should keep in mind that the Bank of Canada keeps one of the highest interest rates, so the Canadian dollar may start to strengthen at any time.

Trading recommendations
  • Support levels: 1.3675, 1.3545, 1.3453, 1.3297, 1.3212, 1.3053, 1.2990, 1.2958
  • Resistance levels: 1.3858, 1.3968

From the point of view of technical analysis, the trend on the USD/CAD currency pair is bullish. The MACD indicator is in the positive zone, but the price is trading between the moving average lines. Under such market conditions, buy trades should be considered on the lower time frames from the support level 1.3675, but with confirmation. For sell deals, it is best to consider the resistance level of 1.3858, but only after the additional confirmation.

Alternative scenario: if the price breaks down and consolidates below the 1.3545 support level, the downtrend will likely resume.

USD/CAD
News feed for 2022.10.03:
  • – Canada Manufacturing PMI (m/m) at 16:30 (GMT+3).

By JustForex


This article reflects a personal opinion and should not be interpreted as an investment advice, and/or offer, and/or a persistent request for carrying out financial transactions, and/or a guarantee, and/or a forecast of future events.

US stock indices have been falling for three quarters in a row. Europe and the US are imposing new sanctions on Russia

By JustForex

At the close of trading on Friday, the Dow Jones index (US30) decreased by 1.71% (-2.75% for the week), while the S&P500 (US500) was 1.51% lower (-2.64% for the week). The NASDAQ Technology Index (US100) fell by 0.75% on Friday (-0.39% for the week). As the Fed tightened its monetary policy to tame the strongest inflation in decades, the US Treasury yields jumped to their highest level in more than a decade, causing stocks to plummet.

Markets are entering the final stretch of 2022 after a tumultuous third-quarter close Friday, driven by persistently high inflation, rising interest rates, and fears of a recession. The US stock market has now posted three consecutive quarterly declines for the S&P 500 and Nasdaq since 2008, as well as the longest quarterly decline for the Dow Jones. Analysts believe investors are likely to see increased market volatility with a downward bias in the near term as we approach the reporting season.

European stock markets mostly rallied on Friday, but almost all closed in negative territory at the end of the week. German DAX (DE30) gained 1.16% (-0.96% for the week), French CAC 40 (FR40) gained 1.51% (+0.31% for the week), Spanish IBEX 35 (ES35) gained 0.91% (-2.22% for the week), British FTSE 100 (UK100) gained 0.18% (-1.78% for the week).

Inflation in the Eurozone reached double digits for the first time ever. In September, it jumped to a record 10% (9.1% in August) on an annualized basis. Core inflation (which excludes food and fuel prices) reached 4.8% (4.3% in August). The extremely high inflation figures mean that the ECB will continue to raise rates quickly in upcoming meetings. Analysts believe rates will be raised by 75 BPS in October, 50 BPS in December, and 25 BPS in the first quarter of 2023.

Four treaties were signed in the Kremlin on Friday to admit new entities to the Russian Federation. The so-called DNR, LNR, Kherson, and Zaporizhzhia regions were “annexed” by Russia. Now, Moscow will consider possible strikes by Ukraine against the territories that will “join” Russia as an act of aggression against Russia. For its part, Ukraine applied to NATO under an accelerated procedure. The European Union, the US, Canada, Australia, and many other countries said they would never recognize the results of the referendums on the new territories joining Russia, and called on other countries to condemn them.

EU countries reached a preliminary agreement on a new package of measures against Russia.

The US and UK introduced a new package of sanctions against Russia, which included dozens of individuals and entities. US President Joe Biden said after Russia’s annexation of new territories, the US would support Kyiv’s attempts to take them back. Biden said that Russia violated international law and the UN charter with its actions. The UK also imposed sanctions on services and an export ban, targeting Russia’s economic vulnerability. The UK is imposing an export ban on nearly 700 goods that are critical to Russia’s industrial and technological capabilities. The UK will also prohibit Russia from accessing the services of its engineering, architectural, auditing, legal, and advertising companies.

Embassies of many countries have advised their citizens, whose stay in Russia is not dictated by necessity, to leave Russia as soon as possible. Norway may impose a travel ban on Russian tourists, similar to that previously imposed by Finland.

According to analysts, OPEC+ will consider cutting production by more than 1 million barrels a day this week. The meeting will be held on October 5. OPEC+, which brings together OPEC nations and allies such as Russia, has refused to increase production to lower oil prices despite pressure from major consumers, including the US, to help the global economy. Nonetheless, prices fell sharply last month because of concerns about the global economy and the rising US dollar. Oil over $90 is non-negotiable for OPEC+ leadership, so they will act to keep that price floor.

Fears that further interest rate hikes could slow economic growth, coupled with the looming financial crisis in Europe and the UK, have led some investors to start buying gold again. But it should be noted that as long as there are tightening policies from Central Banks, which leads to higher government bond yields, the price of gold and silver will not have fundamental support.

Asian markets were trading lower last week. Japan’s Nikkei 225 (JP225) decreased by 3.15% for the week, Hong Kong’s Hang Seng (HK50) fell by 3.14% for the week, and Australia’s S&P/ASX 200 (AU200) was down 1.52% for the week.

In the commodities market, futures on orange juice (+5.82%), wheat (+4.86%), WTI oil (+2.98%), and Brent oil (+2.96%) showed the biggest gains. Futures on cotton (-7.78%), soybeans (-4.19%) and lumber (-2.34%) showed the largest drop.

S&P 500 (F) (US500) 3,585.62 −54.85 (−1.51%)

Dow Jones (US30) 28,725.51 −500.10 (−1.71%)

DAX (DE40) 12,114.36 +138.81 (+1.16%)

FTSE 100 (UK100) 6,893.81 +12.22 (+0.18%)

USD Index 113.02 +1.67 (+1.50%)

Important events for today:
  • – Japan Manufacturing PMI (m/m) at 03:30 (GMT+3);
  • – Switzerland Consumer Price Index (m/m) at 09:30 (GMT+3);
  • – Spanish Manufacturing PMI (m/m) at 10:15 (GMT+3);
  • – Switzerland Manufacturing PMI (m/m) at 10:30 (GMT+3);
  • – Italian Manufacturing PMI (m/m) at 10:45 (GMT+3);
  • – French Manufacturing PMI (m/m) at 10:50 (GMT+3);
  • – German Manufacturing PMI (m/m) at 10:55 (GMT+3);
  • – Eurozone Manufacturing PMI (m/m) at 11:00 (GMT+3);
  • – UK Manufacturing PMI (m/m) at 11:30 (GMT+3);
  • – Canada Manufacturing PMI (m/m) at 16:30 (GMT+3);
  • – US ISM Manufacturing PMI (m/m) at 17:00 (GMT+3);
  • – US FOMC Member Williams Speaks (m/m) at 22:10 (GMT+3).

By JustForex


This article reflects a personal opinion and should not be interpreted as an investment advice, and/or offer, and/or a persistent request for carrying out financial transactions, and/or a guarantee, and/or a forecast of future events.

Trade Of The Week: Big Week For Dollar As NFP Looms

By ForexTime 

– The mighty dollar has been an unstoppable force this year, crushing all obstacles with the destructive force of a wrecking ball. G10 currencies were practically pulverized by the greenback’s dominance with the pound shedding roughly 17% and yen over 20%.

After hitting a fresh 20-year high above 114.50 last week, the Dollar Index (DXY) tumbled thanks to a sharp recovery in the euro & pound. Given how the euro makes over 55% and the pound more than 10% of the DXY weighting, any further recovery in both currencies may influence the index’s direction in the short term.

We also saw some action on the equally-weighted dollar index which failed to secure a weekly close above 1.2800.

Despite the weakness witnessed last week, dollar bulls remain in the driving seat with the fundamentals keeping the engines healthy and running smoothly. However, a fresh catalyst could be needed for bulls to switch into higher gear in the weak ahead…and this could be the highly anticipated US jobs report on Friday.

Taking a quick look at the technical picture, prices remain bullish on the weekly charts as there have been consistently higher highs and higher lows. The DXY could make a new higher low before pushing higher or simply push back above 114.50 to test 114.73 and beyond.

The low down…

King dollar continues to feast on aggressive rate hike bets and global recession fears.

Last week, a chorus of Fed speakers struck an almost universally hawkish note on rate hikes. We saw the 10-year Treasury move above 4% for the first time since 2008, fuelled by expectations for the Fed to launch more monetary bazookas. As concerns intensified over the hawkish policies by global central banks sparking a recession, investors turned to the dollar as a shelter of safety.

As the first month of Q4 gets underway, dollar bulls have kicked off on a shaky start. Although it has weakened against most currencies, it is still early days. Traders are predicting a 66% probability of a 75-basis point rate hike in November. If this becomes reality, that would mark the fourth consecutive jumbo-sized 75 bp rate hike in 2022 against the inflation menace. Such a move could inject dollar bulls with renewed inspiration but investors may be more concerned with what happens beyond November and the New year.

Ahead of the Fed’s next policy meeting next month, key US economic data and speeches from Fed officials may influence expectations over how aggressive rates are hiked. Given how the dollar remains highly sensitive to speculation around hikes, this could translate to volatility over the next few weeks.

The week ahead…

It’s all about the US jobs report on Friday.

The consensus expects the US economy to have created 250k jobs in September which comes after a fifth straight beat in August. The unemployment rate is projected to remain at 3.7% while wage growth is seen hitting 0.3%. If the pending jobs data meets or exceeds market expectations, this may reinforce bets over the Fed moving ahead with a 75 basis point rate hike in November. Alternatively, a soft jobs report may reduce the odds of another jumbo- rate hike – weakening the dollar while supporting equity markets.

It may be wise to keep a close eye on the numerous speeches from Fed officials throughout the week. If Fed speakers remain hawkish and signal more aggressive hikes, this could keep dollar bulls hydrated ahead of the US jobs report. On the other hand, any hint of doves may see dollar bears enter the scene.

Dollar set to rebound?

After failing to secure a weekly close above 1.2800, the equally-weighted dollar index has edged slightly lower. Nevertheless, the fundamentals remain in favour of bulls and this could limit downside losses.

Bulls need to push back above 1.2800, to open a path back towards 1.2880 and higher. Sustained weakness below 1.2800 may open the doors towards 1.2500 and 1.2184.

Should 1.2500 prove to be reliable support, a rebound back towards 1.2800 could be a possibility.


Forex-Time-LogoArticle by ForexTime

ForexTime Ltd (FXTM) is an award winning international online forex broker regulated by CySEC 185/12 www.forextime.com

Butter, garage doors and SUVs: Why shortages remain common 2½ years into the pandemic

By Michael Okrent, Colorado State University Global 

Shortages of basic goods still plague the U.S. economy – 2½ years after the pandemic’s onset turned global supply chains upside down.

Want a new car? You may have to wait as long as six months, depending on the model you order. Looking for a spicy condiment? Supplies of Sriracha hot sauce have been running dangerously low. And if you feed your cat or dog dry pet food, expect empty shelves or elevated prices.

These aren’t isolated products. Baby formula, wine and spirits, lawn chairs, garage doors, butter, cream cheese, breakfast cereal and many more items have also been facing shortages in the U.S. during 2022 – and popcorn and tomatoes are expected to be in short supply soon.

In fact, global supply chains have been under the most strain in at least a quarter-century, and have been pretty much ever since the COVID-19 pandemic began.

I have been immersed in supply chain management for over 35 years, both as a manager and consultant in the private sector and as an adjunct professor at Colorado State University – Global Campus.

While each product experiencing a shortage has its own story as to what went wrong, at the root of most is a concept people in my field call the “bullwhip effect.”

What is the ‘bullwhip effect’?

The term bullwhip effect was coined in 1961 by MIT computer scientist Jay Forrester in his seminal book “Industrial Dynamics.” It describes what happens when fluctuations in demand reverberate and amplify throughout the supply chain, leading to worsening problems and shortages.

Imagine the physics of cracking a whip. It starts with a small flick of the wrist, but the whip’s wave patterns grow exponentially in a chain reaction, leading to the tip, a snap – and a sharp pain for anyone on the receiving end.

The same thing can happen in supply chains when orders for a product from a retailer, say, go up or down by some amount and that gets amplified by wholesalers, distributors and raw material suppliers.

The onset of the COVID-19 pandemic, which led to lengthy lockdowns, massive unemployment and a whole host of other effects that messed up global supply chains, essentially supercharged the bullwhip’s snap.

How the bullwhip effect works.

Cars and chips

The supply of autos is one such example.

New as well as used vehicles have been in short supply throughout the pandemic, at times forcing consumers to wait as long as a year for the most popular models.

In early 2020, when the pandemic put most Americans in lockdown, carmakers began to anticipate a fall in demand, so they significantly scaled back production. This sent a signal to suppliers, especially of computer chips, that they would need to find different buyers for their products.

Computer chips aren’t one size fits all; they are designed differently depending on their end use. So chipmakers began making fewer chips intended for use in cars and trucks and more for computers and smart refrigerators.

So when demand for vehicles suddenly returned in early 2021, carmakers were unable to secure enough chips to ramp up production. Production last year was down about 13% from 2019 levels. Since then, chipmakers have began to produce more car-specific chips, and Congress even passed a law to beef up U.S. manufacturing of semiconductors. Some carmakers, such as Ford and General Motors, have decided to sell incomplete cars, without chips and the special features they power like touchscreens, to relieve delays.

But shortages remain. You could chalk this up to poor planning, but it’s also the bullwhip effect in action.

The bullwhip is everywhere

And this is a problem for a heck of a lot of goods and parts, especially if they, like semiconductors, come from Asia.

In fact, pretty much everything Americans get from Asia – about 40% of all U.S. imports – could be affected by the bullwhip effect.

Most of this stuff travels to the U.S. by container ships, the cheapest means of transportation. That means goods must typically spend a week or longer traversing the Pacific Ocean.

The bullwhip effect comes in when a disruption in the information flow from customer to supplier happens.

For example, let’s say a customer sees that an order of lawn chairs has not been delivered by the expected date, perhaps because of a minor transportation delay. So the customer complains to the retailer, which in turn orders more from the manufacturer. Manufacturers see orders increase and pass the orders on to the suppliers with a little added, just in case.

What started out as a delay in transportation now has become a major increase in orders all down the supply chain. Now the retailer gets delivery of all the products it overordered and reduces the next order to the factory, which reduces its order to suppliers, and so on.

Now try to visualize the bullwhip of orders going up and down at the suppliers’ end.

The pandemic caused all kinds of transportation disruptions – whether due to a lack of workers, problems at a port or something else – most of which triggered the bullwhip effect.

The end isn’t nigh

When will these problems end? The answer will likely disappoint you.

As the world continues to become more interconnected, a minor problem can become larger if information is not available. Even with the right information at the right time, life happens. A storm might cause a ship carrying new cars from Europe to be lost at sea. Having only a few sources of baby formula causes a shortage when a safety issue shuts down the largest producer. Russia invades Ukraine, and 10% of the world’s grain is held hostage.

The early effects of the pandemic in 2020 led to a sharp drop in demand, which rippled through supply chains and decreased production. A strong U.S. economy and consumers flush with coronavirus cash led to a surge in demand in 2021, and the system had a hard time catching up. Now the impact of soaring inflation and a looming recession will reverse that effect, leading to a glut of stuff and a drop in orders. And the cycle will repeat.

As best as I can tell, these disruptions will take many years to recover from. And as recent inflation reduces demand for goods, and consumers begin cutting back, the bullwhip will again work its way through the supply chain – and you’ll see more shortages as it does.The Conversation

About the Author:

Michael Okrent, Part-Time Faculty in Project Management, Colorado State University Global

This article is republished from The Conversation under a Creative Commons license. Read the original article.


Soft Commodities Speculator Bets go lower led by Soybean Meal, Lean Hogs & Live Cattle

By InvestMacro

Soft Commodities Speculator Bets go lower led by Soybean Meal, Lean Hogs & Live Cattle

Here are the latest charts and statistics for the Commitment of Traders (COT) reports data published by the Commodities Futures Trading Commission (CFTC).

The latest COT data is updated through Tuesday September 27th and shows a quick view of how large traders (for-profit speculators and commercial entities) were positioned in the futures markets.

Weekly Speculator Changes go lower this week led by Soybean Meal, Lean Hogs & Live Cattle

The COT soft commodities speculator bets were lower this week as three out of the eleven soft commodities markets we cover had higher positioning this week while the other eight markets had decreases in contracts.

Leading the gains for soft commodities markets was Sugar (11,256 contracts) with Wheat (6,764 contracts) and Coffee (3,608 contracts) also showing positive weeks.

The softs market leading the declines in speculator bets this week was Soybean Meal (-11,395 contracts) with Lean Hogs (-10,484 contracts), Live Cattle (-9,400 contracts), Corn (-9,055 contracts), Soybeans (-4,722 contracts), Cocoa (-3,818 contracts), Soybean Oil (-2,424 contracts) and Cotton (-1,875 contracts) also registering lower bets on the week.


Data Snapshot of Commodity Market Traders | Columns Legend
Sep-27-2022OIOI-IndexSpec-NetSpec-IndexCom-NetCOM-IndexSmalls-NetSmalls-Index
WTI Crude1,504,9913226,0804-246,8729820,79235
Gold457,061152,0810-62,13810010,0571
Silver129,000075815-6,860896,1020
Copper173,66113-27,7561628,88486-1,12819
Palladium6,0801-831181,23682-40520
Platinum58,994201619-2,525932,3640
Natural Gas943,2410-152,12433121,1356930,98954
Brent167,44414-41,2574240,4906176720
Heating Oil290,2653111,41459-21,6254810,21134
Soybeans699,3112780,05138-50,20671-29,84521
Corn1,347,27811296,62268-229,43639-67,1864
Coffee185,149144,68077-46,664271,98418
Sugar710,887248,60147-56,409577,80818
Wheat290,77122,735234,67566-7,41072


Strength Scores

Strength Scores (a normalized measure of Speculator positions over a 3-Year range, from 0 to 100 where above 80 is extreme bullish and below 20 is extreme bearish) showed that Soybean Meal (91.5 percent) leads the soft commodity markets and remains in a bullish extreme position (above 80 percent). Coffee (77.4 percent) and Corn (67.9 percent) come in as the next highest soft commodity markets in strength scores.

On the downside, Cocoa (7.2 percent) comes in at the lowest strength level currently and is in a bearish extreme position with a score below 20 percent. The next markets with the lowest scores are Wheat (22.6 percent) and Soybeans (37.9 percent).


Strength Statistics:
Corn (67.9 percent) vs Corn previous week (69.1 percent)
Sugar (46.6 percent) vs Sugar previous week (44.3 percent)
Coffee (77.4 percent) vs Coffee previous week (74.3 percent)
Soybeans (37.9 percent) vs Soybeans previous week (39.4 percent)
Soybean Oil (40.7 percent) vs Soybean Oil previous week (42.4 percent)
Soybean Meal (91.5 percent) vs Soybean Meal previous week (97.9 percent)
Live Cattle (55.8 percent) vs Live Cattle previous week (67.6 percent)
Lean Hogs (49.9 percent) vs Lean Hogs previous week (61.3 percent)
Cotton (45.2 percent) vs Cotton previous week (46.5 percent)
Cocoa (7.2 percent) vs Cocoa previous week (11.0 percent)
Wheat (22.6 percent) vs Wheat previous week (13.8 percent)


Strength Trends

Strength Score Trends (or move index, calculates the 6-week changes in strength scores) showed that Corn (9.8 percent), Coffee (9.7 percent) and Soybean Oil (9.6 percent) lead the past six weeks trends for soft commodity markets. Wheat (6.0 percent) and Soybean Meal (1.6 percent) round out the other positive movers in the latest trends data.

Lean Hogs (-20.0 percent) leads the downside trend scores currently while the next market with lower trend scores was Cocoa (-6.9 percent) followed by Cotton (-1.5 percent).


Strength Trend Statistics:
Corn (9.8 percent) vs Corn previous week (12.1 percent)
Sugar (-0.3 percent) vs Sugar previous week (2.3 percent)
Coffee (9.7 percent) vs Coffee previous week (9.2 percent)
Soybeans (-1.0 percent) vs Soybeans previous week (-1.3 percent)
Soybean Oil (9.6 percent) vs Soybean Oil previous week (18.2 percent)
Soybean Meal (1.6 percent) vs Soybean Meal previous week (8.0 percent)
Live Cattle (-0.5 percent) vs Live Cattle previous week (27.3 percent)
Lean Hogs (-20.0 percent) vs Lean Hogs previous week (-0.1 percent)
Cotton (-1.5 percent) vs Cotton previous week (5.3 percent)
Cocoa (-6.9 percent) vs Cocoa previous week (-0.4 percent)
Wheat (6.0 percent) vs Wheat previous week (-0.8 percent)


Individual Markets:

CORN Futures:

CORN Futures COT ChartThe CORN large speculator standing this week resulted in a net position of 296,622 contracts in the data reported through Tuesday. This was a weekly fall of -9,055 contracts from the previous week which had a total of 305,677 net contracts.

This week’s current strength score (the trader positioning range over the past three years, measured from 0 to 100) shows the speculators are currently Bullish with a score of 67.9 percent. The commercials are Bearish with a score of 39.2 percent and the small traders (not shown in chart) are Bearish-Extreme with a score of 4.4 percent.

CORN Futures StatisticsSPECULATORSCOMMERCIALSSMALL TRADERS
– Percent of Open Interest Longs:30.944.88.7
– Percent of Open Interest Shorts:8.961.913.7
– Net Position:296,622-229,436-67,186
– Gross Longs:415,961604,188117,870
– Gross Shorts:119,339833,624185,056
– Long to Short Ratio:3.5 to 10.7 to 10.6 to 1
NET POSITION TREND:
– Strength Index Score (3 Year Range Pct):67.939.24.4
– Strength Index Reading (3 Year Range):BullishBearishBearish-Extreme
NET POSITION MOVEMENT INDEX:
– 6-Week Change in Strength Index:9.8-9.0-7.7


SUGAR Futures:

SUGAR Futures COT ChartThe SUGAR large speculator standing this week resulted in a net position of 48,601 contracts in the data reported through Tuesday. This was a weekly boost of 11,256 contracts from the previous week which had a total of 37,345 net contracts.

This week’s current strength score (the trader positioning range over the past three years, measured from 0 to 100) shows the speculators are currently Bearish with a score of 46.6 percent. The commercials are Bullish with a score of 57.5 percent and the small traders (not shown in chart) are Bearish-Extreme with a score of 17.5 percent.

SUGAR Futures StatisticsSPECULATORSCOMMERCIALSSMALL TRADERS
– Percent of Open Interest Longs:24.154.99.8
– Percent of Open Interest Shorts:17.262.88.7
– Net Position:48,601-56,4097,808
– Gross Longs:171,124390,23269,802
– Gross Shorts:122,523446,64161,994
– Long to Short Ratio:1.4 to 10.9 to 11.1 to 1
NET POSITION TREND:
– Strength Index Score (3 Year Range Pct):46.657.517.5
– Strength Index Reading (3 Year Range):BearishBullishBearish-Extreme
NET POSITION MOVEMENT INDEX:
– 6-Week Change in Strength Index:-0.31.0-5.0


COFFEE Futures:

COFFEE Futures COT ChartThe COFFEE large speculator standing this week resulted in a net position of 44,680 contracts in the data reported through Tuesday. This was a weekly rise of 3,608 contracts from the previous week which had a total of 41,072 net contracts.

This week’s current strength score (the trader positioning range over the past three years, measured from 0 to 100) shows the speculators are currently Bullish with a score of 77.4 percent. The commercials are Bearish with a score of 26.9 percent and the small traders (not shown in chart) are Bearish-Extreme with a score of 17.7 percent.

COFFEE Futures StatisticsSPECULATORSCOMMERCIALSSMALL TRADERS
– Percent of Open Interest Longs:30.044.54.9
– Percent of Open Interest Shorts:5.869.73.8
– Net Position:44,680-46,6641,984
– Gross Longs:55,45482,4489,049
– Gross Shorts:10,774129,1127,065
– Long to Short Ratio:5.1 to 10.6 to 11.3 to 1
NET POSITION TREND:
– Strength Index Score (3 Year Range Pct):77.426.917.7
– Strength Index Reading (3 Year Range):BullishBearishBearish-Extreme
NET POSITION MOVEMENT INDEX:
– 6-Week Change in Strength Index:9.7-10.31.3


SOYBEANS Futures:

SOYBEANS Futures COT ChartThe SOYBEANS large speculator standing this week resulted in a net position of 80,051 contracts in the data reported through Tuesday. This was a weekly decline of -4,722 contracts from the previous week which had a total of 84,773 net contracts.

This week’s current strength score (the trader positioning range over the past three years, measured from 0 to 100) shows the speculators are currently Bearish with a score of 37.9 percent. The commercials are Bullish with a score of 71.2 percent and the small traders (not shown in chart) are Bearish with a score of 20.6 percent.

SOYBEANS Futures StatisticsSPECULATORSCOMMERCIALSSMALL TRADERS
– Percent of Open Interest Longs:21.452.66.2
– Percent of Open Interest Shorts:10.059.810.4
– Net Position:80,051-50,206-29,845
– Gross Longs:149,774367,74443,219
– Gross Shorts:69,723417,95073,064
– Long to Short Ratio:2.1 to 10.9 to 10.6 to 1
NET POSITION TREND:
– Strength Index Score (3 Year Range Pct):37.971.220.6
– Strength Index Reading (3 Year Range):BearishBullishBearish
NET POSITION MOVEMENT INDEX:
– 6-Week Change in Strength Index:-1.00.42.9


SOYBEAN OIL Futures:

SOYBEAN OIL Futures COT ChartThe SOYBEAN OIL large speculator standing this week resulted in a net position of 54,987 contracts in the data reported through Tuesday. This was a weekly decline of -2,424 contracts from the previous week which had a total of 57,411 net contracts.

This week’s current strength score (the trader positioning range over the past three years, measured from 0 to 100) shows the speculators are currently Bearish with a score of 40.7 percent. The commercials are Bullish with a score of 61.9 percent and the small traders (not shown in chart) are Bearish with a score of 35.7 percent.

SOYBEAN OIL Futures StatisticsSPECULATORSCOMMERCIALSSMALL TRADERS
– Percent of Open Interest Longs:22.548.46.9
– Percent of Open Interest Shorts:8.963.55.4
– Net Position:54,987-60,9595,972
– Gross Longs:91,132196,32228,053
– Gross Shorts:36,145257,28122,081
– Long to Short Ratio:2.5 to 10.8 to 11.3 to 1
NET POSITION TREND:
– Strength Index Score (3 Year Range Pct):40.761.935.7
– Strength Index Reading (3 Year Range):BearishBullishBearish
NET POSITION MOVEMENT INDEX:
– 6-Week Change in Strength Index:9.6-8.90.7


SOYBEAN MEAL Futures:

SOYBEAN MEAL Futures COT ChartThe SOYBEAN MEAL large speculator standing this week resulted in a net position of 115,075 contracts in the data reported through Tuesday. This was a weekly reduction of -11,395 contracts from the previous week which had a total of 126,470 net contracts.

This week’s current strength score (the trader positioning range over the past three years, measured from 0 to 100) shows the speculators are currently Bullish-Extreme with a score of 91.5 percent. The commercials are Bearish-Extreme with a score of 11.0 percent and the small traders (not shown in chart) are Bullish with a score of 53.6 percent.

SOYBEAN MEAL Futures StatisticsSPECULATORSCOMMERCIALSSMALL TRADERS
– Percent of Open Interest Longs:33.939.712.3
– Percent of Open Interest Shorts:3.776.16.2
– Net Position:115,075-138,37123,296
– Gross Longs:129,268151,41646,999
– Gross Shorts:14,193289,78723,703
– Long to Short Ratio:9.1 to 10.5 to 12.0 to 1
NET POSITION TREND:
– Strength Index Score (3 Year Range Pct):91.511.053.6
– Strength Index Reading (3 Year Range):Bullish-ExtremeBearish-ExtremeBullish
NET POSITION MOVEMENT INDEX:
– 6-Week Change in Strength Index:1.6-1.3-2.1


LIVE CATTLE Futures:

LIVE CATTLE Futures COT ChartThe LIVE CATTLE large speculator standing this week resulted in a net position of 60,967 contracts in the data reported through Tuesday. This was a weekly decline of -9,400 contracts from the previous week which had a total of 70,367 net contracts.

This week’s current strength score (the trader positioning range over the past three years, measured from 0 to 100) shows the speculators are currently Bullish with a score of 55.8 percent. The commercials are Bearish with a score of 33.4 percent and the small traders (not shown in chart) are Bullish-Extreme with a score of 86.5 percent.

LIVE CATTLE Futures StatisticsSPECULATORSCOMMERCIALSSMALL TRADERS
– Percent of Open Interest Longs:39.633.211.1
– Percent of Open Interest Shorts:18.253.612.0
– Net Position:60,967-58,327-2,640
– Gross Longs:112,89794,74231,567
– Gross Shorts:51,930153,06934,207
– Long to Short Ratio:2.2 to 10.6 to 10.9 to 1
NET POSITION TREND:
– Strength Index Score (3 Year Range Pct):55.833.486.5
– Strength Index Reading (3 Year Range):BullishBearishBullish-Extreme
NET POSITION MOVEMENT INDEX:
– 6-Week Change in Strength Index:-0.50.6-0.0


LEAN HOGS Futures:

LEAN HOGS Futures COT ChartThe LEAN HOGS large speculator standing this week resulted in a net position of 39,631 contracts in the data reported through Tuesday. This was a weekly decline of -10,484 contracts from the previous week which had a total of 50,115 net contracts.

This week’s current strength score (the trader positioning range over the past three years, measured from 0 to 100) shows the speculators are currently Bearish with a score of 49.9 percent. The commercials are Bullish with a score of 56.1 percent and the small traders (not shown in chart) are Bullish with a score of 54.8 percent.

LEAN HOGS Futures StatisticsSPECULATORSCOMMERCIALSSMALL TRADERS
– Percent of Open Interest Longs:40.734.98.8
– Percent of Open Interest Shorts:21.450.312.7
– Net Position:39,631-31,593-8,038
– Gross Longs:83,52171,74118,012
– Gross Shorts:43,890103,33426,050
– Long to Short Ratio:1.9 to 10.7 to 10.7 to 1
NET POSITION TREND:
– Strength Index Score (3 Year Range Pct):49.956.154.8
– Strength Index Reading (3 Year Range):BearishBullishBullish
NET POSITION MOVEMENT INDEX:
– 6-Week Change in Strength Index:-20.021.02.9


COTTON Futures:

COTTON Futures COT ChartThe COTTON large speculator standing this week resulted in a net position of 42,079 contracts in the data reported through Tuesday. This was a weekly reduction of -1,875 contracts from the previous week which had a total of 43,954 net contracts.

This week’s current strength score (the trader positioning range over the past three years, measured from 0 to 100) shows the speculators are currently Bearish with a score of 45.2 percent. The commercials are Bullish with a score of 57.5 percent and the small traders (not shown in chart) are Bearish with a score of 22.8 percent.

COTTON Futures StatisticsSPECULATORSCOMMERCIALSSMALL TRADERS
– Percent of Open Interest Longs:32.150.05.4
– Percent of Open Interest Shorts:12.970.14.5
– Net Position:42,079-44,0161,937
– Gross Longs:70,391109,62911,741
– Gross Shorts:28,312153,6459,804
– Long to Short Ratio:2.5 to 10.7 to 11.2 to 1
NET POSITION TREND:
– Strength Index Score (3 Year Range Pct):45.257.522.8
– Strength Index Reading (3 Year Range):BearishBullishBearish
NET POSITION MOVEMENT INDEX:
– 6-Week Change in Strength Index:-1.53.9-25.5


COCOA Futures:

COCOA Futures COT ChartThe COCOA large speculator standing this week resulted in a net position of -9,759 contracts in the data reported through Tuesday. This was a weekly decrease of -3,818 contracts from the previous week which had a total of -5,941 net contracts.

This week’s current strength score (the trader positioning range over the past three years, measured from 0 to 100) shows the speculators are currently Bearish-Extreme with a score of 7.2 percent. The commercials are Bullish-Extreme with a score of 93.1 percent and the small traders (not shown in chart) are Bearish with a score of 37.5 percent.

COCOA Futures StatisticsSPECULATORSCOMMERCIALSSMALL TRADERS
– Percent of Open Interest Longs:32.745.24.8
– Percent of Open Interest Shorts:35.843.43.5
– Net Position:-9,7595,6604,099
– Gross Longs:102,300141,68914,973
– Gross Shorts:112,059136,02910,874
– Long to Short Ratio:0.9 to 11.0 to 11.4 to 1
NET POSITION TREND:
– Strength Index Score (3 Year Range Pct):7.293.137.5
– Strength Index Reading (3 Year Range):Bearish-ExtremeBullish-ExtremeBearish
NET POSITION MOVEMENT INDEX:
– 6-Week Change in Strength Index:-6.95.415.1


WHEAT Futures:

WHEAT Futures COT ChartThe WHEAT large speculator standing this week resulted in a net position of 2,735 contracts in the data reported through Tuesday. This was a weekly gain of 6,764 contracts from the previous week which had a total of -4,029 net contracts.

This week’s current strength score (the trader positioning range over the past three years, measured from 0 to 100) shows the speculators are currently Bearish with a score of 22.6 percent. The commercials are Bullish with a score of 66.3 percent and the small traders (not shown in chart) are Bullish with a score of 71.9 percent.

WHEAT Futures StatisticsSPECULATORSCOMMERCIALSSMALL TRADERS
– Percent of Open Interest Longs:30.240.79.3
– Percent of Open Interest Shorts:29.339.111.9
– Net Position:2,7354,675-7,410
– Gross Longs:87,885118,36027,059
– Gross Shorts:85,150113,68534,469
– Long to Short Ratio:1.0 to 11.0 to 10.8 to 1
NET POSITION TREND:
– Strength Index Score (3 Year Range Pct):22.666.371.9
– Strength Index Reading (3 Year Range):BearishBullishBullish
NET POSITION MOVEMENT INDEX:
– 6-Week Change in Strength Index:6.0-3.9-9.7


Article By InvestMacroReceive our weekly COT Newsletter

*COT Report: The COT data, released weekly to the public each Friday, is updated through the most recent Tuesday (data is 3 days old) and shows a quick view of how large speculators or non-commercials (for-profit traders) were positioned in the futures markets.

The CFTC categorizes trader positions according to commercial hedgers (traders who use futures contracts for hedging as part of the business), non-commercials (large traders who speculate to realize trading profits) and nonreportable traders (usually small traders/speculators) as well as their open interest (contracts open in the market at time of reporting). See CFTC criteria here.

Speculators sharply raised their SP500-Mini bets for 2nd week to least bearish level since June

By InvestMacro

COT Stock Futures Open Interest Comparison

Here are the latest charts and statistics for the Commitment of Traders (COT) data published by the Commodities Futures Trading Commission (CFTC).

The latest COT data is updated through Tuesday September 27th and shows a quick view of how large traders (for-profit speculators and commercial entities) were positioned in the futures markets.

Weekly Speculator Changes led by S&P500 Mini and Nikkei 225

Stocks Futures Speculator Net Position Changes

The COT stock market speculator bets were slightly higher this week as four out of the seven stock markets we cover had higher positioning on the week while the other three markets had lower contracts.

Leading the gains for stock markets was the S&P500 Mini (69,250 contracts) with the Nikkei 225 USD (6,161 contracts), MSCI EAFE Mini (4,434 contracts) and the Russell 2000 Mini (777 contracts) also showing positive weeks.

The stock markets leading the declines in speculator bets this week were the Dow Jones Industrial Average Mini (-3,796 contracts), Nasdaq Mini (-3,533 contracts) and the VIX (-926 contracts).

Highlighting the COT Stocks data this week is another week of big moves in the SP500-Mini speculator contracts. The SP500-Mini speculator bets rebounded sharply for a second straight week and gained by more than +60,000 contracts for the second consecutive week. The past 2-week rise in speculator bets now totals +130,803 contracts. The SP500-Mini speculator position is now below the -200,000 contracts for the first time since July 5th and at the least bearish level since June 28th. Despite the positive speculator sentiment last week, the SP500 index sold off sharply to end the week and closed at its lowest level since November of 2020.


Data Snapshot of Stock Market Traders | Columns Legend
Sep-27-2022OIOI-IndexSpec-NetSpec-IndexCom-NetCOM-IndexSmalls-NetSmalls-Index
S&P500-Mini2,233,8785-150,20128232,96781-82,7669
Nikkei 22514,070101,52085-1,541222129
Nasdaq-Mini282,05461-487524,47342-24,4256
DowJones-Mini67,05524-19,2301420,42886-1,19832
VIX331,04236-82,7246890,37833-7,65454
Nikkei 225 Yen43,11519-6503214,38367-13,73347


Strength Scores

Strength Scores (a normalized measure of Speculator positions over a 3-Year range, from 0 to 100 where above 80 is extreme bullish and below 20 is extreme bearish) showed that the Nikkei USD (84.7 percent) leads the stock markets and is in a bullish extreme position (above 80 percent). The Nasdaq-Mini (75.0 percent) and the VIX (67.8 percent) come in as the next highest stock markets in strength scores.

On the downside, the Russell 2000-Mini (7.8 percent) comes in at the lowest strength level currently and is followed by the DowJones-Mini (13.8 percent) with both being in bearish extreme levels (below 20 percent).

Strength Statistics:
VIX (67.8 percent) vs VIX previous week (68.3 percent)
S&P500-Mini (28.4 percent) vs S&P500-Mini previous week (15.5 percent)
DowJones-Mini (13.8 percent) vs DowJones-Mini previous week (19.3 percent)
Nasdaq-Mini (75.0 percent) vs Nasdaq-Mini previous week (77.0 percent)
Russell2000-Mini (7.8 percent) vs Russell2000-Mini previous week (7.4 percent)
Nikkei USD (84.7 percent) vs Nikkei USD previous week (55.4 percent)
EAFE-Mini (27.3 percent) vs EAFE-Mini previous week (22.4 percent)

Strength Trends

Strength Score Trends (or move index, calculates the 6-week changes in strength scores) showed that the EAFE-Mini (27.3 percent) and the S&P500-Mini (25.5 percent) lead the past six weeks trends for stocks. The Nikkei USD (22.1 percent), the VIX (9.7 percent) and the Russell 2000-Mini (5.8 percent) round out the other positive movers in the latest trends data.

The DowJones-Mini (-17.7 percent) leads the downside trend scores currently while the next market with lower trend scores was the Nasdaq-Mini (-3.9 percent).


Strength Trend Statistics:
VIX (9.7 percent) vs VIX previous week (8.2 percent)
S&P500-Mini (25.5 percent) vs S&P500-Mini previous week (4.6 percent)
DowJones-Mini (-17.7 percent) vs DowJones-Mini previous week (-3.9 percent)
Nasdaq-Mini (-3.9 percent) vs Nasdaq-Mini previous week (-9.8 percent)
Russell2000-Mini (5.8 percent) vs Russell2000-Mini previous week (3.4 percent)
Nikkei USD (22.1 percent) vs Nikkei USD previous week (-12.8 percent)
EAFE-Mini (27.3 percent) vs EAFE-Mini previous week (7.8 percent)


Individual Markets:

VIX Volatility Futures:

VIX Volatility Futures COT ChartThe VIX Volatility large speculator standing this week recorded a net position of -82,724 contracts in the data reported through Tuesday. This was a weekly fall of -926 contracts from the previous week which had a total of -81,798 net contracts.

This week’s current strength score (the trader positioning range over the past three years, measured from 0 to 100) shows the speculators are currently Bullish with a score of 67.8 percent. The commercials are Bearish with a score of 33.1 percent and the small traders (not shown in chart) are Bullish with a score of 54.2 percent.

VIX Volatility Futures StatisticsSPECULATORSCOMMERCIALSSMALL TRADERS
– Percent of Open Interest Longs:17.855.07.2
– Percent of Open Interest Shorts:42.827.79.6
– Net Position:-82,72490,378-7,654
– Gross Longs:58,980182,09723,991
– Gross Shorts:141,70491,71931,645
– Long to Short Ratio:0.4 to 12.0 to 10.8 to 1
NET POSITION TREND:
– Strength Index Score (3 Year Range Pct):67.833.154.2
– Strength Index Reading (3 Year Range):BullishBearishBullish
NET POSITION MOVEMENT INDEX:
– 6-Week Change in Strength Index:9.7-7.3-22.0


S&P500 Mini Futures:

SP500 Mini Futures COT ChartThe S&P500 Mini large speculator standing this week recorded a net position of -150,201 contracts in the data reported through Tuesday. This was a weekly boost of 69,250 contracts from the previous week which had a total of -219,451 net contracts.

This week’s current strength score (the trader positioning range over the past three years, measured from 0 to 100) shows the speculators are currently Bearish with a score of 28.4 percent. The commercials are Bullish-Extreme with a score of 81.4 percent and the small traders (not shown in chart) are Bearish-Extreme with a score of 9.0 percent.

S&P500 Mini Futures StatisticsSPECULATORSCOMMERCIALSSMALL TRADERS
– Percent of Open Interest Longs:11.876.98.4
– Percent of Open Interest Shorts:18.566.512.1
– Net Position:-150,201232,967-82,766
– Gross Longs:262,7971,717,571186,623
– Gross Shorts:412,9981,484,604269,389
– Long to Short Ratio:0.6 to 11.2 to 10.7 to 1
NET POSITION TREND:
– Strength Index Score (3 Year Range Pct):28.481.49.0
– Strength Index Reading (3 Year Range):BearishBullish-ExtremeBearish-Extreme
NET POSITION MOVEMENT INDEX:
– 6-Week Change in Strength Index:25.5-16.4-3.5


Dow Jones Mini Futures:

Dow Jones Mini Futures COT ChartThe Dow Jones Mini large speculator standing this week recorded a net position of -19,230 contracts in the data reported through Tuesday. This was a weekly decline of -3,796 contracts from the previous week which had a total of -15,434 net contracts.

This week’s current strength score (the trader positioning range over the past three years, measured from 0 to 100) shows the speculators are currently Bearish-Extreme with a score of 13.8 percent. The commercials are Bullish-Extreme with a score of 85.8 percent and the small traders (not shown in chart) are Bearish with a score of 32.1 percent.

Dow Jones Mini Futures StatisticsSPECULATORSCOMMERCIALSSMALL TRADERS
– Percent of Open Interest Longs:21.360.617.3
– Percent of Open Interest Shorts:50.030.119.1
– Net Position:-19,23020,428-1,198
– Gross Longs:14,30940,63211,590
– Gross Shorts:33,53920,20412,788
– Long to Short Ratio:0.4 to 12.0 to 10.9 to 1
NET POSITION TREND:
– Strength Index Score (3 Year Range Pct):13.885.832.1
– Strength Index Reading (3 Year Range):Bearish-ExtremeBullish-ExtremeBearish
NET POSITION MOVEMENT INDEX:
– 6-Week Change in Strength Index:-17.715.56.4


Nasdaq Mini Futures:

Nasdaq Mini Futures COT ChartThe Nasdaq Mini large speculator standing this week recorded a net position of -48 contracts in the data reported through Tuesday. This was a weekly fall of -3,533 contracts from the previous week which had a total of 3,485 net contracts.

This week’s current strength score (the trader positioning range over the past three years, measured from 0 to 100) shows the speculators are currently Bullish with a score of 75.0 percent. The commercials are Bearish with a score of 41.6 percent and the small traders (not shown in chart) are Bearish-Extreme with a score of 5.6 percent.

Nasdaq Mini Futures StatisticsSPECULATORSCOMMERCIALSSMALL TRADERS
– Percent of Open Interest Longs:26.560.411.6
– Percent of Open Interest Shorts:26.551.720.3
– Net Position:-4824,473-24,425
– Gross Longs:74,731170,35232,818
– Gross Shorts:74,779145,87957,243
– Long to Short Ratio:1.0 to 11.2 to 10.6 to 1
NET POSITION TREND:
– Strength Index Score (3 Year Range Pct):75.041.65.6
– Strength Index Reading (3 Year Range):BullishBearishBearish-Extreme
NET POSITION MOVEMENT INDEX:
– 6-Week Change in Strength Index:-3.95.5-3.9


Russell 2000 Mini Futures:

Russell 2000 Mini Futures COT ChartThe Russell 2000 Mini large speculator standing this week recorded a net position of -106,061 contracts in the data reported through Tuesday. This was a weekly advance of 777 contracts from the previous week which had a total of -106,838 net contracts.

This week’s current strength score (the trader positioning range over the past three years, measured from 0 to 100) shows the speculators are currently Bearish-Extreme with a score of 7.8 percent. The commercials are Bullish-Extreme with a score of 91.3 percent and the small traders (not shown in chart) are Bearish with a score of 23.5 percent.

Russell 2000 Mini Futures StatisticsSPECULATORSCOMMERCIALSSMALL TRADERS
– Percent of Open Interest Longs:7.987.33.8
– Percent of Open Interest Shorts:27.267.84.0
– Net Position:-106,061107,336-1,275
– Gross Longs:43,291479,62220,778
– Gross Shorts:149,352372,28622,053
– Long to Short Ratio:0.3 to 11.3 to 10.9 to 1
NET POSITION TREND:
– Strength Index Score (3 Year Range Pct):7.891.323.5
– Strength Index Reading (3 Year Range):Bearish-ExtremeBullish-ExtremeBearish
NET POSITION MOVEMENT INDEX:
– 6-Week Change in Strength Index:5.8-5.71.9


Nikkei Stock Average (USD) Futures:

Nikkei Stock Average (USD) Futures COT ChartThe Nikkei Stock Average (USD) large speculator standing this week recorded a net position of 1,520 contracts in the data reported through Tuesday. This was a weekly gain of 6,161 contracts from the previous week which had a total of -4,641 net contracts.

This week’s current strength score (the trader positioning range over the past three years, measured from 0 to 100) shows the speculators are currently Bullish-Extreme with a score of 84.7 percent. The commercials are Bearish with a score of 21.9 percent and the small traders (not shown in chart) are Bearish with a score of 28.6 percent.

Nikkei Stock Average Futures StatisticsSPECULATORSCOMMERCIALSSMALL TRADERS
– Percent of Open Interest Longs:34.546.718.6
– Percent of Open Interest Shorts:23.757.618.4
– Net Position:1,520-1,54121
– Gross Longs:4,8606,5692,611
– Gross Shorts:3,3408,1102,590
– Long to Short Ratio:1.5 to 10.8 to 11.0 to 1
NET POSITION TREND:
– Strength Index Score (3 Year Range Pct):84.721.928.6
– Strength Index Reading (3 Year Range):Bullish-ExtremeBearishBearish
NET POSITION MOVEMENT INDEX:
– 6-Week Change in Strength Index:22.1-24.53.0


MSCI EAFE Mini Futures:

MSCI EAFE Mini Futures COT ChartThe MSCI EAFE Mini large speculator standing this week recorded a net position of -11,275 contracts in the data reported through Tuesday. This was a weekly lift of 4,434 contracts from the previous week which had a total of -15,709 net contracts.

This week’s current strength score (the trader positioning range over the past three years, measured from 0 to 100) shows the speculators are currently Bearish with a score of 27.3 percent. The commercials are Bullish with a score of 74.5 percent and the small traders (not shown in chart) are Bearish with a score of 29.0 percent.

MSCI EAFE Mini Futures StatisticsSPECULATORSCOMMERCIALSSMALL TRADERS
– Percent of Open Interest Longs:5.092.22.1
– Percent of Open Interest Shorts:7.989.61.8
– Net Position:-11,27510,1181,157
– Gross Longs:19,991365,7418,306
– Gross Shorts:31,266355,6237,149
– Long to Short Ratio:0.6 to 11.0 to 11.2 to 1
NET POSITION TREND:
– Strength Index Score (3 Year Range Pct):27.374.529.0
– Strength Index Reading (3 Year Range):BearishBullishBearish
NET POSITION MOVEMENT INDEX:
– 6-Week Change in Strength Index:27.3-25.5-10.0


Article By InvestMacroReceive our weekly COT Newsletter

*COT Report: The COT data, released weekly to the public each Friday, is updated through the most recent Tuesday (data is 3 days old) and shows a quick view of how large speculators or non-commercials (for-profit traders) were positioned in the futures markets.

The CFTC categorizes trader positions according to commercial hedgers (traders who use futures contracts for hedging as part of the business), non-commercials (large traders who speculate to realize trading profits) and nonreportable traders (usually small traders/speculators) as well as their open interest (contracts open in the market at time of reporting). See CFTC criteria here.

Weekly Energy COT Speculator Bets led by Natural Gas & Bloomberg Commodity Index

By InvestMacro

Here are the latest charts and statistics for the Commitment of Traders (COT) data published by the Commodities Futures Trading Commission (CFTC).

The latest COT data is updated through Tuesday September 27th and shows a quick view of how large traders (for-profit speculators and commercial hedgers) were positioned in the futures markets.

Weekly Speculator Changes led by Natural Gas and Bloomberg Commodity Index

The COT energy market speculator bets were lower this week as two out of the six energy markets we cover had higher positioning this week while the other four markets had lower contracts.

Leading the gains for energy markets was Natural Gas (3,587 contracts) with the Bloomberg Commodity Index (2,703 contracts) also showing a positive week.

The energy markets leading the declines in speculator bets this week was WTI Crude Oil (-13,798 contracts) with Brent Crude Oil (-3,354 contracts), Gasoline (-3,013 contracts) and Heating Oil (-2,683 contracts) also recording lower bets on the week.


Data Snapshot of Commodity Market Traders | Columns Legend
Sep-27-2022OIOI-IndexSpec-NetSpec-IndexCom-NetCOM-IndexSmalls-NetSmalls-Index
WTI Crude1,504,9913226,0804-246,8729820,79235
Gold457,061152,0810-62,13810010,0571
Silver129,000075815-6,860896,1020
Copper173,66113-27,7561628,88486-1,12819
Palladium6,0801-831181,23682-40520
Platinum58,994201619-2,525932,3640
Natural Gas943,2410-152,12433121,1356930,98954
Brent167,44414-41,2574240,4906176720
Heating Oil290,2653111,41459-21,6254810,21134
Soybeans699,3112780,05138-50,20671-29,84521
Corn1,347,27811296,62268-229,43639-67,1864
Coffee185,149144,68077-46,664271,98418
Sugar710,887248,60147-56,409577,80818
Wheat290,77122,735234,67566-7,41072


Strength Scores

Strength Scores (a normalized measure of Speculator positions over a 3-Year range, from 0 to 100 where above 80 is extreme bullish and below 20 is extreme bearish) showed that the Bloomberg Commodity Index (78.4 percent) and Heating Oil (59.2 percent) lead the energy markets currently. These are the only two markets that have scores above 50 percent or above the midpoint of the 3-year range.

On the downside, the WTI Crude Oil (4.1 percent) comes in at the lowest strength level and is followed by Gasoline at 16.1 percent. Both of these markets are currently in bearish extreme positions with scores below 20 percent.


Strength Statistics:
WTI Crude Oil (4.1 percent) vs WTI Crude Oil previous week (7.7 percent)
Brent Crude Oil (41.9 percent) vs Brent Crude Oil previous week (47.6 percent)
Natural Gas (32.9 percent) vs Natural Gas previous week (31.8 percent)
Gasoline (16.1 percent) vs Gasoline previous week (19.1 percent)
Heating Oil (59.2 percent) vs Heating Oil previous week (63.2 percent)
Bloomberg Commodity Index (78.4 percent) vs Bloomberg Commodity Index previous week (68.0 percent)

Strength Trends

Strength Score Trends (or move index, calculates the 6-week changes in strength scores) showed that the Bloomberg Commodity Index (20.2 percent) leads the past six weeks trends for energy this week. The only other positive mover in the latest trends data was WTI Crude Oil at 2.9 percent.

Heating Oil (-19.9 percent) leads the downside trend scores currently while the next market with lower trend scores was Natural Gas (-9.4 percent) followed by Brent Crude Oil (-8.8 percent).

Strength Trend Statistics:
WTI Crude Oil (2.9 percent) vs WTI Crude Oil previous week (7.7 percent)
Brent Crude Oil (-8.8 percent) vs Brent Crude Oil previous week (-6.2 percent)
Natural Gas (-9.4 percent) vs Natural Gas previous week (-9.1 percent)
Gasoline (-3.6 percent) vs Gasoline previous week (1.6 percent)
Heating Oil (-19.9 percent) vs Heating Oil previous week (-15.3 percent)
Bloomberg Commodity Index (20.2 percent) vs Bloomberg Commodity Index previous week (8.9 percent)


Individual COT Market Charts:

WTI Crude Oil Futures:

WTI Crude Oil Futures COT ChartThe WTI Crude Oil Futures large speculator standing this week reached a net position of 226,080 contracts in the data reported through Tuesday. This was a weekly fall of -13,798 contracts from the previous week which had a total of 239,878 net contracts.

This week’s current strength score (the trader positioning range over the past three years, measured from 0 to 100) shows the speculators are currently Bearish-Extreme with a score of 4.1 percent. The commercials are Bullish-Extreme with a score of 97.6 percent and the small traders (not shown in chart) are Bearish with a score of 34.7 percent.

WTI Crude Oil Futures StatisticsSPECULATORSCOMMERCIALSSMALL TRADERS
– Percent of Open Interest Longs:22.239.85.0
– Percent of Open Interest Shorts:7.256.23.6
– Net Position:226,080-246,87220,792
– Gross Longs:333,933598,42875,054
– Gross Shorts:107,853845,30054,262
– Long to Short Ratio:3.1 to 10.7 to 11.4 to 1
NET POSITION TREND:
– Strength Index Score (3 Year Range Pct):4.197.634.7
– Strength Index Reading (3 Year Range):Bearish-ExtremeBullish-ExtremeBearish
NET POSITION MOVEMENT INDEX:
– 6-Week Change in Strength Index:2.9-2.0-5.9


Brent Crude Oil Futures:

Brent Last Day Crude Oil Futures COT ChartThe Brent Crude Oil Futures large speculator standing this week reached a net position of -41,257 contracts in the data reported through Tuesday. This was a weekly decline of -3,354 contracts from the previous week which had a total of -37,903 net contracts.

This week’s current strength score (the trader positioning range over the past three years, measured from 0 to 100) shows the speculators are currently Bearish with a score of 41.9 percent. The commercials are Bullish with a score of 60.6 percent and the small traders (not shown in chart) are Bearish-Extreme with a score of 19.6 percent.

Brent Crude Oil Futures StatisticsSPECULATORSCOMMERCIALSSMALL TRADERS
– Percent of Open Interest Longs:15.353.24.3
– Percent of Open Interest Shorts:40.029.03.9
– Net Position:-41,25740,490767
– Gross Longs:25,69689,1277,236
– Gross Shorts:66,95348,6376,469
– Long to Short Ratio:0.4 to 11.8 to 11.1 to 1
NET POSITION TREND:
– Strength Index Score (3 Year Range Pct):41.960.619.6
– Strength Index Reading (3 Year Range):BearishBullishBearish-Extreme
NET POSITION MOVEMENT INDEX:
– 6-Week Change in Strength Index:-8.810.3-12.9


Natural Gas Futures:

Natural Gas Futures COT ChartThe Natural Gas Futures large speculator standing this week reached a net position of -152,124 contracts in the data reported through Tuesday. This was a weekly lift of 3,587 contracts from the previous week which had a total of -155,711 net contracts.

This week’s current strength score (the trader positioning range over the past three years, measured from 0 to 100) shows the speculators are currently Bearish with a score of 32.9 percent. The commercials are Bullish with a score of 69.1 percent and the small traders (not shown in chart) are Bullish with a score of 53.6 percent.

Natural Gas Futures StatisticsSPECULATORSCOMMERCIALSSMALL TRADERS
– Percent of Open Interest Longs:15.143.36.5
– Percent of Open Interest Shorts:31.230.53.2
– Net Position:-152,124121,13530,989
– Gross Longs:142,021408,87161,287
– Gross Shorts:294,145287,73630,298
– Long to Short Ratio:0.5 to 11.4 to 12.0 to 1
NET POSITION TREND:
– Strength Index Score (3 Year Range Pct):32.969.153.6
– Strength Index Reading (3 Year Range):BearishBullishBullish
NET POSITION MOVEMENT INDEX:
– 6-Week Change in Strength Index:-9.412.1-16.6


Gasoline Blendstock Futures:

RBOB Gasoline Energy Futures COT ChartThe Gasoline Blendstock Futures large speculator standing this week reached a net position of 44,060 contracts in the data reported through Tuesday. This was a weekly lowering of -3,013 contracts from the previous week which had a total of 47,073 net contracts.

This week’s current strength score (the trader positioning range over the past three years, measured from 0 to 100) shows the speculators are currently Bearish-Extreme with a score of 16.1 percent. The commercials are Bullish-Extreme with a score of 86.4 percent and the small traders (not shown in chart) are Bearish with a score of 31.7 percent.

Nasdaq Mini Futures StatisticsSPECULATORSCOMMERCIALSSMALL TRADERS
– Percent of Open Interest Longs:32.946.87.6
– Percent of Open Interest Shorts:14.566.46.4
– Net Position:44,060-46,9042,844
– Gross Longs:78,843111,94718,200
– Gross Shorts:34,783158,85115,356
– Long to Short Ratio:2.3 to 10.7 to 11.2 to 1
NET POSITION TREND:
– Strength Index Score (3 Year Range Pct):16.186.431.7
– Strength Index Reading (3 Year Range):Bearish-ExtremeBullish-ExtremeBearish
NET POSITION MOVEMENT INDEX:
– 6-Week Change in Strength Index:-3.65.5-14.1


#2 Heating Oil NY-Harbor Futures:

NY Harbor Heating Oil Energy Futures COT ChartThe #2 Heating Oil NY-Harbor Futures large speculator standing this week reached a net position of 11,414 contracts in the data reported through Tuesday. This was a weekly decline of -2,683 contracts from the previous week which had a total of 14,097 net contracts.

This week’s current strength score (the trader positioning range over the past three years, measured from 0 to 100) shows the speculators are currently Bullish with a score of 59.2 percent. The commercials are Bearish with a score of 48.2 percent and the small traders (not shown in chart) are Bearish with a score of 33.7 percent.

Heating Oil Futures StatisticsSPECULATORSCOMMERCIALSSMALL TRADERS
– Percent of Open Interest Longs:13.653.313.2
– Percent of Open Interest Shorts:9.760.89.7
– Net Position:11,414-21,62510,211
– Gross Longs:39,591154,77838,397
– Gross Shorts:28,177176,40328,186
– Long to Short Ratio:1.4 to 10.9 to 11.4 to 1
NET POSITION TREND:
– Strength Index Score (3 Year Range Pct):59.248.233.7
– Strength Index Reading (3 Year Range):BullishBearishBearish
NET POSITION MOVEMENT INDEX:
– 6-Week Change in Strength Index:-19.919.6-16.9


Bloomberg Commodity Index Futures:

Bloomberg Commodity Index Futures COT ChartThe Bloomberg Commodity Index Futures large speculator standing this week reached a net position of -7,614 contracts in the data reported through Tuesday. This was a weekly gain of 2,703 contracts from the previous week which had a total of -10,317 net contracts.

This week’s current strength score (the trader positioning range over the past three years, measured from 0 to 100) shows the speculators are currently Bullish with a score of 78.4 percent. The commercials are Bearish with a score of 21.9 percent and the small traders (not shown in chart) are Bearish-Extreme with a score of 16.1 percent.

Bloomberg Index Futures StatisticsSPECULATORSCOMMERCIALSSMALL TRADERS
– Percent of Open Interest Longs:24.074.10.4
– Percent of Open Interest Shorts:36.461.90.2
– Net Position:-7,6147,445169
– Gross Longs:14,65245,267271
– Gross Shorts:22,26637,822102
– Long to Short Ratio:0.7 to 11.2 to 12.7 to 1
NET POSITION TREND:
– Strength Index Score (3 Year Range Pct):78.421.916.1
– Strength Index Reading (3 Year Range):BullishBearishBearish-Extreme
NET POSITION MOVEMENT INDEX:
– 6-Week Change in Strength Index:20.2-19.8-4.9


Article By InvestMacroReceive our weekly COT Newsletter

*COT Report: The COT data, released weekly to the public each Friday, is updated through the most recent Tuesday (data is 3 days old) and shows a quick view of how large speculators or non-commercials (for-profit traders) were positioned in the futures markets.

The CFTC categorizes trader positions according to commercial hedgers (traders who use futures contracts for hedging as part of the business), non-commercials (large traders who speculate to realize trading profits) and nonreportable traders (usually small traders/speculators) as well as their open interest (contracts open in the market at time of reporting). See CFTC criteria here.


Japanese Candlesticks Analysis 30.09.2022 (USDCAD, AUDUSD, USDCHF)

Article By RoboForex.com

USDCAD, “US Dollar vs Canadian Dollar”

As we can see in the H4 chart, after forming an Engulfing reversal pattern close to the support level, USDCAD is reversing in the form of a new ascending wave. In this case, the upside target may be at 1.3900. Later, the market may break the resistance area and continue growing. However, an alternative scenario implies that the asset may correct to reach 1.3600 first and then resume the uptrend.

USDCAD
Risk Warning: the result of previous trading operations do not guarantee the same results in the future

AUDUSD, “Australian Dollar vs US Dollar”

As we can see in the H4 chart, AUDUSD has formed a Hammer reversal pattern near the support area. At the moment, the asset is reversing in the form of a new correctional impulse. In this case, the upside correctional target may be the resistance level at 0.6550. After testing the level, the price may rebound from it and resume the descending tendency. At the same time, the opposite scenario implies that the price may fall to reach 0.6365 and continue the downtrend without any pullbacks up to resistance level.

AUDUSD
Risk Warning: the result of previous trading operations do not guarantee the same results in the future

USDCHF, “US Dollar vs Swiss Franc”

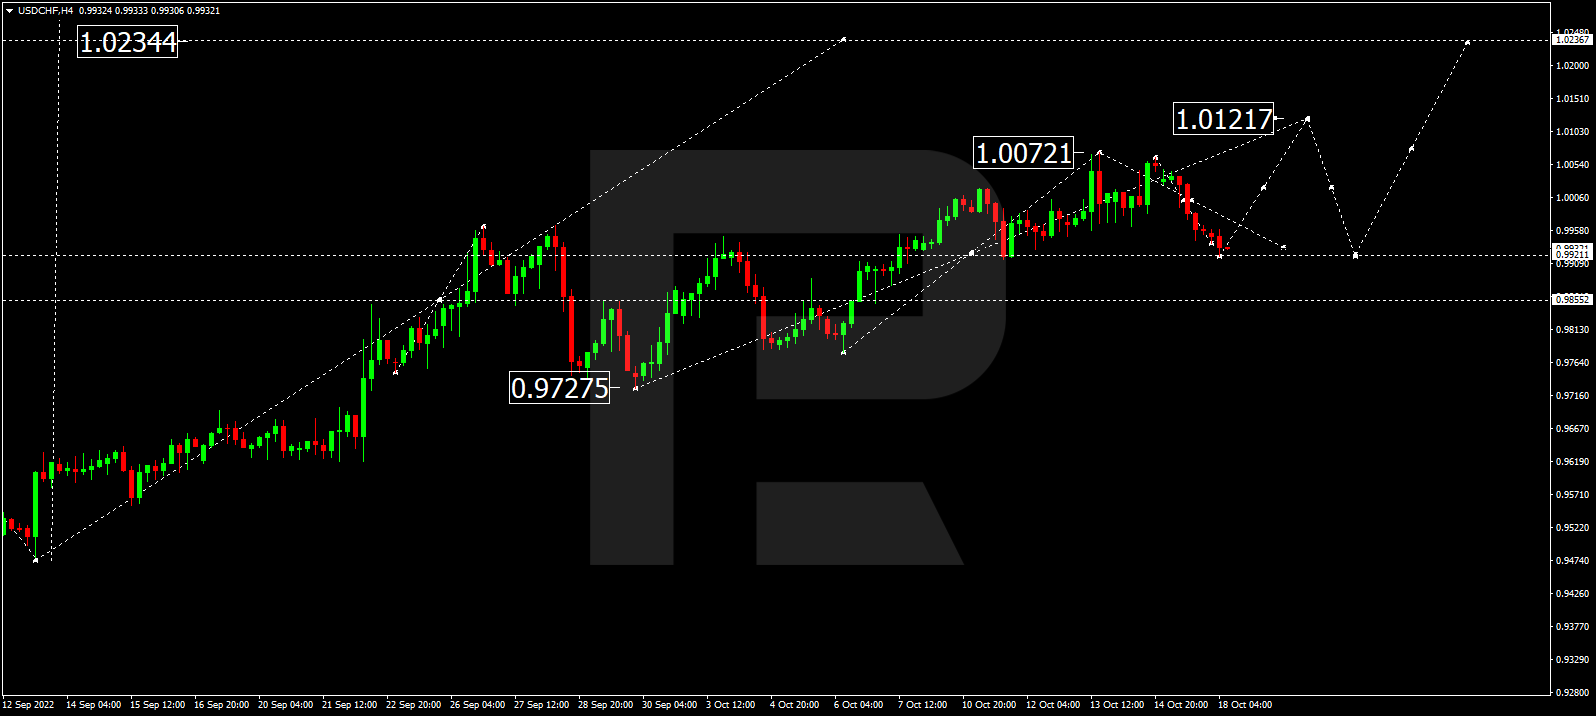
As we can see in the H4 chart, the pair has formed a Hammer reversal pattern not far from the support area. At the moment, USDCHF may reverse in the form of a new ascending wave. In this case, the upside target may be the resistance level at 0.9860. After testing this level, the price may break it and continue trading upwards. Still, there might be an alternative scenario, in which the asset may correct to reach 0.9680 first and then resume the ascending tendency.

USDCHF

Article By RoboForex.com

Attention!
Forecasts presented in this section only reflect the author’s private opinion and should not be considered as guidance for trading. RoboForex LP bears no responsibility for trading results based on trading recommendations described in these analytical reviews.