By JustMarkets
Last week, the Nasdaq recorded its first weekly decline of the year. After a strong report on nonfarm payrolls and data from ISM in service sectors, investors concluded that the US economy remains resilient, and interest rates are pricing in a “higher for the longer term” scenario. Such market conditions create an environment of uncertainty for investors, which limits growth potential. As the stock market closed on Friday, the Dow Jones Index (US30) increased by 0.50 (-0.02% for the week), and the S&P 500 Index (US500) added 0.22% (-0.71% for the week). The NASDAQ Technology Index (US100) fell by 0.61% on Friday (-1.56% for the week).
2-year and 10-year bond yields soared to more than four-week highs last week as traders reassessed the trajectory of monetary policy higher, with the final rate now at 5.17% compared to 4.92% earlier this month.
According to Refinitiv, more than half of the firms in the S&P 500 reported earnings, with 69% beating earnings estimates for the quarter. Coca-Cola (KO), Barrick Gold (GOLD), Kraft Heinz (KHC), Airbnb (ABNB), and Biogen (BIIB) are reporting this week.
Equity markets in Europe were mostly down on Friday. German DAX (DE30) fell by 1.39% (-0.38% on the week), French CAC 40 (FR40) lost 0.82% (-0.73% on the week), Spanish IBEX 35 (ES35) fell by 1.36% (-0.63% on the week), British FTSE 100 (UK100) decreased by 0.36% (-0.24% on the week).
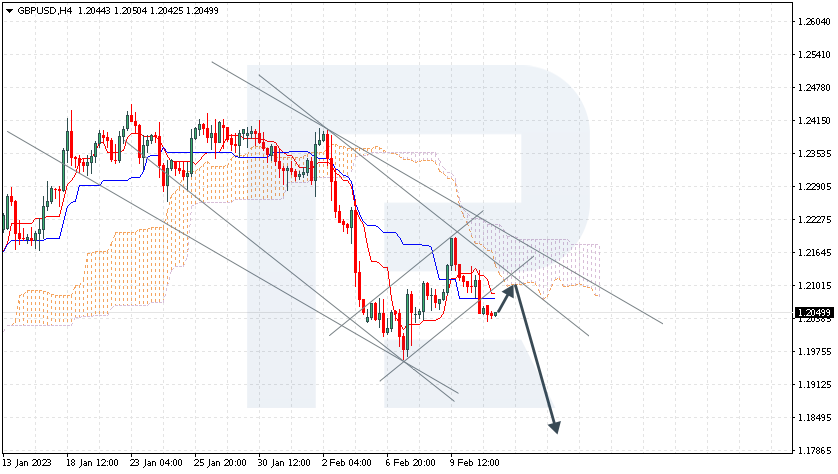
After the Bank of England’s latest rate hike and Friday’s GDP data, markets believe the central bank may soon hit the pause button. According to business surveys, the UK economy faces serious recession risks. The deciding factor this week will be the labor market figures and new inflation data. Inflation is projected to remain above 10%, while the labor market will show signs of weakness. In that case, the Bank of England will have no choice but to stop raising rates.
The selloff in precious metals stabilized somewhat late last week as markets await important inflation data this week. With the new economic data, there is a constant reassessment of forward-looking expectations. A soft landing and a resilient US economy will help push gold prices higher. New signals of policy tightening will be negative for gold, as the precious metals have an inverse correlation to the dollar index and government bond yields.
Asian markets were mostly down last week. Japan’s Nikkei 225 (JP225) declined 0.34% over the week, China’s FTSE China A50 (CHA50) fell by 0.63% over the week, Hong Kong’s Hang Seng (HK50) lost 0.74% over the week, India’s NIFTY 50 (IND50) added 0.60%, and Australia’s S&P/ASX 200 (AU200) was down by 1.65% over the week.
This week, the Japanese government will officially elect a new Governor of the Bank of Japan to replace Haruhiko Kuroda, whose decade as the Central Bank will end in April. Whether the Bank of Japan will adjust its policy is one of the main questions facing markets around the world this year. BoJ observers suspect that the current ultra-soft monetary policy is likely to change as inflation rises. Also, on Friday, it was reported that the Japanese government decided to nominate Kazuo Ueda as governor of the Bank of Japan after Deputy Governor Masayoshi Amamiya reportedly refused the role. It was thought that Amamiya would provide some continuity to Kuroda’s policies. Although Ueda’s political views are not yet clear, traders are betting that he is unlikely to be as cautious as Amamiya about tightening policy. He is not currently a member of the Bank of Japan and has not been involved in extreme stimulus policies in the last decade, so it is thought that he might be more open to raising interest rates.
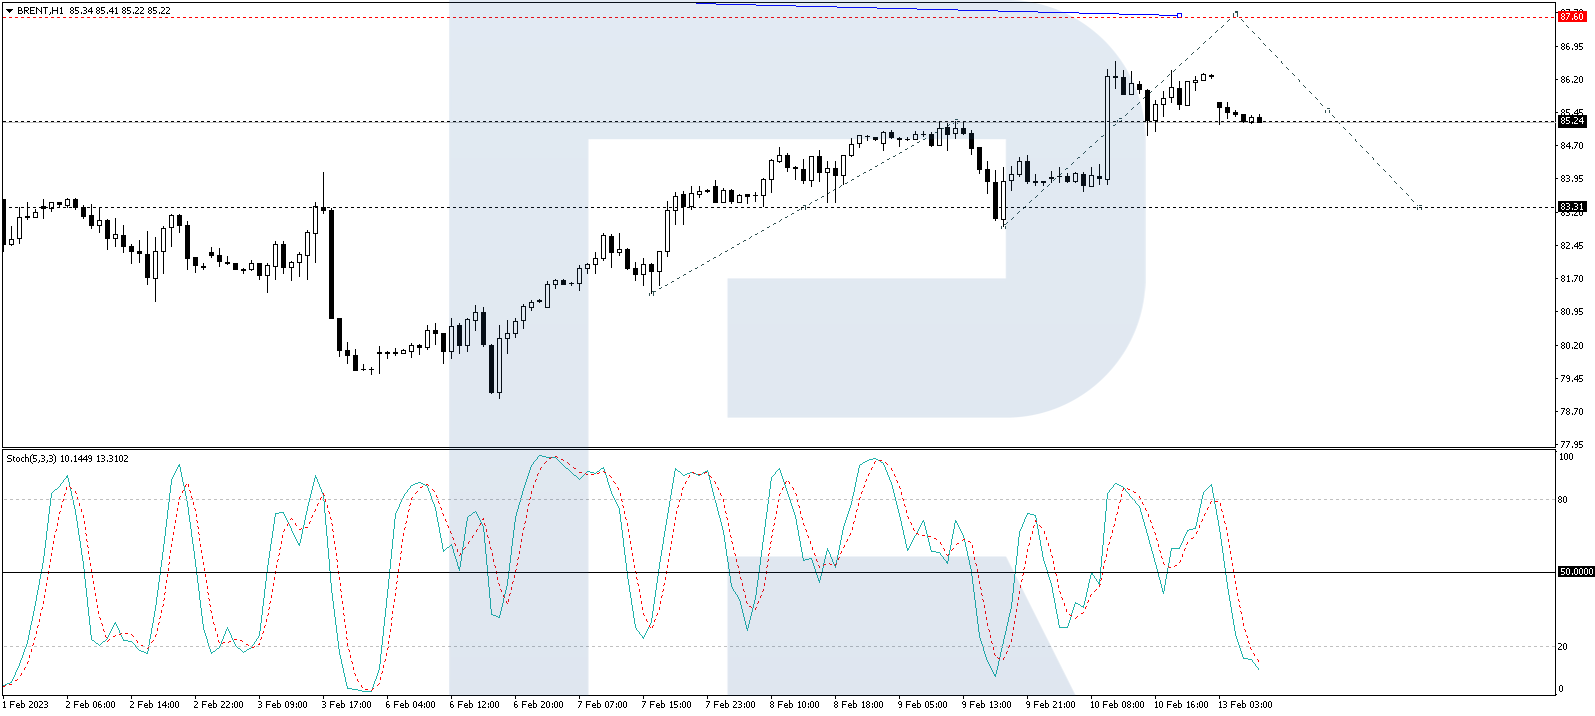
In the commodities market, futures on WTI crude oil (+8.68%), Brent oil (+8.23%), gasoline (+7.65%), natural gas (+7.05%), orange juice (+4.47%) and wheat (+4.26%) showed the biggest gains last week. Futures on lumber (-15.23%), palladium (-5.8%), and platinum (-2.96%) showed the biggest drop.
S&P 500 (F) (US500) 4,090.46 +8.96 (+0.22%)
Dow Jones (US30) 33,869.27 +169.39 (+0.50%)
DAX (DE40) 15,307.98 −215.44 (−1.39%)
FTSE 100 (UK100) 7,882.45 −28.70 (−0.36%)
USD Index 102.99 +1.24 (+1.22%)
Important events for today:
- – Switzerland Consumer Price Index (m/m) at 09:30 (GMT+2);
- – Indian Consumer Price Index (m/m) at 14:00 (GMT+2);
- – US FOMC Member Bowman Speaks at 15:00 (GMT+2).
By JustMarkets
This article reflects a personal opinion and should not be interpreted as an investment advice, and/or offer, and/or a persistent request for carrying out financial transactions, and/or a guarantee, and/or a forecast of future events.