By JustMarkets
US stock indices rose yesterday, despite the growth of the dollar index. At the close of the stock market yesterday, the Dow Jones Index (US30) gained 0.34%, the S&P 500 Index (US500) added 0.94%, and the Nasdaq Technology Index (US100) jumped by 1.51%.
White House economic adviser Lael Brainard said Thursday that a default on the $31.4 trillion US debt would lead to a recession in the US economy. Brainard also pointed out that Biden’s negotiating team has been instructed not to agree to any Republican proposal to raise the debt ceiling that would deprive Americans of health care or plunge any of them into poverty. Republicans, who are threatening to default on the government, are trying to convince Democrats to accept tougher job requirements for some federal aid programs, as well as cut spending in exchange for lifting the borrowing limit.
“Hawkish” Fed officials (Laurie Logan and James Bullard) oppose a June rate hike pause. On Thursday, interest rate futures markets showed a 33.3% chance of a rate hike in June, up from a 90% chance just a week ago. Fed governor and vice presidential candidate Philip Jefferson, speaking Thursday, also said that while progress on inflation is slowing, it is too early to feel the full impact of these rapid rate hikes. Powell is scheduled to speak on Friday, and investors expect him to update his views in light of new economic data.
Shares of Walmart Inc (WMT) jumped by 1.3% after the largest US retailer reported first-quarter sales were up 8%.
Stock markets in Europe were mostly up yesterday. Germany’s DAX (DE30) added 1.33%, France’s CAC 40 (FR40) decreased by 0.64% yesterday, Spain’s IBEX 35 (ES35) was up 0.17% Thursday, Britain’s FTSE 100 (UK100) closed the day positive 0.25%.
The Turkish lira fell to a record low against the dollar on Thursday after incumbent President Tayyip Erdogan’s lead in the presidential election came as a surprise, while the country’s sovereign dollar bonds stabilized after a three-day drop following the election.
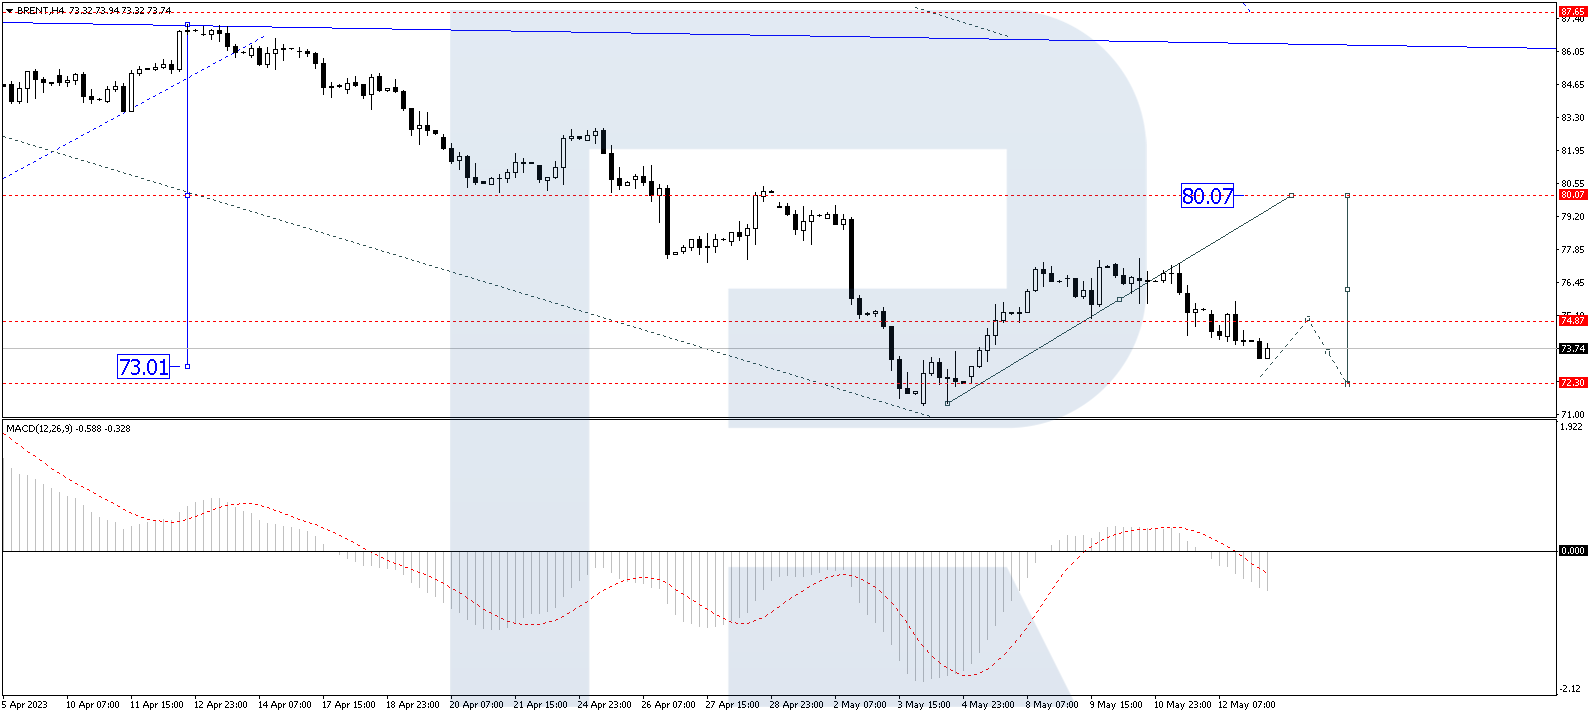
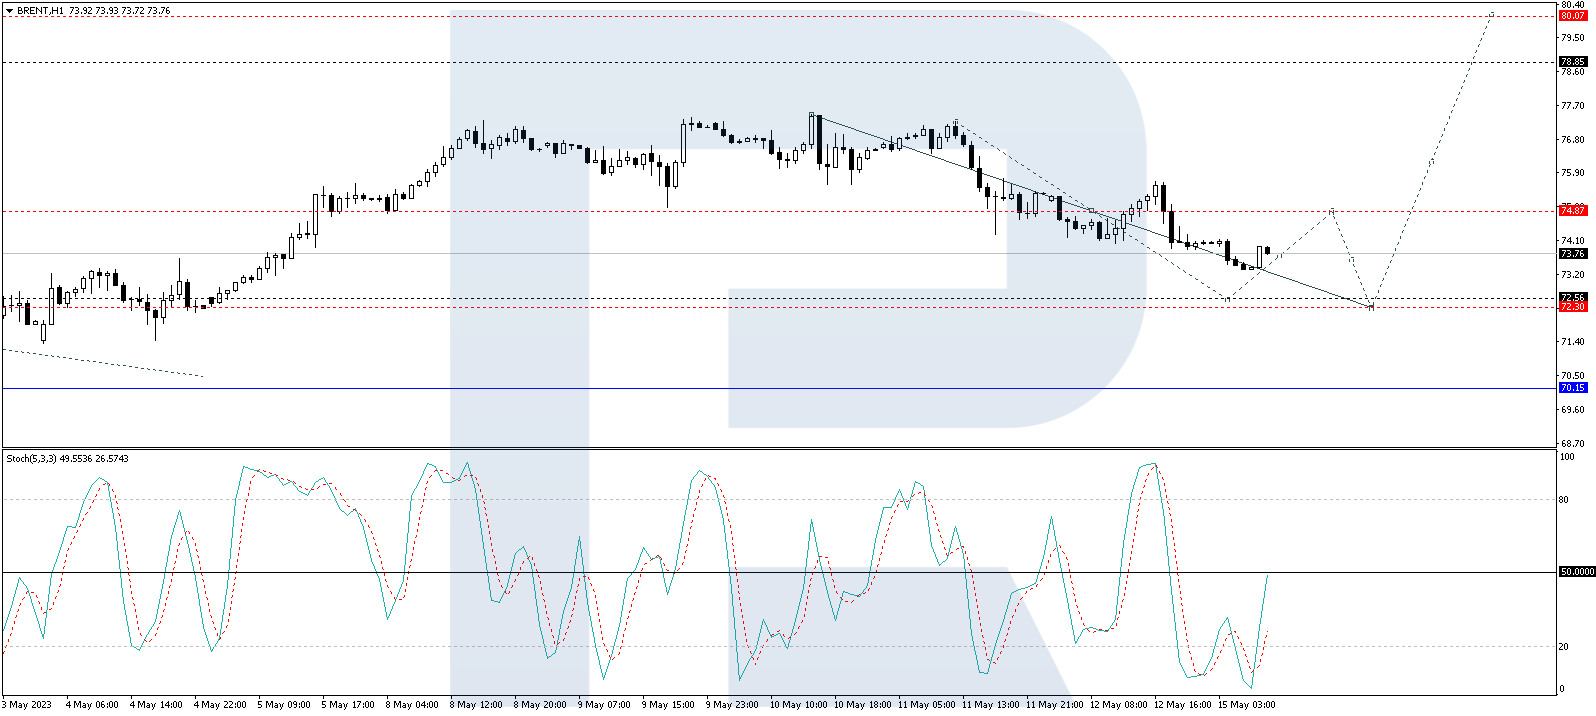
Oil fell by 1% Thursday as the dollar continued to rise on expectations of uncertainty in talks over a higher US government debt ceiling. The oil refineries in China in April increased by 18.9% compared to last year. Chinese refineries maintained a high growth rate to meet recovering domestic fuel demand and build stocks ahead of the summer tourist season.
The US dollar approached a six-month high against the yen on Friday amid rising US Treasury bond yields as uncertainty over debt ceiling talks in Washington raised expectations of higher interest rates. Gold has an inverse correlation to the dollar index and government bond yields, which is why it fell for a third straight day. But UBS analysts predict gold will reach $2,100 by the end of 2023 and $2,200 an ounce by March 2024, urging investors to keep the yellow metal in their portfolios.
Asian markets traded flat yesterday. Japan’s Nikkei 225 (JP225) gained 1.60% yesterday, China’s FTSE China A50 (CHA50) lost 0.26% over the day, Hong Kong’s Hang Seng (HK50) gained 0.85%, India’s NIFTY 50 (IND50) was 0.28% lower, while Australian S&P/ASX 200 (AU200) closed positive 0.52%.
Japan’s nationwide core consumer price index rose from 3.1% to 3.4% year-over-year, returning to 40-year highs after declining in the first quarter and foreshadowing increased pressure on the Bank of Japan to finally tighten policy this year.
Preliminary polls suggest that the Reserve Bank of New Zealand (RBNZ) will raise interest rates by another plus 0.25% at its May 24 meeting, but there will be a pause after that. The country’s largest banks, ANZ, ASB, Bank of New Zealand, Kiwi Bank, and Westpac, are also expecting a 25 basis point increase next week. Although the RBNZ was one of the first major global central banks to tighten monetary policy, inflation in the first quarter is still 6.7%, more than three times the RBNZ target of 2.0%.
S&P 500 (F) (US500) 4,198.05 +39.28 (+0.94%)
Dow Jones (US30)33,535.91 +115.14 (+0.34%)
DAX (DE40) 16,163.36 +212.06 (+1.33%)
FTSE 100 (UK100) 7,742.30 +19.07 (+0.25%)
USD Index 103.53 +0.65 +0.63%
- – New Zealand Trade Balance (m/m) at 01:45 (GMT+3);
- – Japan National Core Consumer Price Index at 02:30 (GMT+3);
- – Canada Retail Sales (m/m) at 15:30 (GMT+3);
- – US FOMC Member Williams Speaks at 15:45 (GMT+3);
- – US FOMC Member Bowman Speaks at 16:00 (GMT+3);
- – US Fed Chair Powell Speaks at 18:00 (GMT+3);
- – Eurozone ECB President Lagarde Speaks at 22:00 (GMT+3).
By JustMarkets
This article reflects a personal opinion and should not be interpreted as an investment advice, and/or offer, and/or a persistent request for carrying out financial transactions, and/or a guarantee, and/or a forecast of future events.