By InvestMacro
Here are the latest charts and statistics for the Commitment of Traders (COT) reports data published by the Commodities Futures Trading Commission (CFTC).
The latest COT data is updated through Tuesday June 20th and shows a quick view of how large traders (for-profit speculators and commercial hedgers) were positioned in the futures markets.
Weekly Speculator Changes led by Fed Funds & SOFR 3-Months
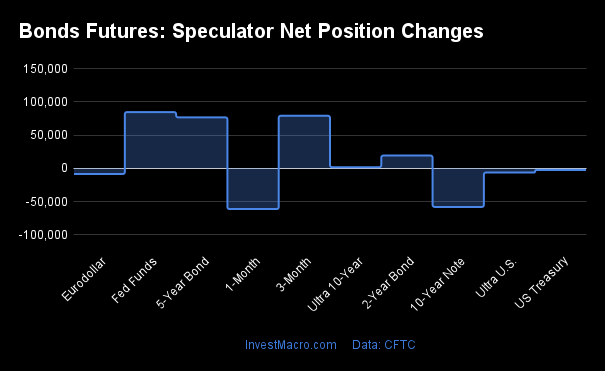
The COT bond market speculator bets were higher this week as five out of the nine bond markets we cover had higher positioning while the other four markets had lower speculator contracts.
Leading the gains for the bond markets was the Fed Funds (84,512 contracts) with the SOFR 3-Months (78,952 contracts), 5-Year Bonds (76,570 contracts), the 2-Year Bonds (19,169 contracts) and the Ultra 10-Year Bonds (1,640 contracts) also showing positive weeks.
The bond markets with declines in speculator bets for the week were the 10-Year Bonds (-58,144 contracts), the Ultra Treasury Bonds (-6,411 contracts), the Eurodollar (-8,627 contracts) and the US Treasury Bonds (-2,554 contracts) also registering lower bets on the week.
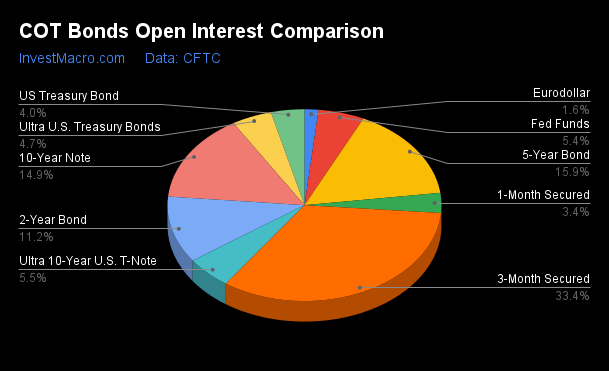
| Jun-13-2023 | OI | OI-Index | Spec-Net | Spec-Index | Com-Net | COM-Index | Smalls-Net | Smalls-Index |
|---|
| Eurodollar | 511,711 | 0 | -11,672 | 74 | 23,432 | 22 | -11,760 | 97 |
| FedFunds | 1,693,141 | 63 | -101,642 | 32 | 115,607 | 69 | -13,965 | 64 |
| 2-Year | 3,503,880 | 100 | -1,027,276 | 2 | 939,587 | 98 | 87,689 | 97 |
| Long T-Bond | 1,233,359 | 63 | -102,301 | 51 | 66,493 | 34 | 35,808 | 74 |
| 10-Year | 4,641,767 | 86 | -749,997 | 10 | 681,043 | 92 | 68,954 | 89 |
| 5-Year | 4,948,670 | 92 | -958,826 | 7 | 931,171 | 92 | 27,655 | 89 |
Strength Scores led by SOFR 3-Months & Eurodollar
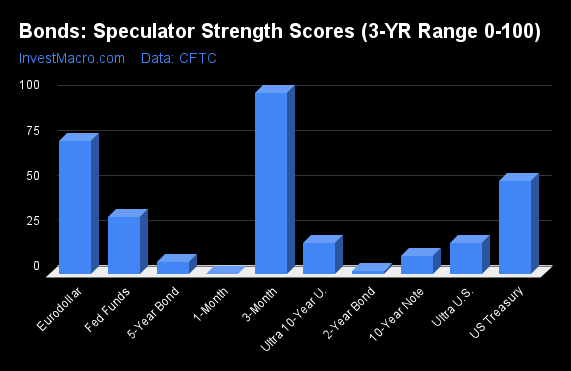
COT Strength Scores (a normalized measure of Speculator positions over a 3-Year range, from 0 to 100 where above 80 is Extreme-Bullish and below 20 is Extreme-Bearish) showed that the SOFR 3-Months (100 percent) and the Eurodollar (74 percent) lead the bond markets this week. The US Treasury Bonds (51 percent) comes in as the next highest in the weekly strength scores.
On the downside, the 2-Year Bonds (2 percent), the 5-Year Bonds (7 percent), the 10-Year Bonds (10 percent), Ultra 10-Year Bond (17.0 percent) and the Ultra Treasury Bonds (17 percent) come in at the lowest strength levels currently and are in Extreme-Bearish territory (below 20 percent).
Strength Statistics:
Fed Funds (31.6 percent) vs Fed Funds previous week (19.4 percent)
2-Year Bond (1.7 percent) vs 2-Year Bond previous week (0.0 percent)
5-Year Bond (6.8 percent) vs 5-Year Bond previous week (0.0 percent)
10-Year Bond (9.7 percent) vs 10-Year Bond previous week (15.4 percent)
Ultra 10-Year Bond (17.0 percent) vs Ultra 10-Year Bond previous week (16.7 percent)
US Treasury Bond (51.3 percent) vs US Treasury Bond previous week (52.1 percent)
Ultra US Treasury Bond (17.3 percent) vs Ultra US Treasury Bond previous week (20.0 percent)
Eurodollar (73.7 percent) vs Eurodollar previous week (74.0 percent)
SOFR 3-Months (100.0 percent) vs SOFR 3-Months previous week (94.2 percent)
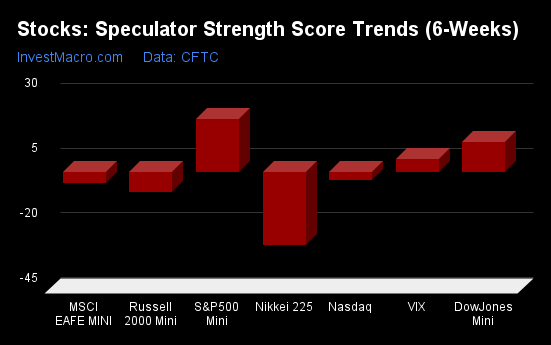
SOFR 3-Months & Ultra 10-Year Bonds top the 6-Week Strength Trends
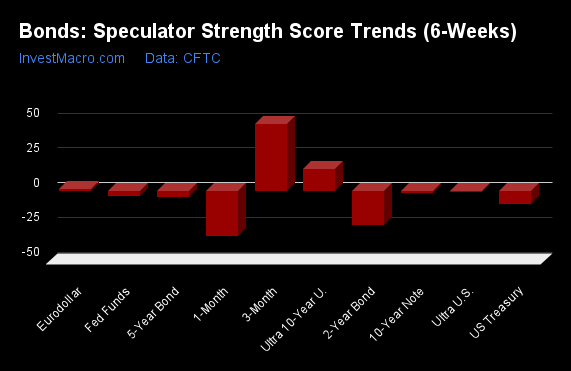
COT Strength Score Trends (or move index, calculates the 6-week changes in strength scores) showed that the SOFR 3-Months (48 percent) and the Ultra 10-Year Bonds (16 percent) lead the past six weeks trends for bonds. The Eurodollar (1 percent) and the are the next highest positive movers in the latest trends data.
The 2-Year Bonds (-25 percent) and the US Treasury Bonds (-10 percent) lead the downside trend scores currently with the 5-Year Bonds (-4 percent) and the Fed Funds (-4 percent) following next with lower trend scores.
Strength Trend Statistics:
Fed Funds (-3.8 percent) vs Fed Funds previous week (-21.1 percent)
2-Year Bond (-24.5 percent) vs 2-Year Bond previous week (-36.4 percent)
5-Year Bond (-4.3 percent) vs 5-Year Bond previous week (-11.1 percent)
10-Year Bond (-1.8 percent) vs 10-Year Bond previous week (5.6 percent)
Ultra 10-Year Bond (15.6 percent) vs Ultra 10-Year Bond previous week (16.7 percent)
US Treasury Bond (-9.5 percent) vs US Treasury Bond previous week (-3.4 percent)
Ultra US Treasury Bond (-1.2 percent) vs Ultra US Treasury Bond previous week (0.8 percent)
Eurodollar (1.1 percent) vs Eurodollar previous week (1.0 percent)
SOFR 3-Months (47.9 percent) vs SOFR 3-Months previous week (54.7 percent)
Individual Bond Markets:
3-Month Eurodollars Futures:
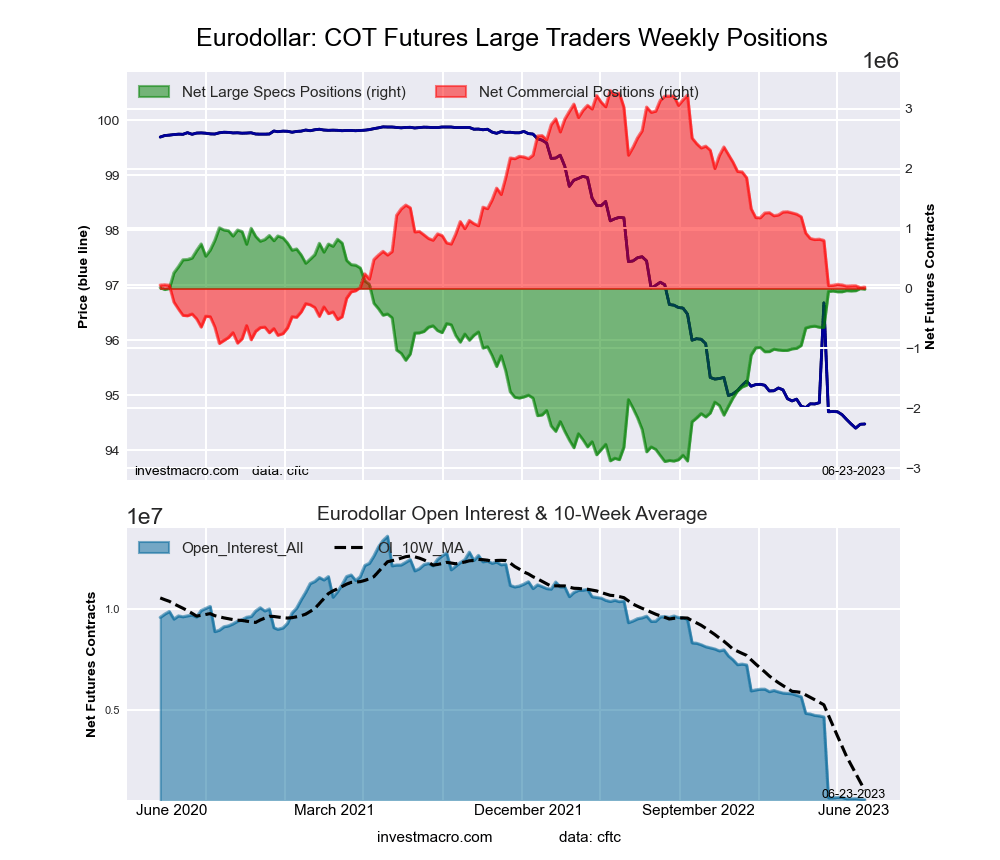 The 3-Month Eurodollars large speculator standing this week was a net position of -11,672 contracts in the data reported through Tuesday. This was a weekly fall of -8,627 contracts from the previous week which had a total of -3,045 net contracts.
This week’s current strength score (the trader positioning range over the past three years, measured from 0 to 100) shows the speculators are currently Bullish with a score of 73.7 percent. The commercials are Bearish with a score of 22.3 percent and the small traders (not shown in chart) are Bullish-Extreme with a score of 96.8 percent.
Price Trend-Following Model: Strong Downtrend
Our weekly trend-following model classifies the current market price position as: Strong Downtrend. The current action for the model is considered to be: Hold – Maintain Short Position.
| 3-Month Eurodollars Statistics | SPECULATORS | COMMERCIALS | SMALL TRADERS |
| – Percent of Open Interest Longs: | 23.1 | 67.2 | 9.0 |
| – Percent of Open Interest Shorts: | 25.4 | 62.6 | 11.3 |
| – Net Position: | -11,672 | 23,432 | -11,760 |
| – Gross Longs: | 118,404 | 343,978 | 45,860 |
| – Gross Shorts: | 130,076 | 320,546 | 57,620 |
| – Long to Short Ratio: | 0.9 to 1 | 1.1 to 1 | 0.8 to 1 |
| NET POSITION TREND: | | | |
| – Strength Index Score (3 Year Range Pct): | 73.7 | 22.3 | 96.8 |
| – Strength Index Reading (3 Year Range): | Bullish | Bearish | Bullish-Extreme |
| NET POSITION MOVEMENT INDEX: | | | |
| – 6-Week Change in Strength Index: | 1.1 | -1.0 | 0.1 |
Secured Overnight Financing Rate (3-Month) Futures:
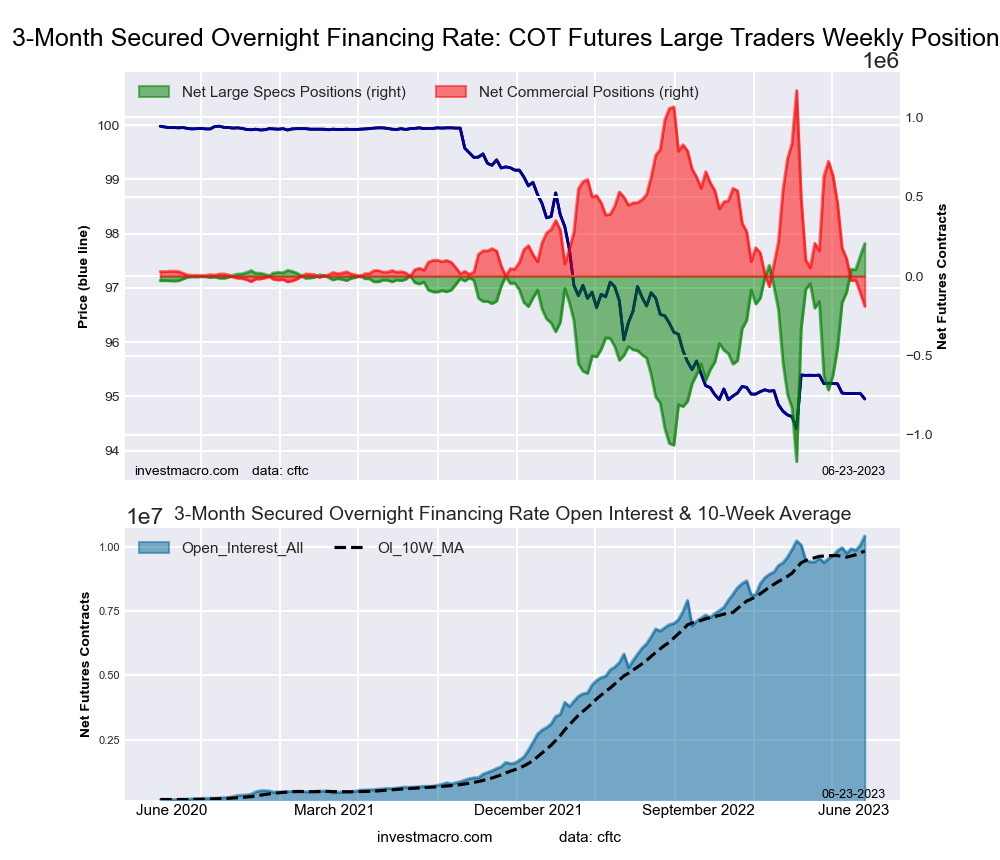 The Secured Overnight Financing Rate (3-Month) large speculator standing this week was a net position of 204,698 contracts in the data reported through Tuesday. This was a weekly boost of 78,952 contracts from the previous week which had a total of 125,746 net contracts.
This week’s current strength score (the trader positioning range over the past three years, measured from 0 to 100) shows the speculators are currently Bullish-Extreme with a score of 100.0 percent. The commercials are Bearish-Extreme with a score of 0.0 percent and the small traders (not shown in chart) are Bullish with a score of 79.7 percent.
Price Trend-Following Model: Weak Uptrend
Our weekly trend-following model classifies the current market price position as: Weak Uptrend. The current action for the model is considered to be: Hold – Maintain Long Position.
| SOFR 3-Months Statistics | SPECULATORS | COMMERCIALS | SMALL TRADERS |
| – Percent of Open Interest Longs: | 17.4 | 60.1 | 1.2 |
| – Percent of Open Interest Shorts: | 15.4 | 62.0 | 1.3 |
| – Net Position: | 204,698 | -189,803 | -14,895 |
| – Gross Longs: | 1,811,313 | 6,267,481 | 122,143 |
| – Gross Shorts: | 1,606,615 | 6,457,284 | 137,038 |
| – Long to Short Ratio: | 1.1 to 1 | 1.0 to 1 | 0.9 to 1 |
| NET POSITION TREND: | | | |
| – Strength Index Score (3 Year Range Pct): | 100.0 | 0.0 | 79.7 |
| – Strength Index Reading (3 Year Range): | Bullish-Extreme | Bearish-Extreme | Bullish |
| NET POSITION MOVEMENT INDEX: | | | |
| – 6-Week Change in Strength Index: | 47.9 | -47.7 | -5.6 |
30-Day Federal Funds Futures:
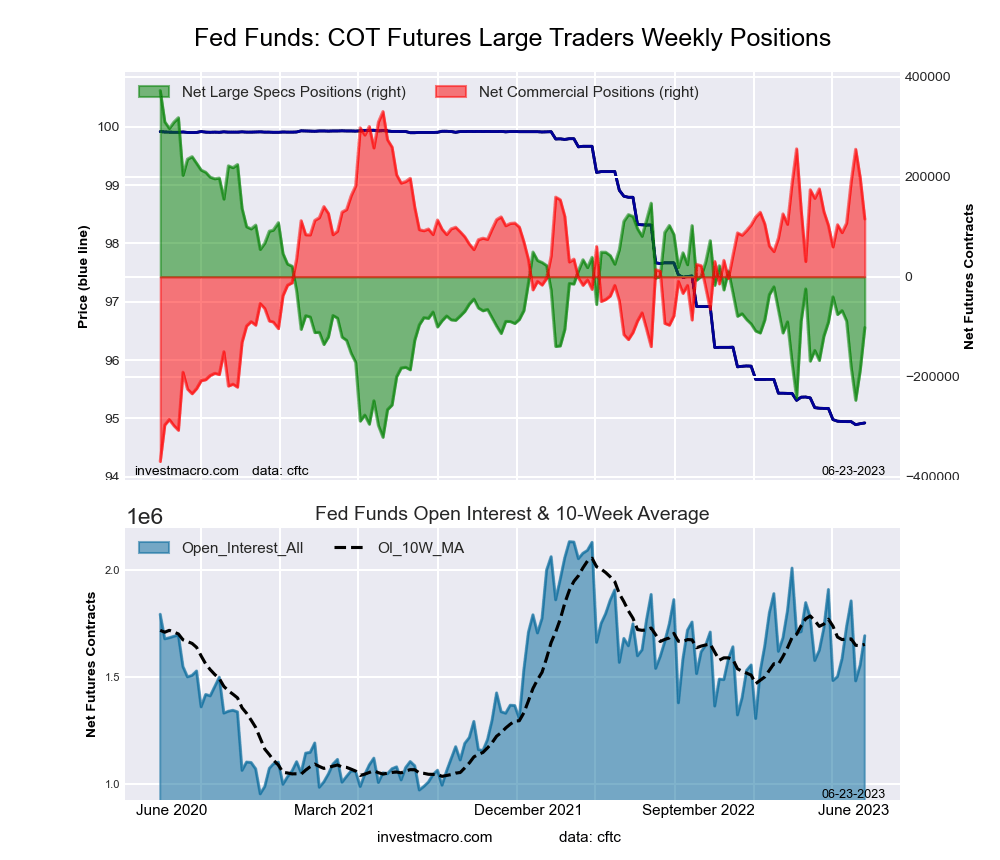 The 30-Day Federal Funds large speculator standing this week was a net position of -101,642 contracts in the data reported through Tuesday. This was a weekly boost of 84,512 contracts from the previous week which had a total of -186,154 net contracts.
This week’s current strength score (the trader positioning range over the past three years, measured from 0 to 100) shows the speculators are currently Bearish with a score of 31.6 percent. The commercials are Bullish with a score of 69.3 percent and the small traders (not shown in chart) are Bullish with a score of 63.6 percent.
Price Trend-Following Model: Downtrend
Our weekly trend-following model classifies the current market price position as: Downtrend. The current action for the model is considered to be: Hold – Maintain Short Position.
| 30-Day Federal Funds Statistics | SPECULATORS | COMMERCIALS | SMALL TRADERS |
| – Percent of Open Interest Longs: | 8.7 | 71.1 | 2.7 |
| – Percent of Open Interest Shorts: | 14.7 | 64.3 | 3.5 |
| – Net Position: | -101,642 | 115,607 | -13,965 |
| – Gross Longs: | 147,292 | 1,204,550 | 45,368 |
| – Gross Shorts: | 248,934 | 1,088,943 | 59,333 |
| – Long to Short Ratio: | 0.6 to 1 | 1.1 to 1 | 0.8 to 1 |
| NET POSITION TREND: | | | |
| – Strength Index Score (3 Year Range Pct): | 31.6 | 69.3 | 63.6 |
| – Strength Index Reading (3 Year Range): | Bearish | Bullish | Bullish |
| NET POSITION MOVEMENT INDEX: | | | |
| – 6-Week Change in Strength Index: | -3.8 | 1.6 | 29.0 |
2-Year Treasury Note Futures:
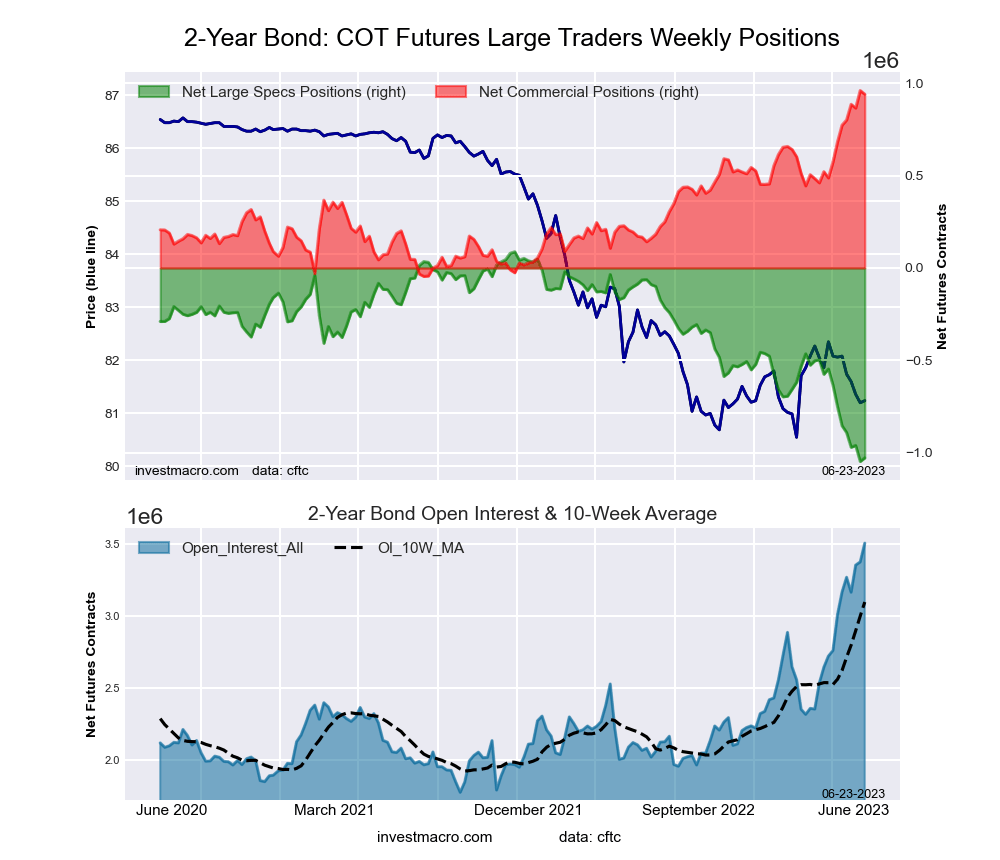 The 2-Year Treasury Note large speculator standing this week was a net position of -1,027,276 contracts in the data reported through Tuesday. This was a weekly boost of 19,169 contracts from the previous week which had a total of -1,046,445 net contracts.
This week’s current strength score (the trader positioning range over the past three years, measured from 0 to 100) shows the speculators are currently Bearish-Extreme with a score of 1.7 percent. The commercials are Bullish-Extreme with a score of 98.0 percent and the small traders (not shown in chart) are Bullish-Extreme with a score of 96.5 percent.
Price Trend-Following Model: Weak Uptrend
Our weekly trend-following model classifies the current market price position as: Weak Uptrend. The current action for the model is considered to be: Hold – Maintain Long Position.
| 2-Year Treasury Note Statistics | SPECULATORS | COMMERCIALS | SMALL TRADERS |
| – Percent of Open Interest Longs: | 11.6 | 80.9 | 7.0 |
| – Percent of Open Interest Shorts: | 40.9 | 54.1 | 4.5 |
| – Net Position: | -1,027,276 | 939,587 | 87,689 |
| – Gross Longs: | 406,848 | 2,836,230 | 244,127 |
| – Gross Shorts: | 1,434,124 | 1,896,643 | 156,438 |
| – Long to Short Ratio: | 0.3 to 1 | 1.5 to 1 | 1.6 to 1 |
| NET POSITION TREND: | | | |
| – Strength Index Score (3 Year Range Pct): | 1.7 | 98.0 | 96.5 |
| – Strength Index Reading (3 Year Range): | Bearish-Extreme | Bullish-Extreme | Bullish-Extreme |
| NET POSITION MOVEMENT INDEX: | | | |
| – 6-Week Change in Strength Index: | -24.5 | 25.7 | 9.0 |
5-Year Treasury Note Futures:
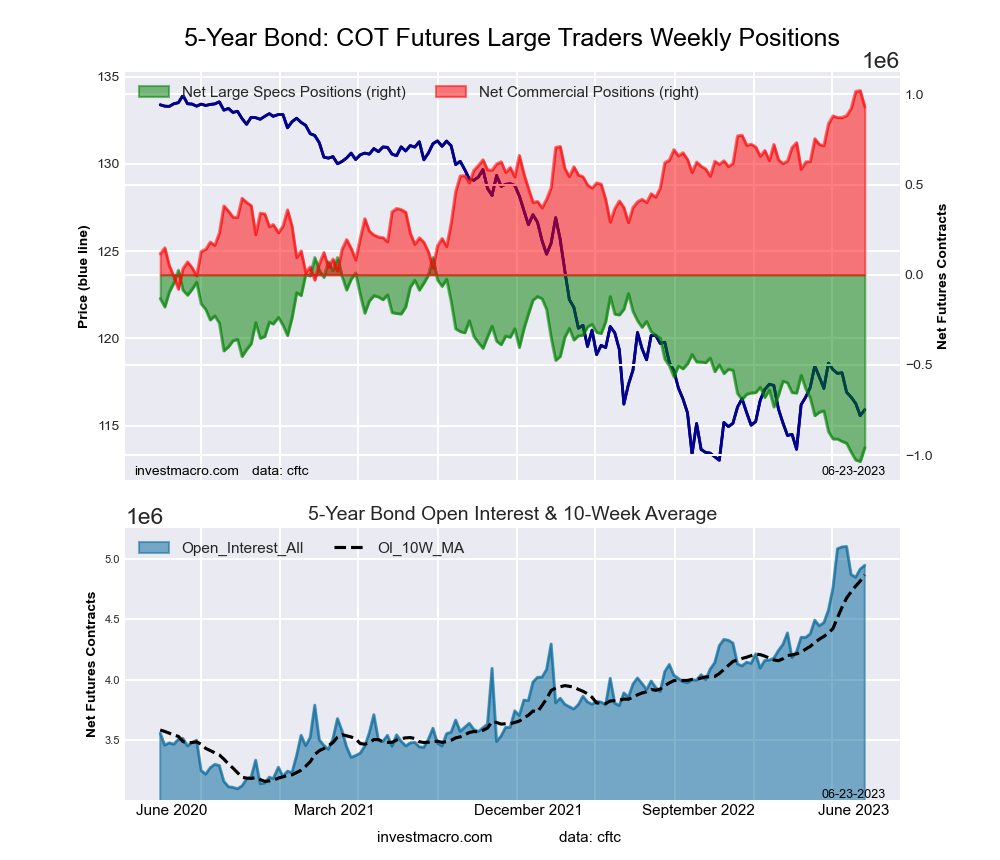 The 5-Year Treasury Note large speculator standing this week was a net position of -958,826 contracts in the data reported through Tuesday. This was a weekly boost of 76,570 contracts from the previous week which had a total of -1,035,396 net contracts.
This week’s current strength score (the trader positioning range over the past three years, measured from 0 to 100) shows the speculators are currently Bearish-Extreme with a score of 6.8 percent. The commercials are Bullish-Extreme with a score of 91.8 percent and the small traders (not shown in chart) are Bullish-Extreme with a score of 88.6 percent.
Price Trend-Following Model: Weak Uptrend
Our weekly trend-following model classifies the current market price position as: Weak Uptrend. The current action for the model is considered to be: Hold – Maintain Long Position.
| 5-Year Treasury Note Statistics | SPECULATORS | COMMERCIALS | SMALL TRADERS |
| – Percent of Open Interest Longs: | 8.0 | 83.4 | 7.3 |
| – Percent of Open Interest Shorts: | 27.3 | 64.6 | 6.8 |
| – Net Position: | -958,826 | 931,171 | 27,655 |
| – Gross Longs: | 394,457 | 4,129,490 | 363,566 |
| – Gross Shorts: | 1,353,283 | 3,198,319 | 335,911 |
| – Long to Short Ratio: | 0.3 to 1 | 1.3 to 1 | 1.1 to 1 |
| NET POSITION TREND: | | | |
| – Strength Index Score (3 Year Range Pct): | 6.8 | 91.8 | 88.6 |
| – Strength Index Reading (3 Year Range): | Bearish-Extreme | Bullish-Extreme | Bullish-Extreme |
| NET POSITION MOVEMENT INDEX: | | | |
| – 6-Week Change in Strength Index: | -4.3 | 5.3 | -2.9 |
10-Year Treasury Note Futures:
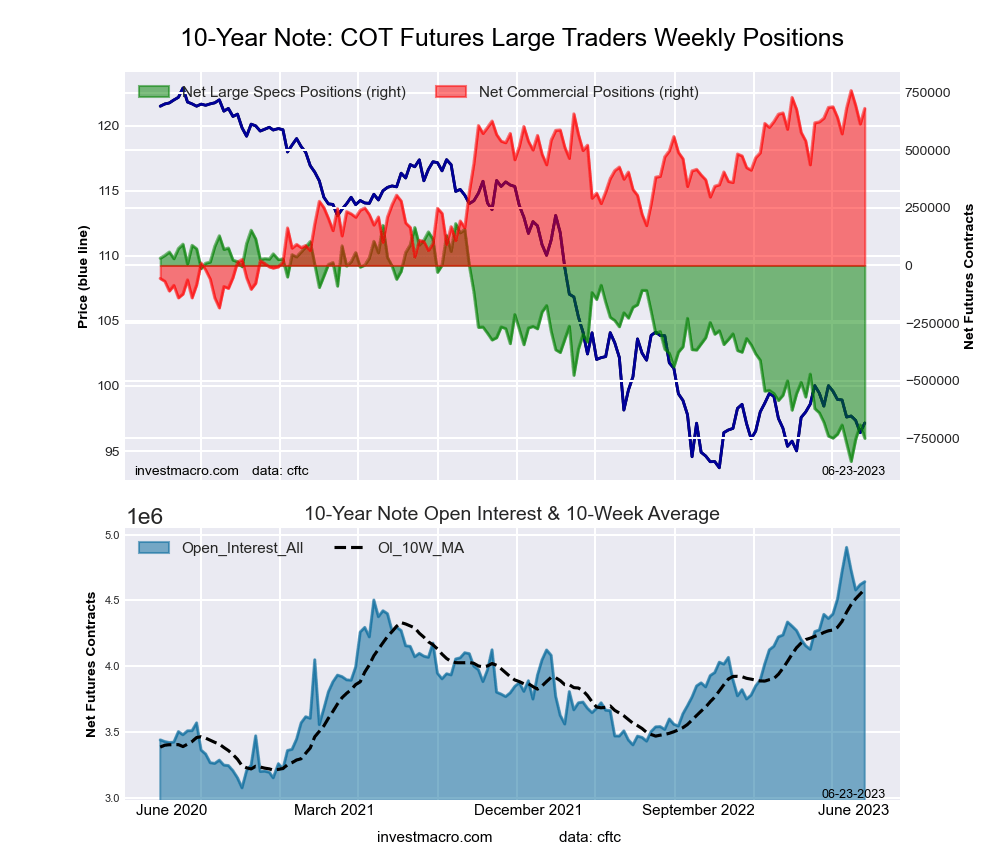 The 10-Year Treasury Note large speculator standing this week was a net position of -749,997 contracts in the data reported through Tuesday. This was a weekly reduction of -58,144 contracts from the previous week which had a total of -691,853 net contracts.
This week’s current strength score (the trader positioning range over the past three years, measured from 0 to 100) shows the speculators are currently Bearish-Extreme with a score of 9.7 percent. The commercials are Bullish-Extreme with a score of 91.8 percent and the small traders (not shown in chart) are Bullish-Extreme with a score of 88.5 percent.
Price Trend-Following Model: Weak Uptrend
Our weekly trend-following model classifies the current market price position as: Weak Uptrend. The current action for the model is considered to be: Hold – Maintain Long Position.
| 10-Year Treasury Note Statistics | SPECULATORS | COMMERCIALS | SMALL TRADERS |
| – Percent of Open Interest Longs: | 9.2 | 79.9 | 9.0 |
| – Percent of Open Interest Shorts: | 25.3 | 65.2 | 7.5 |
| – Net Position: | -749,997 | 681,043 | 68,954 |
| – Gross Longs: | 425,965 | 3,708,456 | 415,816 |
| – Gross Shorts: | 1,175,962 | 3,027,413 | 346,862 |
| – Long to Short Ratio: | 0.4 to 1 | 1.2 to 1 | 1.2 to 1 |
| NET POSITION TREND: | | | |
| – Strength Index Score (3 Year Range Pct): | 9.7 | 91.8 | 88.5 |
| – Strength Index Reading (3 Year Range): | Bearish-Extreme | Bullish-Extreme | Bullish-Extreme |
| NET POSITION MOVEMENT INDEX: | | | |
| – 6-Week Change in Strength Index: | -1.8 | 4.2 | -4.6 |
Ultra 10-Year Notes Futures:
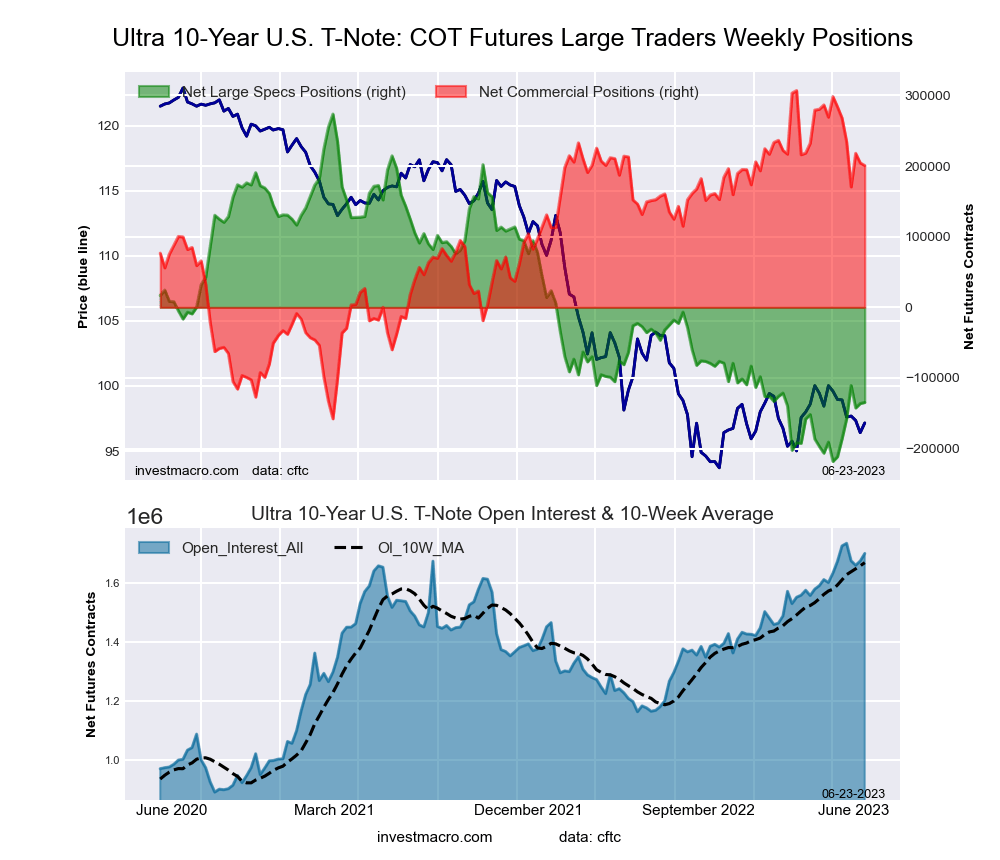 The Ultra 10-Year Notes large speculator standing this week was a net position of -134,686 contracts in the data reported through Tuesday. This was a weekly rise of 1,640 contracts from the previous week which had a total of -136,326 net contracts.
This week’s current strength score (the trader positioning range over the past three years, measured from 0 to 100) shows the speculators are currently Bearish-Extreme with a score of 17.0 percent. The commercials are Bullish with a score of 77.1 percent and the small traders (not shown in chart) are Bullish with a score of 74.8 percent.
Price Trend-Following Model: Weak Uptrend
Our weekly trend-following model classifies the current market price position as: Weak Uptrend. The current action for the model is considered to be: Hold – Maintain Long Position.
| Ultra 10-Year Notes Statistics | SPECULATORS | COMMERCIALS | SMALL TRADERS |
| – Percent of Open Interest Longs: | 10.5 | 76.8 | 11.3 |
| – Percent of Open Interest Shorts: | 18.5 | 65.0 | 15.1 |
| – Net Position: | -134,686 | 200,704 | -66,018 |
| – Gross Longs: | 179,226 | 1,306,770 | 191,631 |
| – Gross Shorts: | 313,912 | 1,106,066 | 257,649 |
| – Long to Short Ratio: | 0.6 to 1 | 1.2 to 1 | 0.7 to 1 |
| NET POSITION TREND: | | | |
| – Strength Index Score (3 Year Range Pct): | 17.0 | 77.1 | 74.8 |
| – Strength Index Reading (3 Year Range): | Bearish-Extreme | Bullish | Bullish |
| NET POSITION MOVEMENT INDEX: | | | |
| – 6-Week Change in Strength Index: | 15.6 | -17.9 | 3.7 |
US Treasury Bonds Futures:
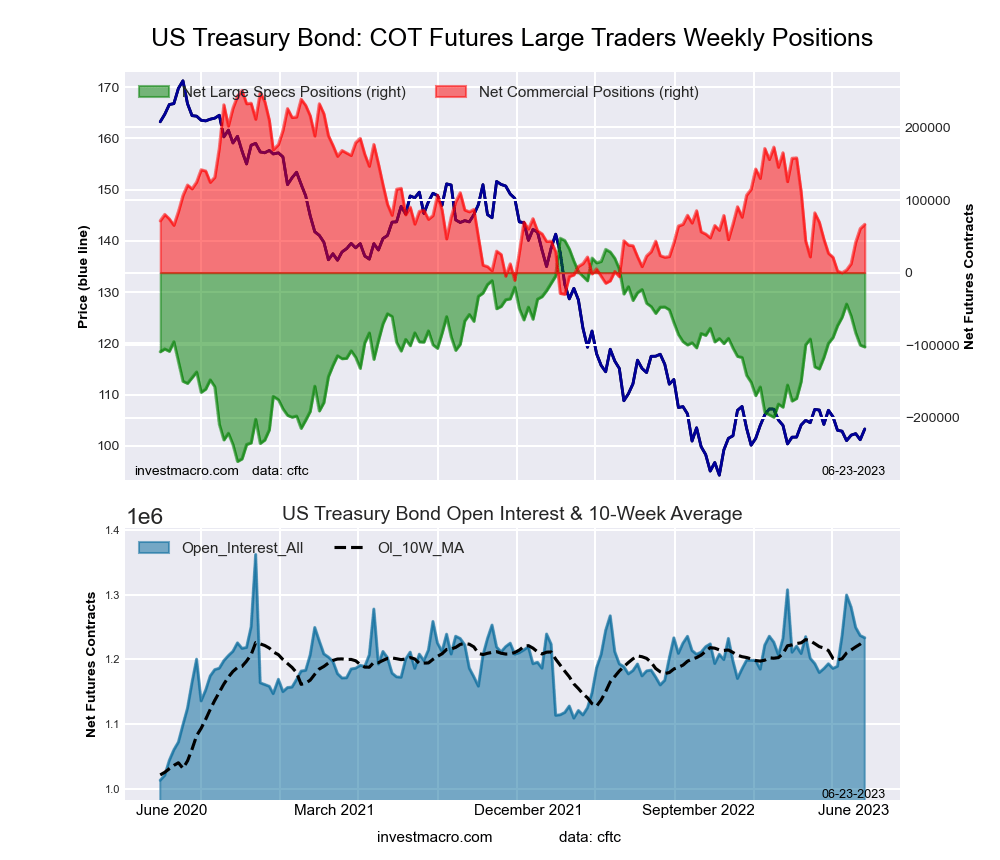 The US Treasury Bonds large speculator standing this week was a net position of -102,301 contracts in the data reported through Tuesday. This was a weekly decrease of -2,554 contracts from the previous week which had a total of -99,747 net contracts.
This week’s current strength score (the trader positioning range over the past three years, measured from 0 to 100) shows the speculators are currently Bullish with a score of 51.3 percent. The commercials are Bearish with a score of 34.3 percent and the small traders (not shown in chart) are Bullish with a score of 74.5 percent.
Price Trend-Following Model: Strong Downtrend
Our weekly trend-following model classifies the current market price position as: Strong Downtrend. The current action for the model is considered to be: Hold – Maintain Short Position.
| US Treasury Bonds Statistics | SPECULATORS | COMMERCIALS | SMALL TRADERS |
| – Percent of Open Interest Longs: | 7.3 | 77.3 | 14.5 |
| – Percent of Open Interest Shorts: | 15.6 | 71.9 | 11.6 |
| – Net Position: | -102,301 | 66,493 | 35,808 |
| – Gross Longs: | 89,659 | 952,842 | 178,917 |
| – Gross Shorts: | 191,960 | 886,349 | 143,109 |
| – Long to Short Ratio: | 0.5 to 1 | 1.1 to 1 | 1.3 to 1 |
| NET POSITION TREND: | | | |
| – Strength Index Score (3 Year Range Pct): | 51.3 | 34.3 | 74.5 |
| – Strength Index Reading (3 Year Range): | Bullish | Bearish | Bullish |
| NET POSITION MOVEMENT INDEX: | | | |
| – 6-Week Change in Strength Index: | -9.5 | 22.9 | -25.5 |
Ultra US Treasury Bonds Futures:
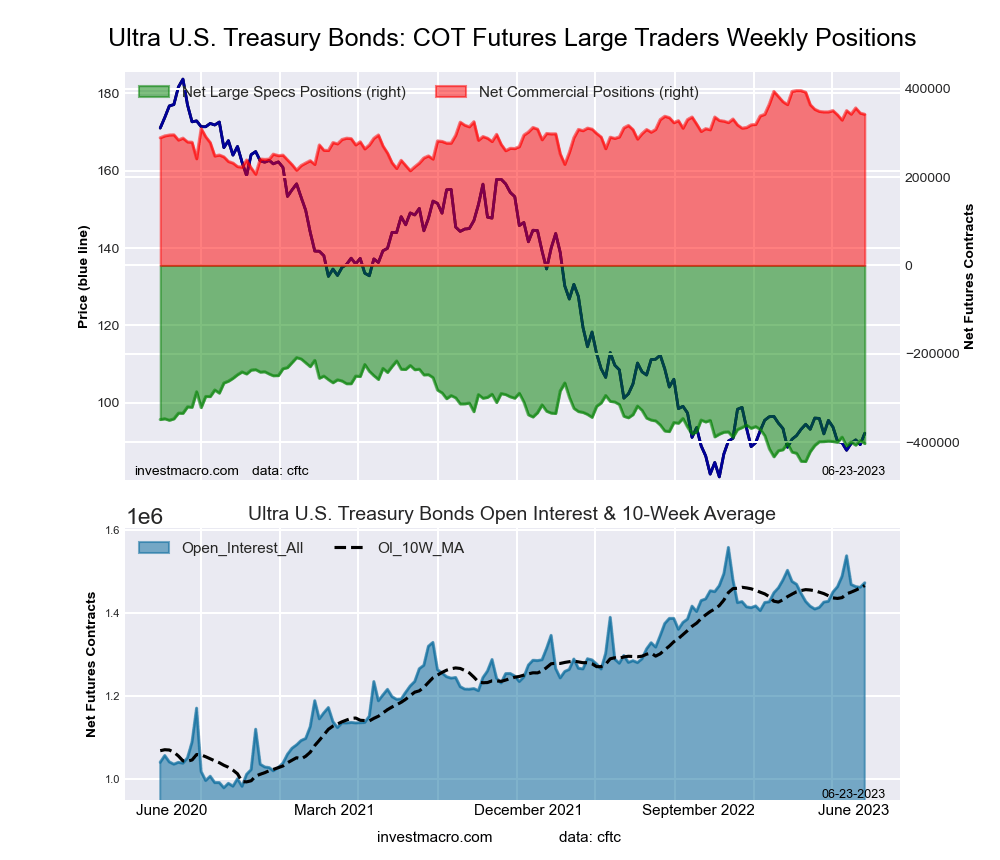 The Ultra US Treasury Bonds large speculator standing this week was a net position of -403,404 contracts in the data reported through Tuesday. This was a weekly lowering of -6,411 contracts from the previous week which had a total of -396,993 net contracts.
This week’s current strength score (the trader positioning range over the past three years, measured from 0 to 100) shows the speculators are currently Bearish-Extreme with a score of 17.3 percent. The commercials are Bullish with a score of 71.6 percent and the small traders (not shown in chart) are Bullish-Extreme with a score of 100.0 percent.
Price Trend-Following Model: Downtrend
Our weekly trend-following model classifies the current market price position as: Downtrend. The current action for the model is considered to be: Hold – Maintain Short Position.
| Ultra US Treasury Bonds Statistics | SPECULATORS | COMMERCIALS | SMALL TRADERS |
| – Percent of Open Interest Longs: | 5.6 | 82.3 | 11.7 |
| – Percent of Open Interest Shorts: | 33.0 | 59.1 | 7.5 |
| – Net Position: | -403,404 | 342,024 | 61,380 |
| – Gross Longs: | 82,695 | 1,212,061 | 172,397 |
| – Gross Shorts: | 486,099 | 870,037 | 111,017 |
| – Long to Short Ratio: | 0.2 to 1 | 1.4 to 1 | 1.6 to 1 |
| NET POSITION TREND: | | | |
| – Strength Index Score (3 Year Range Pct): | 17.3 | 71.6 | 100.0 |
| – Strength Index Reading (3 Year Range): | Bearish-Extreme | Bullish | Bullish-Extreme |
| NET POSITION MOVEMENT INDEX: | | | |
| – 6-Week Change in Strength Index: | -1.2 | 0.6 | 1.7 |
Article By InvestMacro – Receive our weekly COT Newsletter
*COT Report: The COT data, released weekly to the public each Friday, is updated through the most recent Tuesday (data is 3 days old) and shows a quick view of how large speculators or non-commercials (for-profit traders) were positioned in the futures markets.
The CFTC categorizes trader positions according to commercial hedgers (traders who use futures contracts for hedging as part of the business), non-commercials (large traders who speculate to realize trading profits) and nonreportable traders (usually small traders/speculators) as well as their open interest (contracts open in the market at time of reporting). See CFTC criteria here.


