Archive for Financial News – Page 187

What Will Happen to That $30 Trillion in U.S. Home Equity?

“It’s like someone turned off the faucet”

By Elliott Wave International

You probably remember the last big housing bust which began more than 15 years ago.

Elliott Wave International has observed that falling housing prices are generally preceded by a decline in home sales. The lag time may be some months, which was the case in the 2005-2006 timeframe.

Here’s what I mean: The December 2005 Elliott Wave Financial Forecast, a monthly publication which covers major U.S. financial markets, noted:

In October, home sales fell a larger-than-expected 2.7%. “It’s like someone turned off the faucet,”said a real estate agent.

The January 2006, Elliott Wave Financial Forecast provided an update:

Home sales are falling across the board now.

By mid-2006, U.S. home prices peaked, and a major housing bust followed.

Since the trough of that bust, U.S. home prices not only rebounded, but reached an all-time high in June 2022.

Yet, here in the late summer of 2023, homeowners may have a reason to worry. Here’s an Aug. 22 news item from bankrate.com:

Existing-home sales fall but prices still near record highs
Existing-home sales in July fell 2.2 percent, according to the National Association of Realtors. It’s a 16.6 percent decline from one year ago.

Given that prices are still near record highs, homeowners in the aggregate (at least for now) have a huge amount of equity.

As a Sept. 7 CNBC headline notes:

‘House-rich’ Americans are sitting on nearly $30 trillion in home equity. …

But, as we learned from the prior housing bust, change can sometimes be dramatic.

As a reminder, here’s a June 2011 news item (Cleveland.com):

Americans’ equity in their homes near a record low
The average homeowner now has 38 percent equity, down from 61 percent a decade ago.

Is another major housing bust just ahead?

Well, as Elliott Wave International has noted, the stock market and the housing market tend to be correlated.

So, if you’re wondering what’s ahead for housing, keep an eye on the main stock indexes.

An ideal way to do that is by performing Elliott wave analysis.

If you’re unfamiliar with Elliott wave analysis or simply need a refresher, read Frost & Prechter’s Elliott Wave Principle: Key to Market Behavior. Here’s a quote from this Wall Street classic:

If indeed markets are patterned, and if those patterns have a recognizable geometry, then regardless of the variations allowed, certain price and time relationships are likely to recur. In fact, experience shows that they do.

It is our practice to try to determine in advance where the next move will likely take the market. One advantage of setting a target is that it gives a sort of backdrop against which to monitor the market’s actual path. This way, you are alerted quickly when something is wrong and can shift your interpretation to a more appropriate one if the market does not do what you expect. The second advantage of choosing a target well in advance is that it prepares you psychologically for buying when others are selling out in despair, and selling when others are buying confidently in a euphoric environment.

If you’d like to read the entire online version of Elliott Wave Principle: Key to Market Behavior, you may do so for free once you become a member of Club EWI, the world’s largest Elliott wave educational community. A Club EWI membership is also free.

Join now by following this link: Elliott Wave Principle: Key to Market Behaviorget free and instant access.

This article was syndicated by Elliott Wave International and was originally published under the headline What Will Happen to That $30 Trillion in U.S. Home Equity?. EWI is the world’s largest market forecasting firm. Its staff of full-time analysts led by Chartered Market Technician Robert Prechter provides 24-hour-a-day market analysis to institutional and private investors around the world.


Fears of a real estate market crisis are growing again in China. ECB, following the Fed, plans to keep rates as long as possible

By JustMarkets

At yesterday’s close of the stock market, the Dow Jones Index (US30) increased by 0.13%, while the S&P 500 Index (US500) added 0.40%. The NASDAQ Technology Index (US100) closed positive by 0.45% on Monday. The 10-year bond yield rose to 4.523%, the highest since 2007. The hawkish attitude of the Fed representatives is also yielding results. In the current environment, risk assets (euro, British pound, stock indices) are likely to remain under pressure while the US dollar will continue to rise.

Fears of a US government shutdown continue to grow as Congress has yet to pass any spending bills needed to fund the government beyond October 1. Rating agency Moody’s said that while a US government shutdown would negatively impact the country’s creditworthiness, the economic impact would be short-term.

Amazon.com Inc (AMZN) said it will invest up to $4 billion in Anthropic, a company that develops generative artificial intelligence technologies, including chatbots based on large language models, such as ChatGPT, for Amazon Web Services customers. Alphabet Inc Class A (GOOGL) also owns about 10% of Anthropic after investing $300 million earlier this year.

Equity markets in Europe were mostly down on Monday. Germany’s DAX (DE40) decreased by 0.98%, France’s CAC 40 (FR40) fell by 0.85% yesterday, Spain’s IBEX 35 (ES35) lost 1.22%, and the UK’s FTSE 100 (UK100) closed down by 0.78%.

Germany’s IFO business climate index for September fell by 0.1 to 85.7, the lowest level in five months. According to analysts, Europe’s leading economy is at risk of a second recession in a year.

ECB spokesman Villeroy made several statements yesterday:

  • The ECB has growing confidence in achieving the 2% target by 2025;
  • The ECB should focus on persistence rather than raising rates;
  • There is also a risk of easing monetary policy too early.

So, the ECB is following in the steps of the US Fed and plans to keep rates high as long as possible. But if economic data starts to deteriorate sharply, policymakers are prepared to consider cutting rates if necessary.

The rally in the dollar index, which reached a 6-month high on Monday, depressed energy prices. And gasoline prices fell to a 3-week low. Crude oil prices were also falling due to concerns that the worsening debt crisis in China will worsen the Chinese economy and energy demand. However, oil price losses were limited by expectations that global oil supplies would remain tight.

Asian markets traded flat on Monday. Japan’s Nikkei 225 (JP225) added 0.85% for the day, China’s FTSE China A50 (CHA50) decreased by 0.67%, Hong Kong’s Hang Seng (HK50) lost 1.82%, and Australia’s ASX 200 (AU200) was positive 0.11% on Monday.

Economists have growing fears that a worsening real estate crisis in China will undermine the country’s economy. On Sunday, China Evergrande Group canceled a meeting with creditors and said it should review its restructuring plan. In addition, China Oceanwide Holdings Ltd. said it faces liquidation after a Bermuda court ordered the company into liquidation for defaulting on a $175 million loan principal payment. There are also growing fears that China Country Garden Holdings may default after breaching initial interest payment deadlines on dollar bonds.

The Japanese government the other day promised to issue a new economic package to “ease the pain of inflation,” which, paradoxically, is still “below target levels,” according to the Bank of Japan. The package will include measures to protect the Japanese from cost inflation (energy and product subsidies), support for wage and income growth (wages and salaries are also costs and demand inflation), support for investment to stimulate growth, measures to counter population decline, and encourage infrastructure investment.

S&P 500 (F)(US500) 4,337.51 +17.45 (+0.40%)

Dow Jones (US30) 34,007.21 +43.37 (+0.13%)

DAX (DE40)  15,405.49 −151.80 (−0.98%)

FTSE 100 (UK100) 7,623.99 −59.92 (−0.78%)

USD Index  105.96 +0.37 (+0.35%)

News feed for 2023.09.25:
  • – US FOMC Member Kashkari Speaks at 01:00 (GMT+3);
  • – US CB Consumer Confidence (m/m) at 17:00 (GMT+3);
  • – US New Home Sales (m/m) at 17:00 (GMT+3);
  • – US FOMC Member Bowman Speaks at 20:30 (GMT+3).

By JustMarkets


This article reflects a personal opinion and should not be interpreted as an investment advice, and/or offer, and/or a persistent request for carrying out financial transactions, and/or a guarantee, and/or a forecast of future events.

Oil bulls: Not done yet?

By ForexTime

  • Crude oil now pulling back from year-to-date high
  • $90 psychological region tested for support now
  • Daily close below 21-day EMA may invite more declines
  • Elliot Wave theory suggests more eventual room for gains


Oil bulls (those hoping prices will move higher) may just be taking a breather for the moment.

Prices of US crude have pulled back since reaching the year-to-date high at $93.59 on September 19th, but this may be short-lived.

The decline from this swing high was likely due to a couple of factors:

  •  a bounce off the upward rising channel’s resistance which has been tested three times since the rally starting from June 7th, 2023.
  • a technical pullback, after its 14-day relative strength has been in “overbought” territory (above the 70 threshold) for the two weeks prior

Notably, Crude is now testing the psychologically-important $90/bbl level for immediate support.

The 23.6 Fibonacci retracement level also sits close by, at $89.92, to potentially lend stronger support.


Potential support ahead

Crude oil prices are currently still above, albeit declining, towards it’s 21-day EMA.

A continued decline could see bears take advantage of this reversion to its mean to potentially test the following key support levels:

  • $88.31: 21-Day EMA
  • $87.65:38.2 Fib ratio
  • $85.81: bottom upward ascending channel trendline, also the 50 Fib ratio line

The Fibonacci retracement tool is applied to the daily time frame from 24th August’ low at $78.04 to the year- to- dates high.

More upside for Crude? Elliot Wave theory says “yes”

Taking Elliot wave count into consideration, crude oil has yet to complete the 3rd impulse move from wave 2’s termination at the $78.04 lows.

This suggests that Crude prices must reach at least $95.81, or potentially even break above the psychologically-important $100/bbl line, before the 3rd impulse move is deemed “complete.

In short, adhering to the Elliot Wave theory, this suggests there should be more near-term gains ahead for Crude oil.


Forex-Time-LogoArticle by ForexTime

ForexTime Ltd (FXTM) is an award winning international online forex broker regulated by CySEC 185/12 www.forextime.com

RoboMarkets Integrates with TradingView to Enhance Trading Opportunities

RoboMarkets, a European broker company, announces its integration with TradingView, a leading platform for charts and analysis. RoboMarkets clients can now implement their trading strategies on TradingView and analyse their performance with a wide range of charting and analysis tools.

Through this integration, RoboMarkets products are made available to a broader audience, including investors who rely on cutting-edge analytics tools to identify opportunities when opening new positions. The goal of this partnership is to provide a seamless and superior trading experience. RoboMarkets clients can now simply connect their accounts to TradingView and trade direclty on the platform, eliminating the need to switch between terminals. Users who do not have an active trading account can open one and instantly link it to TradingView through a user-friendly interface.

TradingView is a platform for charting and trading, enabling users to conduct technical and fundamental analysis with user-friendly tools, while also communicating with each other through the largest social network for investors. Thanks to the integration with TradingView, RoboMarkets clients can now access various advanced analysis tools, including charting tools, market data and technical indicators. Furthermore, they can explore new strategies tested by millions of active traders in TradingView’s fast-growing global community.

About RoboMarkets

RoboMarkets is a financial broker company operating under CySEC license № 191/13. RoboMarkets offers investment services in many European countries and provides traders working in financial markets with access to its proprietary platforms. Visit www.robomarkets.com to learn more about the company’s products and business.

About Tradingview

TradingView is the world’s leading charting platform and a vibrant community used by over 50 million traders around the globe. TradingView empowers its users with best-in-class charting tools, live market data, a comprehensive analytical suite, and trading integrations with selected partners.

It is a unique space where market enthusiasts can chart, chat and trade in one place. Whether you are a crypto advocate interested in btc usd, a forex trader following the dxy index, or a value investor looking for hidden gems with a stock screener — TradingView stores perks and benefits for everyone.

Beyond premier user experience, TradingView provides solutions for businesses, including advertising, news partnerships, market widgets, charting libraries, and broker integrations.

“Risk Warning: CFDs are complex instruments and come with a high risk of losing money rapidly due to leverage. 69.88% of retail investor accounts lose money when trading CFDs with this provider. You should consider whether you understand how CFDs work and whether you can afford to take the high risk of losing your money.”

Yen’s Downward Trajectory Continues as Market Anticipates BOJ’s Move

By RoboForex Analytical Department

The USD/JPY pair is drawing nearer to the closely watched 150.00 level, currently experiencing most of its activity around 148.40, as of Monday. The market remains in anticipation of potential financial interventions from the Bank of Japan (BOJ). The BOJ has maintained its ultra-accommodative monetary policy, leaving the yen lingering near ten-month lows.

Last Friday, the BOJ opted to sustain the negative interest rate at -0.10% per annum. The Governor of the central bank highlighted the necessity for additional time to scrutinize the economy and assess the data. For currency market participants and those observing the yen exchange rate, the key concern is not the rate decision per se, but the absence of indications regarding any alterations in the monetary policy framework.

USD/JPY currency pair technical analysis

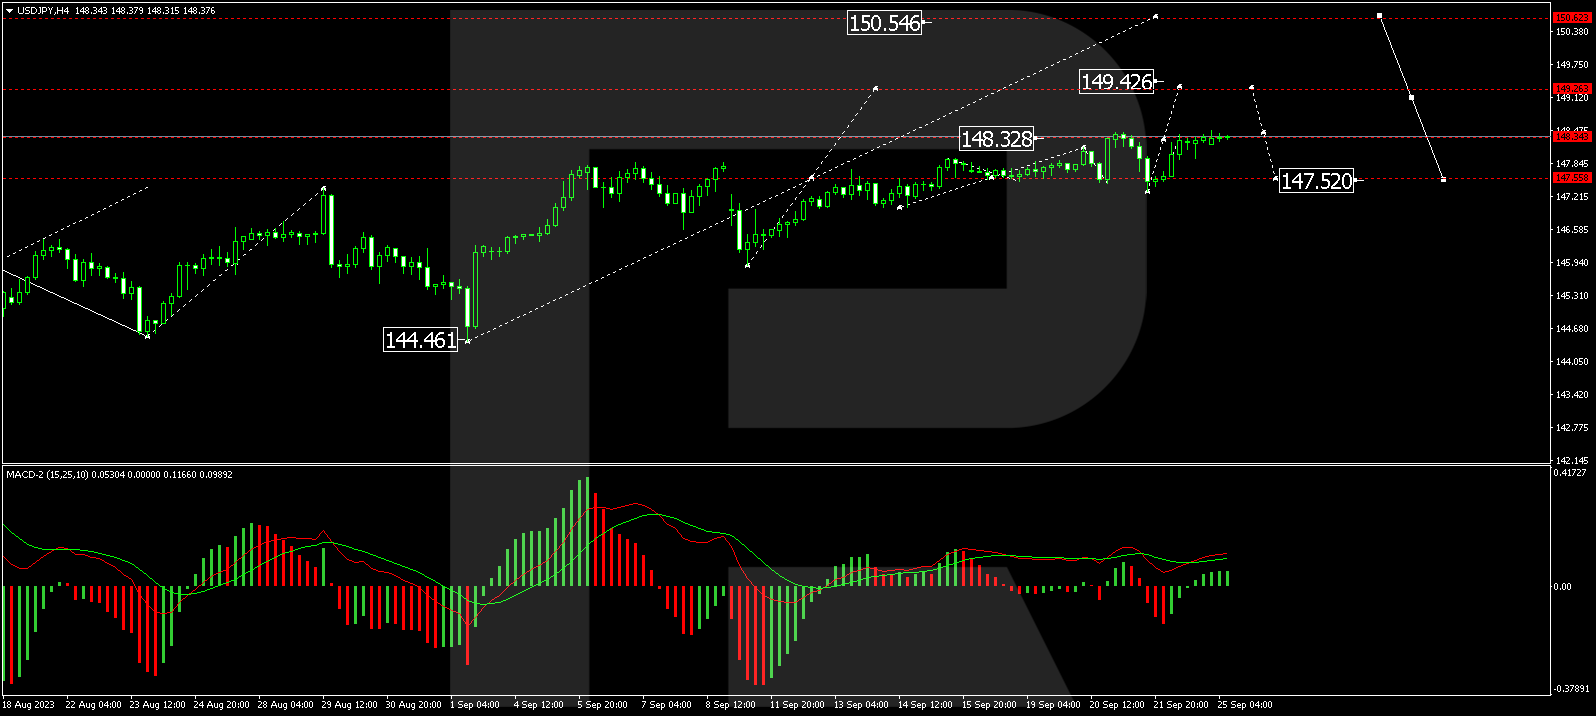
The H4 chart illustrates that USD/JPY has reached the projected target of a growth wave at 148.44 and underwent a correction to 147.33. The market has finalized a growth structure to 148.47 and is currently forming a consolidation range beneath this level. An upward breakout is anticipated, with the price potentially advancing to 149.42. Upon reaching this level, a correction to 148.44 may occur, followed by a rise to 150.50. The MACD oscillator substantiates this scenario, with its signal line positioned above zero and pointing strictly upwards.

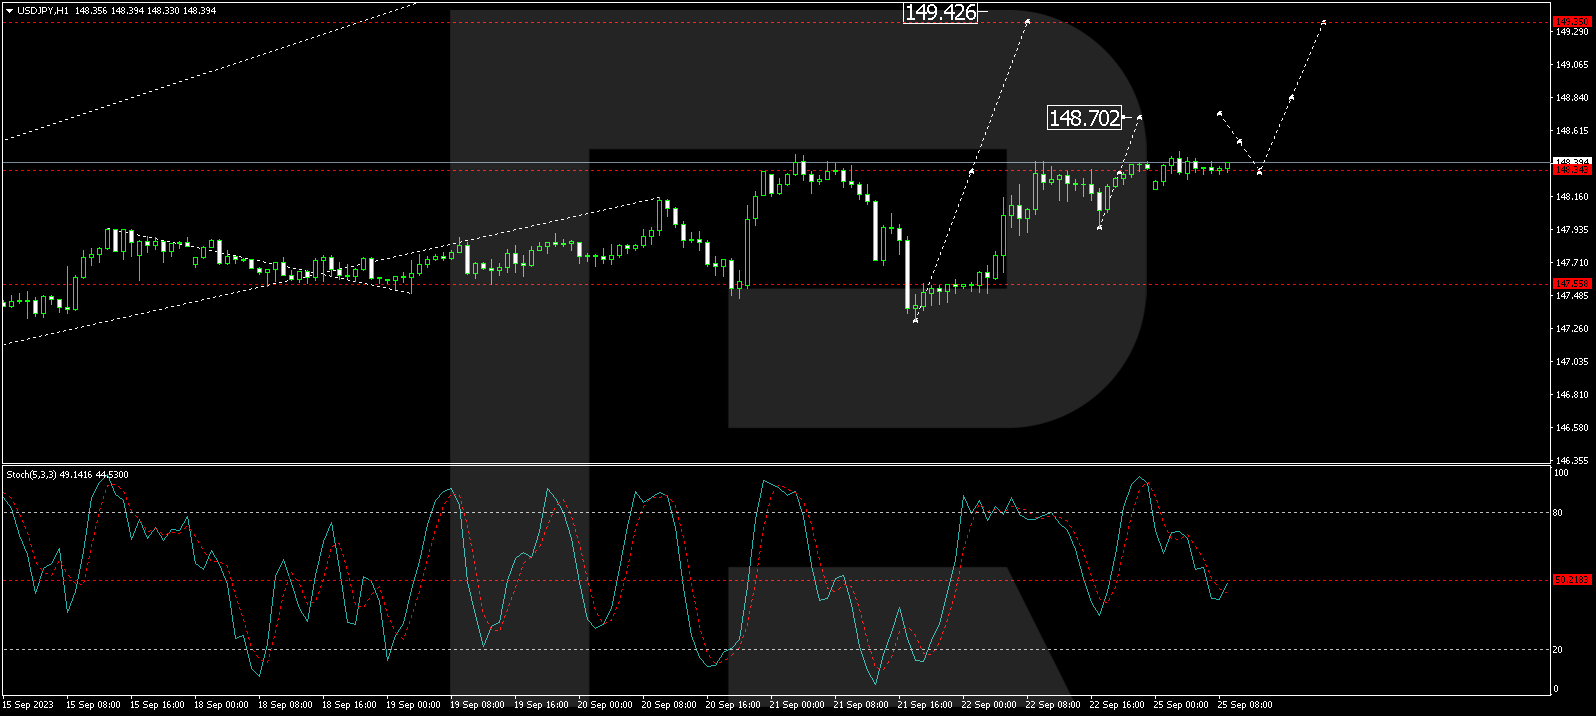
On the H1 chart, a consolidation range has emerged around 148.33. The market is currently on an upward trajectory, aiming for 148.70, with the potential to extend to 149.90. The Stochastic oscillator confirms this scenario, as its signal line, having rebounded from 50, is directed strictly upwards.

The yen continues its descent, with market participants keenly observing any signs of change in the BOJ’s monetary policy framework. Technical analysis suggests potential further growth for USD/JPY, but traders will closely watch for developments and adjust their positions accordingly.

Disclaimer

Any forecasts contained herein are based on the author’s particular opinion. This analysis may not be treated as trading advice. RoboForex bears no responsibility for trading results based on trading recommendations and reviews contained herein.

FOMC representatives maintain “hawkish” positions. Inflationary pressures are easing in Singapore

By JustMarkets

At the close of the stock market on Friday, the Dow Jones Index (US30) decreased by 0.31% (-1.87% for the week), and the S&P 500 Index (US500) was down by 0.23% (-2.81% for the week). The NASDAQ Technology Index (US100) closed negative by 0.09% (-3.35% for the week). On Friday, hawkish comments from several FOMC policymakers supported the dollar, which was a negative factor for stock indices. In addition, a bullish factor for the dollar was the US manufacturing PMI data released on Friday. The US manufacturing PMI for September rose by 1.0 to 48.9, exceeding expectations of 48.2.

San Francisco Fed Chairwoman Daley said Friday she was not ready to declare victory in the fight against inflation and said inflation is unlikely to reach the Fed’s 2% target in 2024. Kansas Fed Chair Michelle Bowman said the same thing, only in different words, “I continue to expect that further rate increases are likely to be needed to return inflation to 2% in a timely manner.” FRB Boston President Collins said, “I expect that rates may need to be raised longer than previously thought, and further tightening is certainly not out of the question.”

According to EPFR Global, outflows from global equity funds totaled $16.9 billion for the week ended September 20, the highest in 9 months. Bank of America said investors are fleeing equities due to the prospect of higher interest rates for an extended period of time.

Equity markets in Europe were mostly down on Friday. Germany’s DAX (DE40) was down by 0.09% (week-to-date -1.90%), France’s CAC 40 (FR 40) fell by 0.40% (week-to-date -2.29%) on Friday, Spain’s IBEX 35 (ES35) was down by 0.49% (week-to-date -0.30%), and the UK’s FTSE 100 (UK100) closed up by 0.07% (week-to-date -0.36%).

The EUR/USD pair has continued its steady decline since mid-July. This trend was primarily due to the contrasting economic performance of the US and Eurozone, as well as differences in the monetary policies pursued by the central banks of these countries. In recent days, these differences have pushed US Treasury yields to multi-year highs across all maturities. The Fed’s benchmark rate currently stands at 5.50%, well ahead of the European Central Bank’s 4.5% rate. This gap could widen further in the coming months as US borrowing costs could rise another 25 basis points in 2023, while the ECB has signaled that its policy tightening campaign is over.

UK private companies are cutting the number of workers at the fastest pace since the pandemic and deep financial crisis, confirming the Bank of England’s decision to pause interest rate hikes for the first time in nearly two years. S&P Global’s composite purchasing managers’ index fell to 46.8 in September from 48.6 a month earlier, the sharpest decline in output since January 2021, when the UK was in lockdown. The reading was worse than economists had expected and sent the private sector deeper into contraction.

Precious metals prices closed moderately higher on Friday, with silver posting a two-week-high. A decline in T-note yields on Friday provided support for precious metals. Silver was also supported by a stronger-than-expected US manufacturing PMI report from S&P, which was positive for industrial metals demand.

Asian markets were mostly down last week. Japan’s Nikkei 225 (JP225) fell by 3.07% for the week, China’s FTSE China A50 (CHA50) gained 0.54%, Hong Kong’s Hang Seng (HK50) ended the week down by 0.06%, and Australia’s ASX 200 (AU200) ended the week negative 2.89%.

Singapore’s Consumer Price Index fell to 3.4% from 3.8%, better than the expected 3.5%. Core inflation (excluding food and energy prices) fell from 4.1% to 4.0%, which was in line with forecasts. With inflation slowing and GDP growth having a weak outlook, economists generally expect the Central Bank of Singapore (MAS) to leave monetary policy settings unchanged during its scheduled meeting next month.

S&P 500 (F)(US500) 4,320.06 −9.94 (−0.23%)

Dow Jones (US30) 33,963.84 −106.58 (−0.31%)

DAX (DE40)  15,557.29 −14.57 (−0.094%)

FTSE 100 (UK100) 7,683.91 +5.29 (+0.07%)

USD Index  105.58 +0.22 (+0.21%)

News feed for 2023.09.25:
  • – Singapore Consumer Price Index (m/m) at 08:00 (GMT+3);
  • – Eurozone German IFO Business Climate (m/m) at 11:00 (GMT+3);
  • – Eurozone ECB President Lagarde Speaks at 16:00 (GMT+3).

By JustMarkets


This article reflects a personal opinion and should not be interpreted as an investment advice, and/or offer, and/or a persistent request for carrying out financial transactions, and/or a guarantee, and/or a forecast of future events.

Copper Is About To Soar

Source: Michael Ballanger  (9/21/23)

Michael Ballanger of GGM Advisory Inc. explains why he believes copper is about to soar, as well as lithium and uranium, and shares some stocks he believes should be on your radar.

To repeat a theme that I will maintain for most of the next seven years (the decade), three components of the electrification movement will need to grow exponentially in order to meet the demand associated with this transition: More clean energy (nuclear); more transmission infrastructure (copper), and increased electrical storage capacity (lithium).

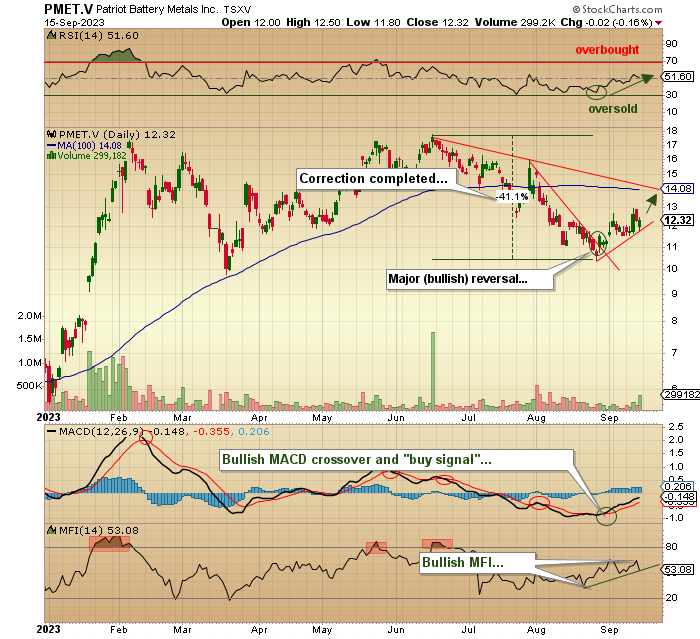
The lithium sector has been the savior of resource brokers and fund managers for most of the past three years. Using the chart of hard rock miner Patriot Battery Metals Inc. (PMET:CA), it appears as though the summer correction that hammered the bulk of the lithium miners has ended. I cannot tell whether it is going to last for very long, but short term, the runway looks clear.

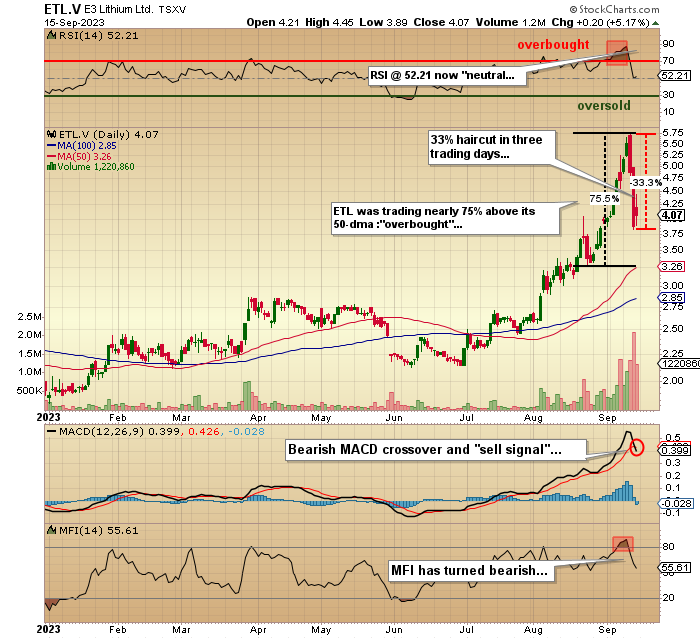
The lithium “briners,” which have been a completely different story this summer, had a much-needed correction last week as the lead “briner,” E3 Lithium Ltd. (ETL:TSXV;EEMMF:US) lost a third of its value in three trading sessions after peaking at a CA$400m market cap at $5.72.

That dragged my top pick for 2023, Volt Lithium Corp. (VLT:TSV;VLTLF:US), down as well from a recovery high at CA$.395 to close out the week at $0.315.

Despite the setback, the “briners” will achieve free cash flow objectives a lot sooner than will the “miners,” but with all of the automotive money flooding into “miner projects,” I cannot see any of the lithium space players being left out of the demand-led rally that should last until at least 2030. I am inclined to invest heavily in the ones with the lowest current market cap, where management has demonstrated the ability to execute. The market caps of the three mentioned here are:

  • Patriot Battery Metals: CA$1.3 billion
  • E3 Lithium Ltd. CA$274 million
  • Volt Lithium Corp. CA$31 million

Uranium prices tapped US$62/pound this week, which sent most of the companies friendly to nuclear power on a tear. The Sprott Uranium Miners ETF (URNM::NYSE ARCA) is now up over 40% YTD, versus the NASDAQ up 30% and the S&P up 16%.

Cameco Corp. (CCO:TSX; CCJ:NYSE), the world’s biggest uranium miner, is up 77% YTD, while my personal holding Western Uranium & Vanadium Corp. (WUC:CSE; WSTRF:OTCQX) closed at $1.62, ahead 37% YTD and still well below the peaks in 2018 (CAD $3.40) and 2021 ($4.25).

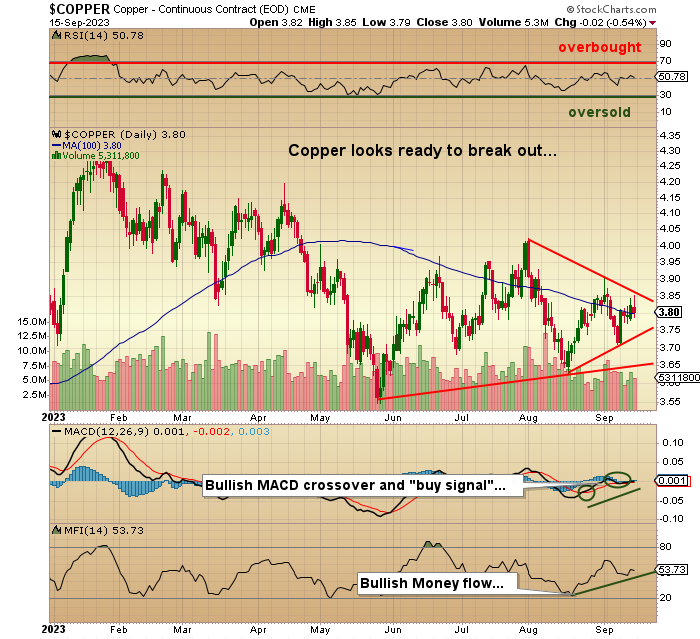
With lithium and uranium now solidly ahead for the year, one has to wonder when the last component of the “electrification trilogy” — copper — will catch the attention of the big multinational trading houses.

With most of the large copper deposits around the globe now on descending production slopes and with few new discoveries coming onstream, even finite copper demand over the balance of the decade will be enough to affect price in a huge way. However, copper demand is not going to be “finite.” it is going through the roof, and that is with or without China.

The copper bears cite “weak China growth” as a reason for anemic copper prices, but one thing is certain: if you fire up fifty-seven new nuclear reactors around the world, creating several hundred million new megawatts of electricity, you are going to need a much larger transmission infrastructure which means wires and unless they find a way to transmit current more efficiently using a substance other than copper wiring, then copper is going to move into “shortage” at some point and when that point arrives, prices will explode.

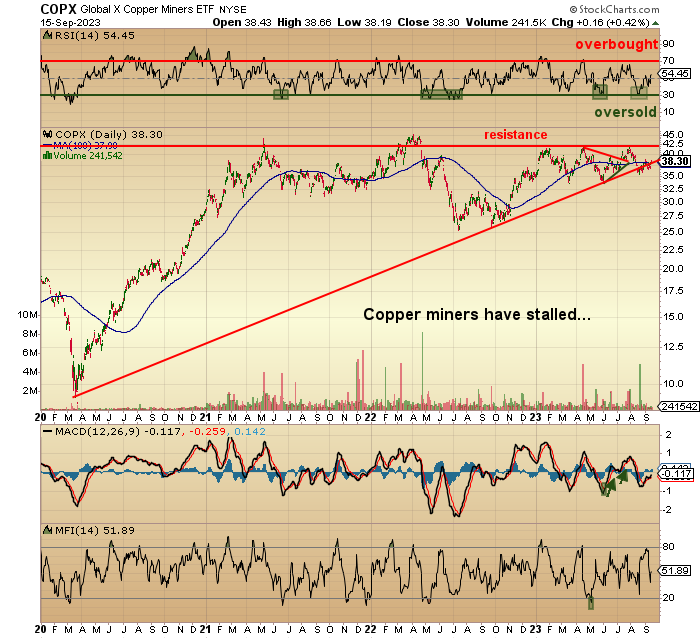
The Copper Miners ETF (COPX:US) has come a long way off the COVID-19 CRASH lows, but tops in the US$42-43 range have not been revisited because of the waffling copper price. If I own uranium and lithium stocks, which I do because I am a fervent believer in the electrification movement, then I cannot construct a portfolio without copper.

Now, copper is seen by many as a boring, unexciting sector with very few junior copper deals commanding much (if any) attention. It may be that copper mining is seen as environmentally hostile to the spirit and soul of the electrification movement and thus shunned by the “woke” community of newbie investors.

I would answer that by pointing to the Energy ETF (XLE:US), up over 27% YTD with many of the components carrying P/E’s of around 8. As socially and politically “uncool” as oil and gas extraction is, money has found the sector, and investors are being rewarded. I think the same result holds true for copper, so outside of owning a few call options on the COPX:US, I am actively seeking out a cheap junior with an advanced exploration or development project that I can get behind before the rest of the world wakes up.

Lithium has soared; uranium is now soaring; the last of the electrification trilogy is about to soar.

BUY COPPER.


Important Disclosures:

  1. Volt Lithium Corp. has a consulting relationship with an affiliate of Streetwise Reports, and pays a monthly consulting fee between US$8,000 and US$20,000.
  2. As of the date of this article, officers and/or employees of Streetwise Reports LLC (including members of their household) own securities of Volt Lithium Corp. and Western Uranium & Vanadium Corp.
  3. Michael Ballanger: I, or members of my immediate household or family, own securities of: All. My company has a financial relationship with: Volt Lithium Corp. I determined which companies would be included in this article based on my research and understanding of the sector.
  4. Statements and opinions expressed are the opinions of the author and not of Streetwise Reports or its officers. The author is wholly responsible for the validity of the statements. The author was not paid by Streetwise Reports for this article. Streetwise Reports was not paid by the author to publish or syndicate this article. Streetwise Reports requires contributing authors to disclose any shareholdings in, or economic relationships with, companies that they write about. Streetwise Reports relies upon the authors to accurately provide this information and Streetwise Reports has no means of verifying its accuracy.
  5.  This article does not constitute investment advice. Each reader is encouraged to consult with his or her individual financial professional. By opening this page, each reader accepts and agrees to Streetwise Reports’ terms of use and full legal disclaimer. This article is not a solicitation for investment. Streetwise Reports does not render general or specific investment advice and the information on Streetwise Reports should not be considered a recommendation to buy or sell any security. Streetwise Reports does not endorse or recommend the business, products, services or securities of any company.

For additional disclosures, please click here.

Michael Ballanger Disclosures

This letter makes no guarantee or warranty on the accuracy or completeness of the data provided. Nothing contained herein is intended or shall be deemed to be investment advice, implied or otherwise. This letter represents my views and replicates trades that I am making but nothing more than that. Always consult your registered advisor to assist you with your investments. I accept no liability for any loss arising from the use of the data contained on this letter. Options and junior mining stocks contain a high level of risk that may result in the loss of part or all invested capital and therefore are suitable for experienced and professional investors and traders only. One should be familiar with the risks involved in junior mining and options trading and we recommend consulting a financial adviser if you feel you do not understand the risks involved.

The cryptocurrency market digest (BTC, ARK). Overview for 22.09.2023

By RoboForex.com

The BTC exchange rate could not support the growing momentum and slid back to 26,654 USD.

Once again, the same scenario is developing in the digital asset market. The price of the flagship cryptocurrency gradually drops, and the market starts buying vigorously. The value rises by 4-5%, and then just as quickly falls back down within two days.

This will continue until the market has a clear buying driver.

Such a catalyst could be the news about the approval by the US Securities and Exchange Commission (SEC) of applications for bitcoin-ETF licencing. But the information on this matter will only be available in mid-October.

The marks of support levels are relevant again. These include 25,500 USD and 25,150 USD, with resistance at 27,800 USD. Another growth attempt to break through resistance has failed.

The cryptocurrency market capitalisation has dropped to 1.06 trillion USD. The BTC share is still at 49.2%, while the share of ETH has declined to 18.2%.

The value of ARK has fallen sharply

The price of one of the most discussed tokens on the market, ARK, has dropped markedly, with the quotes losing 20% in 24 hours. The capitalisation of the coin decreased to 100 million USD.

Polygon introduces Pokémon NFTs

Polygon blockchain has launched NTF cards featuring legendary anime Pokémon, and they sold out at once. The original cost of these cards increased ten times, with 175 cards being sold within seconds.

Article By RoboForex.com

Attention!
Forecasts presented in this section only reflect the author s private opinion and should not be considered as guidance for trading. RoboForex LP bears no responsibility for trading results based on trading recommendations described in these analytical reviews.

The central banks of Norway and Sweden continue to raise rates. The Swiss National Bank and the Bank of England press on pause

By JustMarkets

At Thursday’s stock market close, the Dow Jones Index (US30) decreased by 1.08%, while the S&P 500 Index (US500) fell by 1.64%. The NASDAQ Technology Index (US100) closed yesterday negative by 1.82%. Stocks and indices extended Wednesday’s losses yesterday as the hawkish tone of Wednesday’s FOMC meeting dampened global risk sentiment. Stock index futures added to their losses after weekly US jobless claims unexpectedly fell to a 7-month low, indicating a strengthening labor market and a hawkish tone for Fed policy.

The Philadelphia Business Outlook Survey of US business activity for September fell from 25.5 to 13.5, weaker than expectations of 1.0. US home sales for August unexpectedly fell by 0.7% m/m to a 7-month low of 4.04 million units, weaker than expectations for a 0.7% m/m increase to 4.10 million units.

Equity markets in Europe were mostly down yesterday. Germany’s DAX (DE40) fell by 1.33%, France’s CAC 40 (FR40) lost 1.59%, Spain’s IBEX 35 (ES35) decreased by 1.03%, and the UK’s FTSE 100 (UK100) closed down by 0.69%.

A representative of the ECB Governing Council and Bundesbank President Nagel said yesterday that it is too early to say that interest rates have reached a plateau, as inflation is still “too high” and forecasts still show only a slow decline towards the ECB’s 2% target. Another ECB official, Central Bank of Ireland Governor Makhlouf, said that an ECB rate hike is still possible in October and that it is too early to plan for a rate cut next March.

The Bank of England (BoE) unexpectedly left the rate unchanged at 5.25% yesterday, although the market expected an increase to 5.5%. However, the margin of votes was only 5 vs. 4. The accompanying statement of the bank stated the following: “If there are signs of more sustained inflationary pressures, further tightening of monetary policy will be required.” Overall, the Bank of England is following the same path as the Fed and ECB – a pause with a possible increase in the future.

The Swiss National Bank (SNB) followed the ECB and the Fed and left the rate unchanged at 1.75%, although the market was expecting a 0.25% increase at the current meeting. By taking a pause, the Central Bank kept the door open for a further increase. At the same time, the Swiss National Bank said it could intervene (in support of the Swiss franc exchange rate) in the foreign exchange market as needed.

The National Bank of Sweden (Riksbank) raised the rate by 25 bps to 4% and may raise it again as “inflationary pressures are too high.” The inflation forecast for 2024 has been raised to 4.6% and will be 8.6% this year after 8.4% in 2022. Meanwhile, the Riksbank said it would start intervening to support the Swedish krona exchange rate to the level of $8 bn and €2 bn (about 1/4 of its foreign exchange reserves) over the next 4-6 months, calling it “hedging foreign exchange reserves.”

Norway’s Central Bank (Norges Bank) on Thursday raised its main deposit rate by 25 basis points to 4.25%, the highest since 2008. The move adds pressure to Norway’s economy, which is currently experiencing a slowdown. The bank also hinted at the possibility of a further rate hike in December. In addition to the rate hike, Norges Bank slightly revised its key rate forecasts, suggesting that it will be around 4.5% until 2024.

Crude oil prices rose yesterday after Russia said it would ban gasoline and diesel exports in an attempt to stabilize domestic fuel prices. The ban will reduce fuel supplies by about 1 million BPD, which is about 3.4% of total global demand (according to Vortexa), and will further squeeze supply in an already tight global market.

Asian markets were mostly down yesterday. Japan’s Nikkei 225 was down by 1.37%, China’s FTSE China A50 (CHA50) lost 1.24%, Hong Kong’s Hang Seng (HK50) decreased by 1.29% on the day, and Australia’s ASX 200 (AU200) was negative by 1.37% on Thursday.

The Bank of Japan (BOJ) left interest rates at negative levels as expected. The BOJ said it will maintain the current yield curve control (YCC) rates, allowing bond yields to fluctuate between minus 0.5% and plus 0.5%, allowing up to 1%. The BOJ also said that amid high uncertainty surrounding the Japanese economy, especially amid slowing growth in countries that are its largest trading partners, it will continue to ease monetary policy and strive to achieve its 2% annualized inflation target. Japanese 10-year bond yields fell nearly 2% after the BOJ statement. Data released earlier on Friday showed Japan’s consumer price index inflation rose more than expected in August amid solid consumer spending, rising oil prices, and a renewed yen depreciation.

S&P 500 (F)(US500) 4,330.00 −72.20 (−1.64%)

Dow Jones (US30) 34,070.42 −370.46 (−1.08%)

DAX (DE40)  15,571.86 −209.73 (−1.33%)

FTSE 100 (UK100) 7,678.62 −53.03 (−0.69%)

USD Index  105.39 +0.19 (+0.18%)

News feed for 2023.09.22:
  • – New Zealand Trade Balance (m/m) at 01:45 (GMT+3);
  • – Australia Manufacturing PMI (m/m) at 02:00 (GMT+3);
  • – Australia Services PMI (m/m) at 02:00 (GMT+3);
  • – Japan National Core Consumer Price Index (m/m) at 02:30 (GMT+3);
  • – Japan BoJ Outlook Report at 06:00 (GMT+3);
  • – Japan BoJ Interest Rate Decision at 06:00 (GMT+3);
  • – Singapore Consumer Price Index (m/m) at 08:00 (GMT+3);
  • – Japan BoJ Press Conference at 09:30 (GMT+3);
  • – UK Retail Sales (m/m) at 09:00 (GMT+3);
  • – Eurozone German Manufacturing PMI (m/m) at 10:30 (GMT+3);
  • – Eurozone German Services PMI (m/m) at 10:30 (GMT+3);
  • – Eurozone Manufacturing PMI (m/m) at 11:00 (GMT+3);
  • – Eurozone Services PMI (m/m) at 11:00 (GMT+3);
  • – UK Manufacturing PMI (m/m) at 11:30 (GMT+3);
  • – UK Services PMI (m/m) at 11:30 (GMT+3);
  • – Canada Retail Sales (m/m) at 15:30 (GMT+3);
  • – US Manufacturing PMI (m/m) at 16:45 (GMT+3);
  • – US Services PMI (m/m) at 16:45 (GMT+3).

By JustMarkets


This article reflects a personal opinion and should not be interpreted as an investment advice, and/or offer, and/or a persistent request for carrying out financial transactions, and/or a guarantee, and/or a forecast of future events.

Fed: all according to plan. Overview for 21.09.2023

By RoboForex.com

The primary currency pair is experiencing pressure on Thursday. The current EURUSD exchange rate stands at 1.0632.

The US Federal Reserve decided to maintain the interest rate unchanged at its September meeting, keeping it within the target range of 5.25-5.50% per annum.

In the Fed’s remarks, it was noted that the decision was unanimous while leaving open the possibility of potentially increasing the rate once more before the end of the year.

This aligns with what the market had been expecting, indicating a potential increase in borrowing costs at the November meeting. The Fed clarified its intention to keep the rate elevated for an extended period.

Jerome Powell, the chair of the Federal Reserve, stated that the economy is expected to experience a so-called soft landing. While not the baseline scenario, it is considered the primary objective.

Overall, Powell was very cautious, enigmatic, and seemed somewhat uncertain.

The US dollar initially declined but swiftly recovered, maintaining a strong position.

Article By RoboForex.com

Attention!
Forecasts presented in this section only reflect the author s private opinion and should not be considered as guidance for trading. RoboForex LP bears no responsibility for trading results based on trading recommendations described in these analytical reviews.