
By InvestMacro | COT | Data Tables | COT Leaders | Downloads | COT Newsletter
Here are the latest charts and statistics for the Commitment of Traders (COT) data published by the Commodities Futures Trading Commission (CFTC).
The latest COT data is updated through Tuesday August 2nd and shows a quick view of how large traders (for-profit speculators and commercial entities) were positioned in the futures markets.
Weekly Speculator Changes
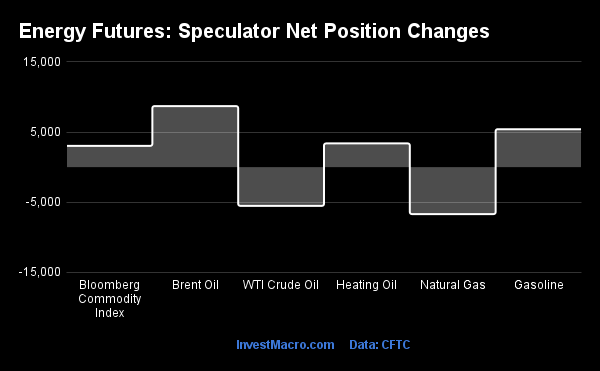
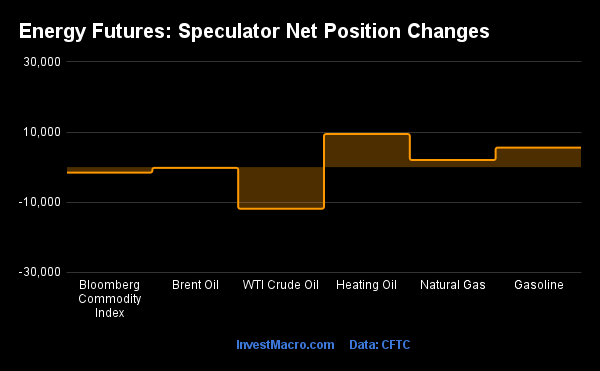
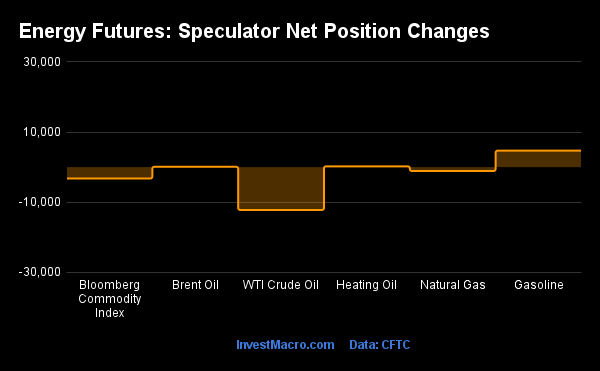
COT energy market speculator bets were higher this week as four out of the six energy markets we cover had higher positioning this week while the other two markets recorded lower contracts on the week.
Leading the gains for energy markets was Brent Crude Oil (8,700 contracts) with Gasoline (5,414 contracts), Heating Oil (3,384 contracts) and the Bloomberg Commodity Index (3,040 contracts) also showing positive weeks.
The energy markets with declines in speculator bets this week were Natural Gas (-6,683 contracts) and WTI Crude Oil with a week change of -5,508 contracts for the week.
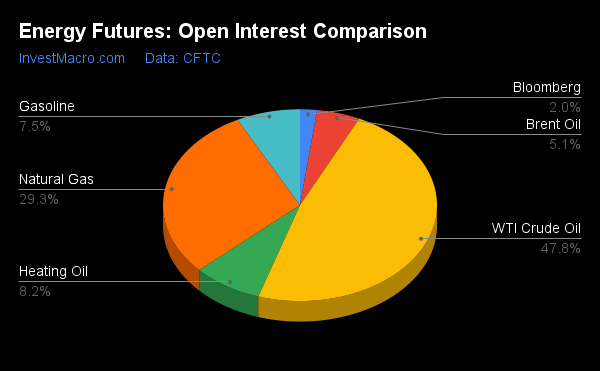
Aug-02-2022 | OI | OI-Index | Spec-Net | Spec-Index | Com-Net | COM-Index | Smalls-Net | Smalls-Index |
|---|---|---|---|---|---|---|---|---|
| WTI Crude | 1,606,910 | 3 | 253,752 | 0 | -272,866 | 100 | 19,114 | 42 |
| Corn | 1,347,894 | 6 | 201,355 | 56 | -149,434 | 51 | -51,921 | 13 |
| Natural Gas | 984,570 | 5 | -124,973 | 41 | 87,596 | 58 | 37,377 | 69 |
| Sugar | 760,093 | 11 | 34,438 | 44 | -35,229 | 61 | 791 | 9 |
| Soybeans | 572,925 | 0 | 92,527 | 42 | -65,632 | 64 | -26,895 | 26 |
| Gold | 459,649 | 2 | 124,326 | 12 | -135,565 | 90 | 11,239 | 0 |
| Wheat | 316,244 | 12 | -725 | 18 | 10,888 | 75 | -10,163 | 58 |
| Heating Oil | 276,520 | 26 | 22,068 | 75 | -35,389 | 34 | 13,321 | 44 |
| Coffee | 207,740 | 12 | 27,284 | 62 | -27,968 | 44 | 684 | 6 |
| Copper | 184,441 | 16 | -27,406 | 23 | 27,672 | 78 | -266 | 24 |
| Brent | 171,751 | 17 | -32,782 | 56 | 31,835 | 46 | 947 | 22 |
| Silver | 136,267 | 3 | 974 | 7 | -9,064 | 93 | 8,090 | 8 |
| Platinum | 68,266 | 36 | -2,541 | 5 | -1,708 | 96 | 4,249 | 21 |
| Palladium | 6,945 | 3 | -2,560 | 8 | 2,743 | 90 | -183 | 33 |
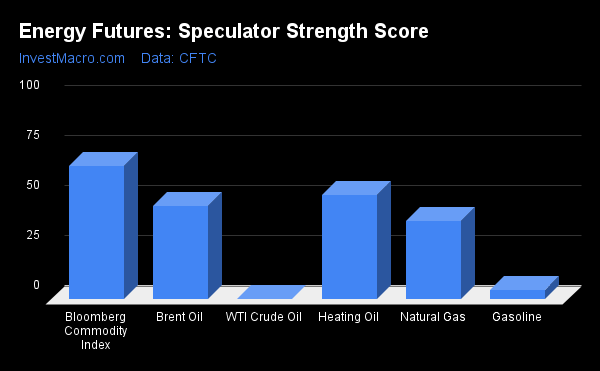
Strength Scores
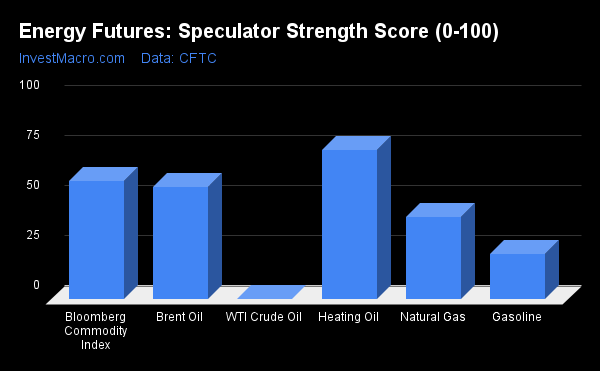
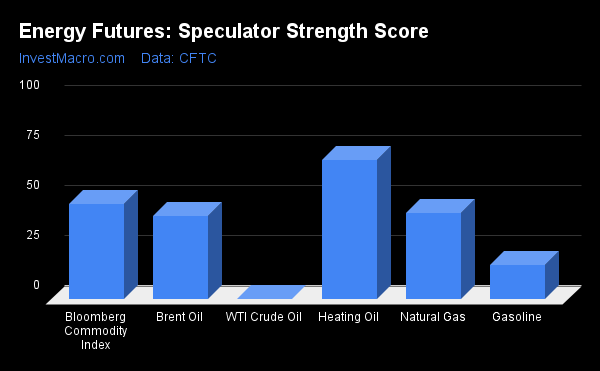
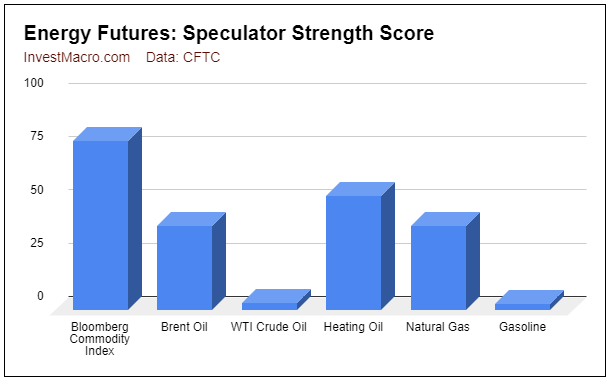
Strength Scores (a normalized measure of Speculator positions over a 3-Year range, from 0 to 100 where above 80 is extreme bullish and below 20 is extreme bearish) showed that Heating Oil (74.9 percent) leads the energy markets currently and is up from 69.9 percent last week. The Bloomberg Commodity Index (59.2 percent) comes in as the next highest energy market followed by Brent Crude Oil (56.2 percent). On the downside, WTI Crude Oil (0.0 percent) remains at the bottom of its three-year range and is in a bearish extreme level. Gasoline (22.9 percent) comes in as the next lowest followed by Natural Gas (41.1 percent).
Strength Statistics:
WTI Crude Oil (0.0 percent) vs WTI Crude Oil previous week (1.6 percent)
Brent Crude Oil (56.2 percent) vs Brent Crude Oil previous week (41.6 percent)
Natural Gas (41.1 percent) vs Natural Gas previous week (43.1 percent)
Gasoline (22.9 percent) vs Gasoline previous week (17.4 percent)
Heating Oil (74.9 percent) vs Heating Oil previous week (69.9 percent)
Bloomberg Commodity Index (59.2 percent) vs Bloomberg Commodity Index previous week (47.6 percent)
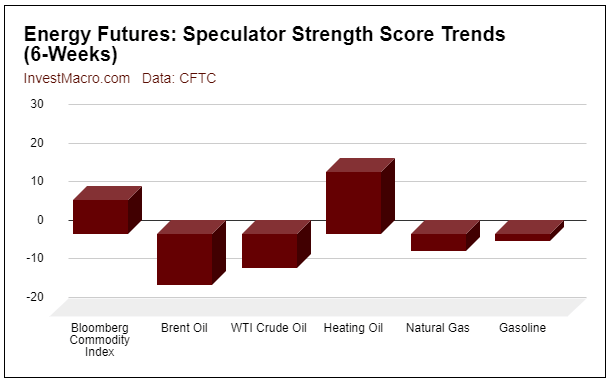
Strength Trends
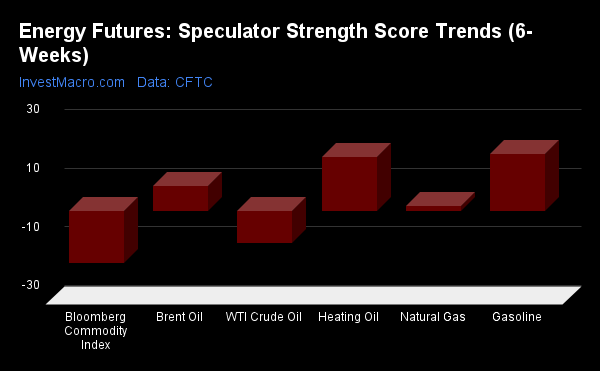
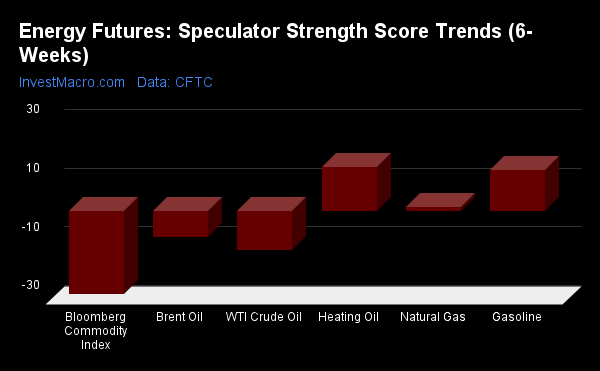
Strength Score Trends (or move index, calculates the 6-week changes in strength scores) show that the Gasoline (19.5 percent) leads the past six weeks trends for energy this week. Heating Oil (18.4 percent), Brent Crude Oil (8.8 percent) and the Natural Gas (1.8 percent) fill out the other positive movers in the latest trends data. The Bloomberg Commodity Index (-17.5 percent) leads the downside trend scores currently followed by WTI Crude Oil at -10.7 percent.
Strength Trend Statistics:
WTI Crude Oil (-10.7 percent) vs WTI Crude Oil previous week (-13.0 percent)
Brent Crude Oil (8.8 percent) vs Brent Crude Oil previous week (-8.6 percent)
Natural Gas (1.8 percent) vs Natural Gas previous week (1.6 percent)
Gasoline (19.5 percent) vs Gasoline previous week (14.0 percent)
Heating Oil (18.4 percent) vs Heating Oil previous week (15.0 percent)
Bloomberg Commodity Index (-17.5 percent) vs Bloomberg Commodity Index previous week (-28.1 percent)
Individual Markets:
WTI Crude Oil Futures:
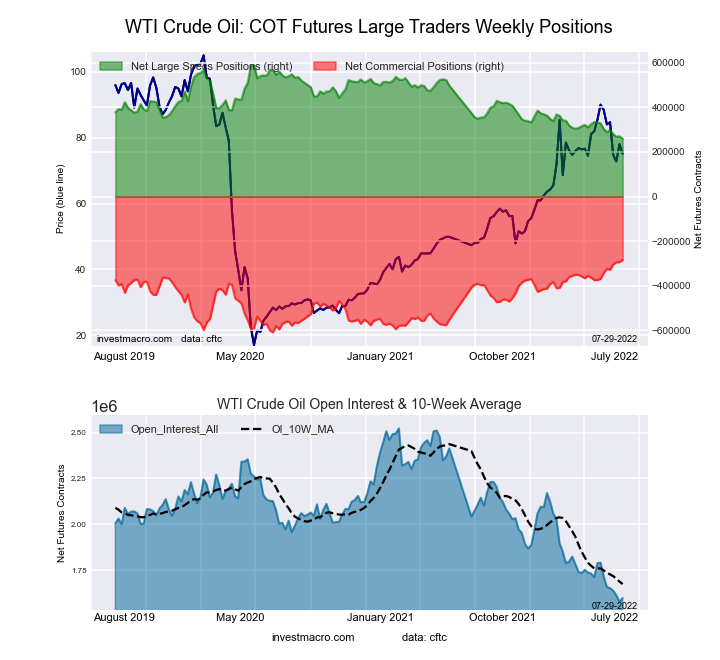
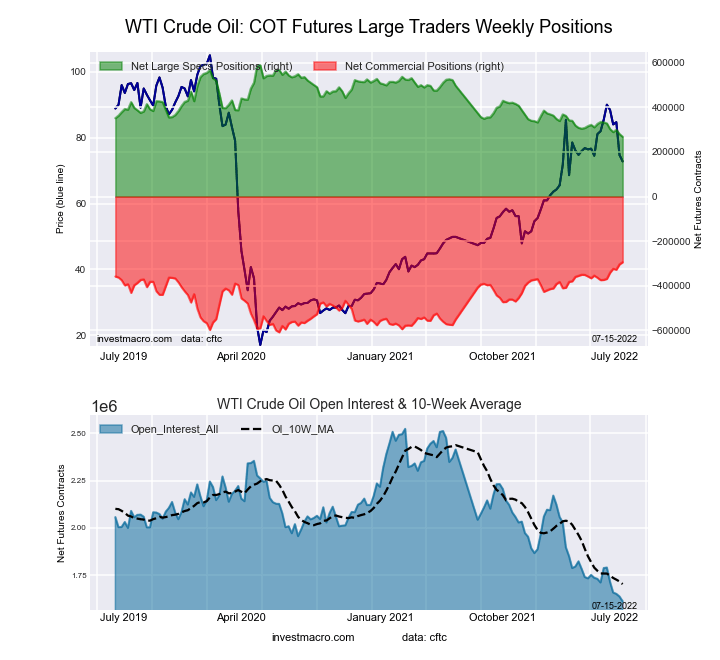
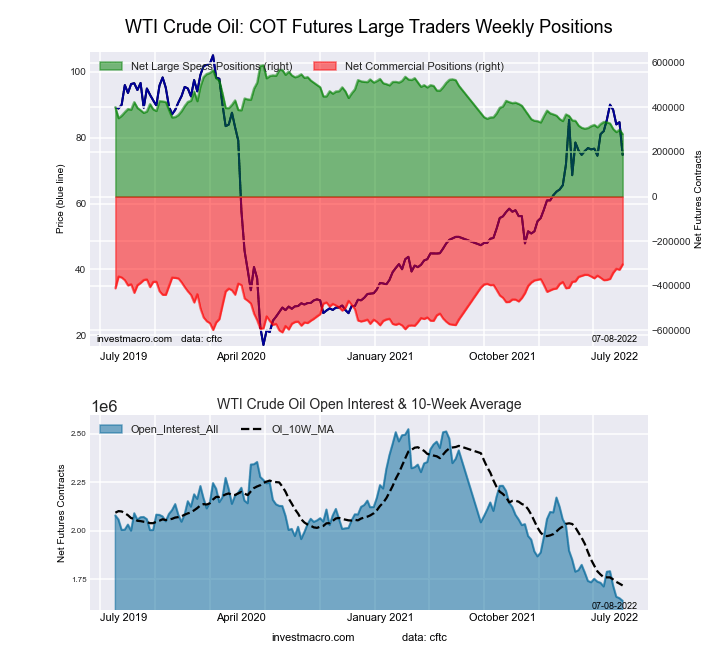
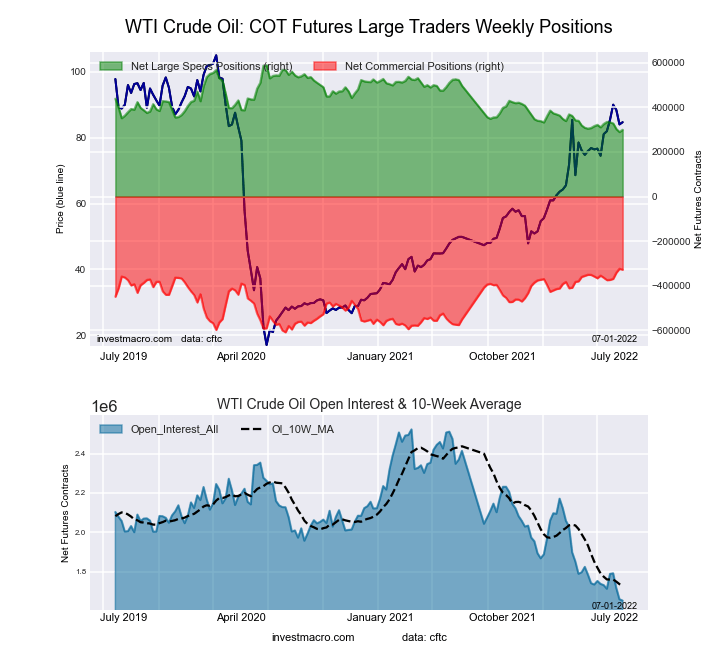
 The WTI Crude Oil Futures large speculator standing this week resulted in a net position of 253,752 contracts in the data reported through Tuesday. This was a weekly reduction of -5,508 contracts from the previous week which had a total of 259,260 net contracts.
This week’s current strength score (the trader positioning range over the past three years, measured from 0 to 100) shows the speculators are currently Bearish-Extreme with a score of 0.0 percent. The commercials are Bullish-Extreme with a score of 100.0 percent and the small traders (not shown in chart) are Bearish with a score of 41.9 percent.
| WTI Crude Oil Futures Statistics | SPECULATORS | COMMERCIALS | SMALL TRADERS |
| – Percent of Open Interest Longs: | 22.5 | 38.4 | 4.6 |
| – Percent of Open Interest Shorts: | 6.7 | 55.4 | 3.4 |
| – Net Position: | 253,752 | -272,866 | 19,114 |
| – Gross Longs: | 361,810 | 616,741 | 74,356 |
| – Gross Shorts: | 108,058 | 889,607 | 55,242 |
| – Long to Short Ratio: | 3.3 to 1 | 0.7 to 1 | 1.3 to 1 |
| NET POSITION TREND: | |||
| – Strength Index Score (3 Year Range Pct): | 0.0 | 100.0 | 41.9 |
| – Strength Index Reading (3 Year Range): | Bearish-Extreme | Bullish-Extreme | Bearish |
| NET POSITION MOVEMENT INDEX: | |||
| – 6-Week Change in Strength Index: | -10.7 | 15.2 | -21.6 |
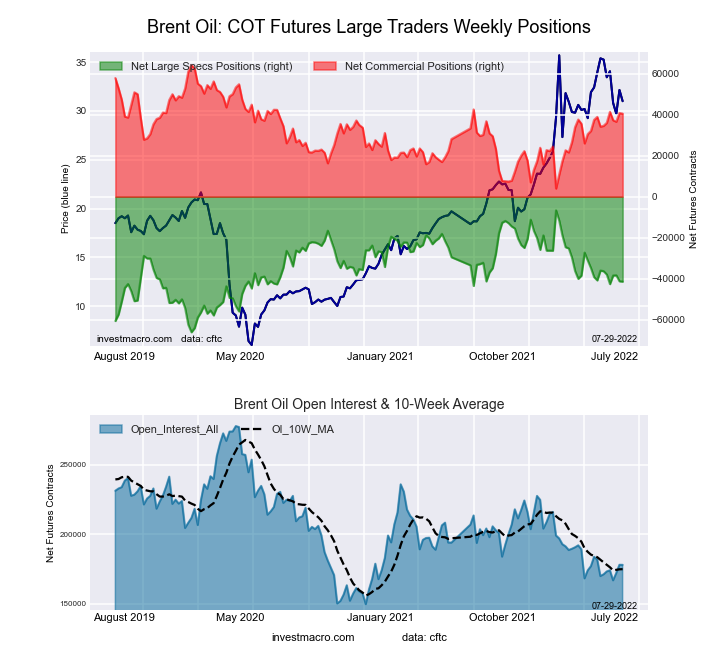
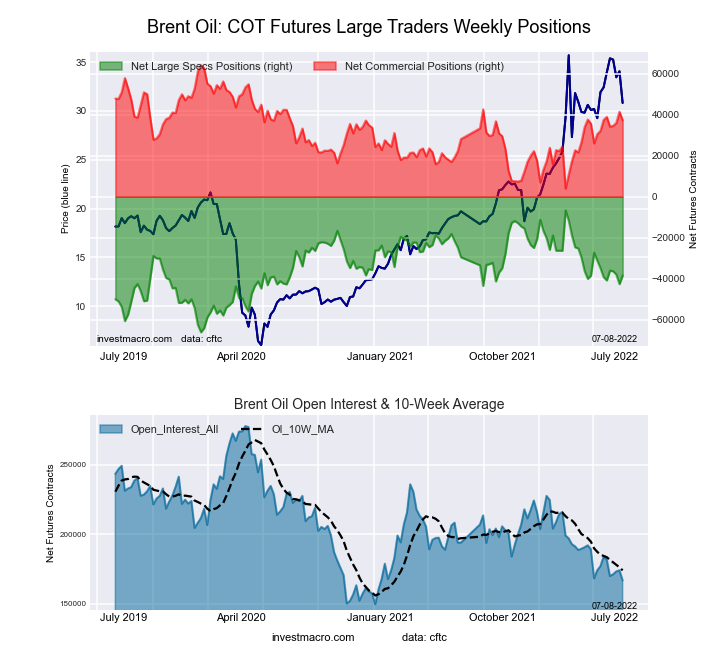
Brent Crude Oil Futures:
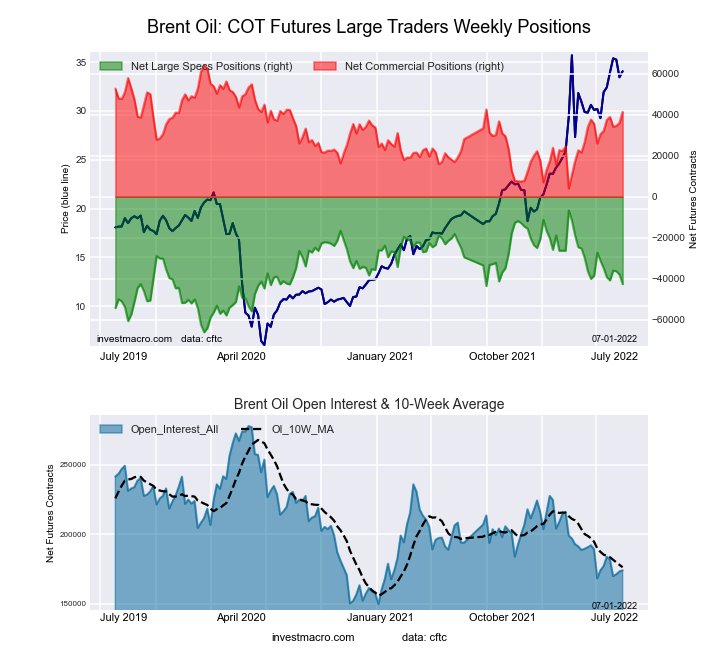
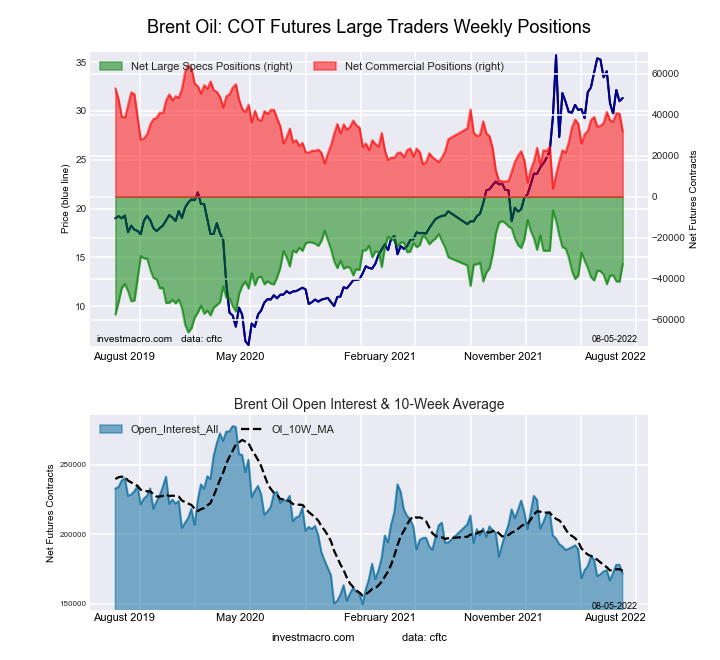 The Brent Crude Oil Futures large speculator standing this week resulted in a net position of -32,782 contracts in the data reported through Tuesday. This was a weekly gain of 8,700 contracts from the previous week which had a total of -41,482 net contracts.
This week’s current strength score (the trader positioning range over the past three years, measured from 0 to 100) shows the speculators are currently Bullish with a score of 56.2 percent. The commercials are Bearish with a score of 46.2 percent and the small traders (not shown in chart) are Bearish with a score of 22.0 percent.
| Brent Crude Oil Futures Statistics | SPECULATORS | COMMERCIALS | SMALL TRADERS |
| – Percent of Open Interest Longs: | 16.3 | 50.3 | 4.0 |
| – Percent of Open Interest Shorts: | 35.4 | 31.8 | 3.4 |
| – Net Position: | -32,782 | 31,835 | 947 |
| – Gross Longs: | 28,074 | 86,415 | 6,872 |
| – Gross Shorts: | 60,856 | 54,580 | 5,925 |
| – Long to Short Ratio: | 0.5 to 1 | 1.6 to 1 | 1.2 to 1 |
| NET POSITION TREND: | |||
| – Strength Index Score (3 Year Range Pct): | 56.2 | 46.2 | 22.0 |
| – Strength Index Reading (3 Year Range): | Bullish | Bearish | Bearish |
| NET POSITION MOVEMENT INDEX: | |||
| – 6-Week Change in Strength Index: | 8.8 | -7.0 | -13.7 |
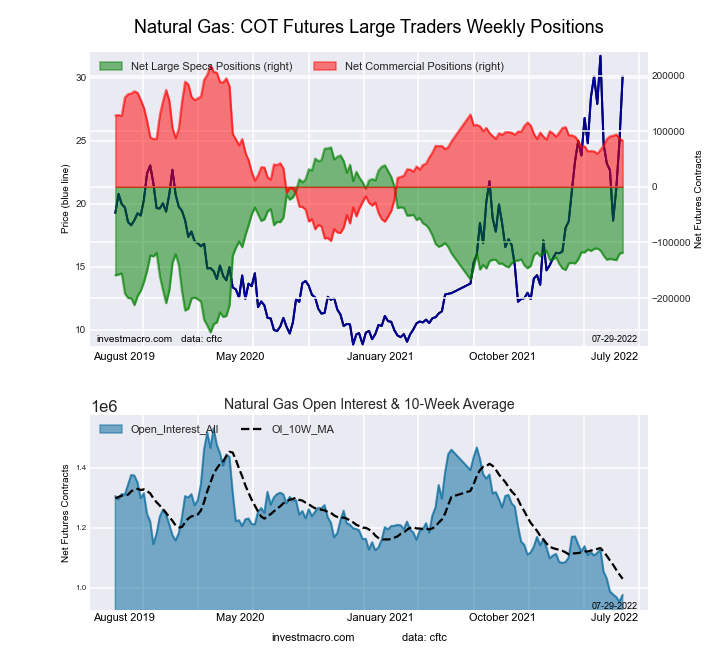
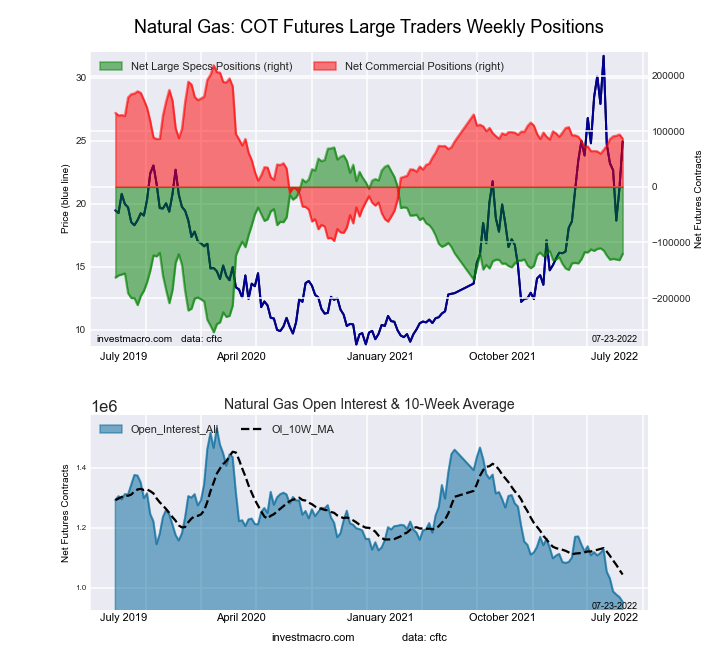
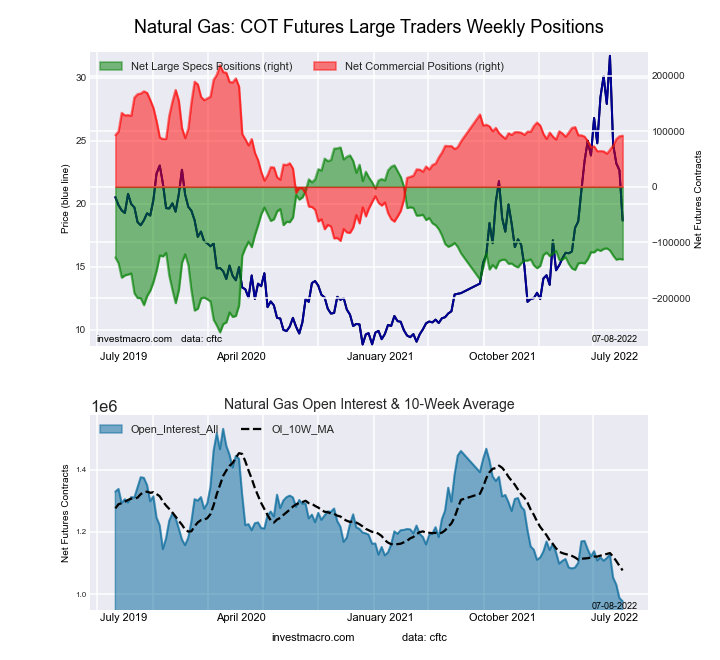
Natural Gas Futures:
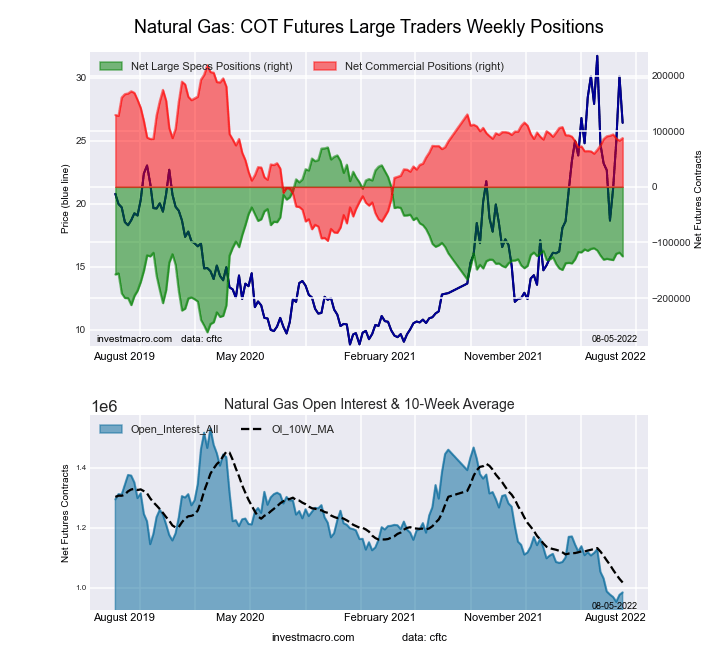 The Natural Gas Futures large speculator standing this week resulted in a net position of -124,973 contracts in the data reported through Tuesday. This was a weekly decline of -6,683 contracts from the previous week which had a total of -118,290 net contracts.
This week’s current strength score (the trader positioning range over the past three years, measured from 0 to 100) shows the speculators are currently Bearish with a score of 41.1 percent. The commercials are Bullish with a score of 58.5 percent and the small traders (not shown in chart) are Bullish with a score of 68.6 percent.
| Natural Gas Futures Statistics | SPECULATORS | COMMERCIALS | SMALL TRADERS |
| – Percent of Open Interest Longs: | 17.7 | 40.1 | 6.8 |
| – Percent of Open Interest Shorts: | 30.4 | 31.2 | 3.0 |
| – Net Position: | -124,973 | 87,596 | 37,377 |
| – Gross Longs: | 174,529 | 394,371 | 66,623 |
| – Gross Shorts: | 299,502 | 306,775 | 29,246 |
| – Long to Short Ratio: | 0.6 to 1 | 1.3 to 1 | 2.3 to 1 |
| NET POSITION TREND: | |||
| – Strength Index Score (3 Year Range Pct): | 41.1 | 58.5 | 68.6 |
| – Strength Index Reading (3 Year Range): | Bearish | Bullish | Bullish |
| NET POSITION MOVEMENT INDEX: | |||
| – 6-Week Change in Strength Index: | 1.8 | 0.5 | -17.7 |
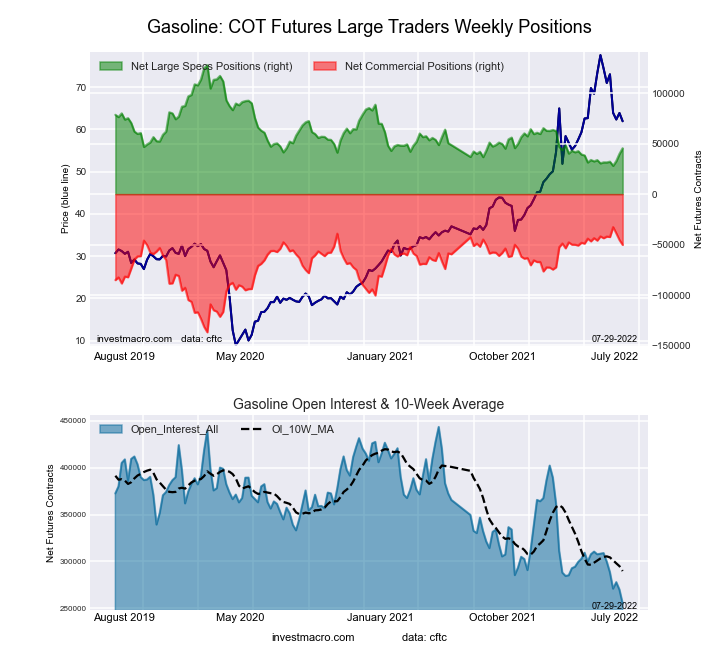
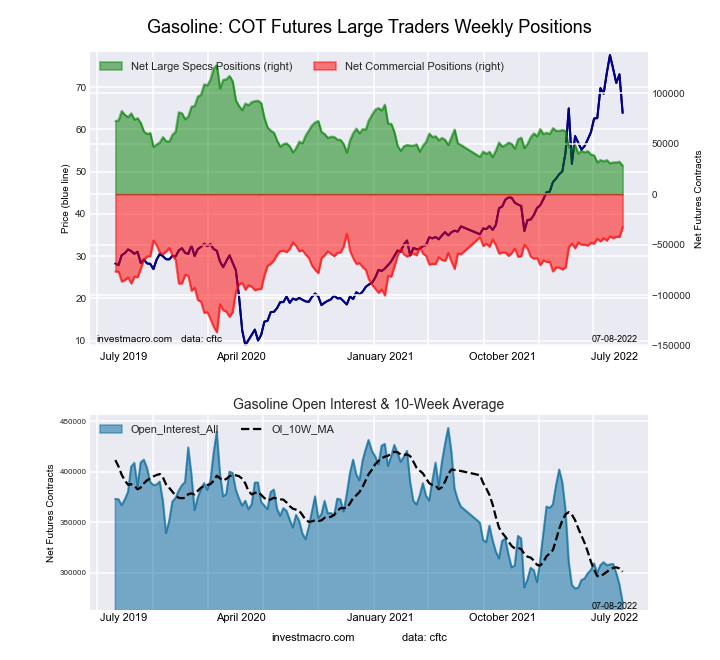
Gasoline Blendstock Futures:
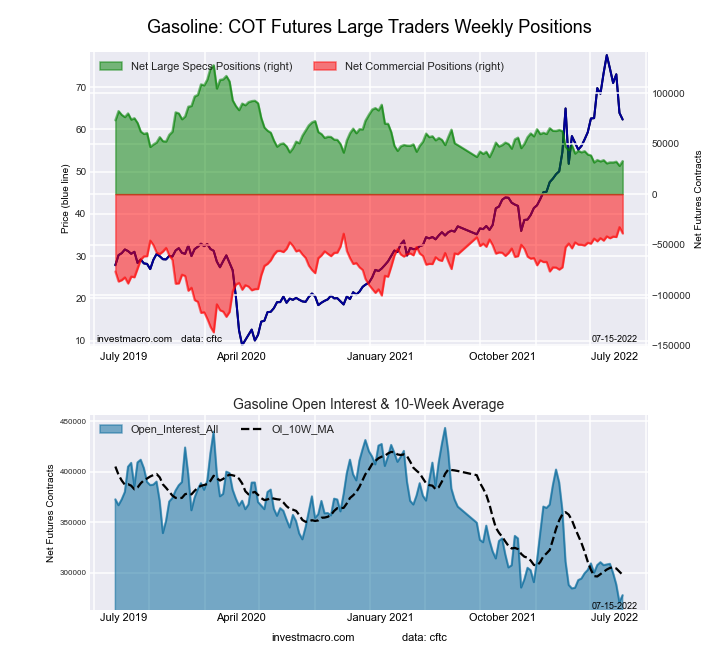
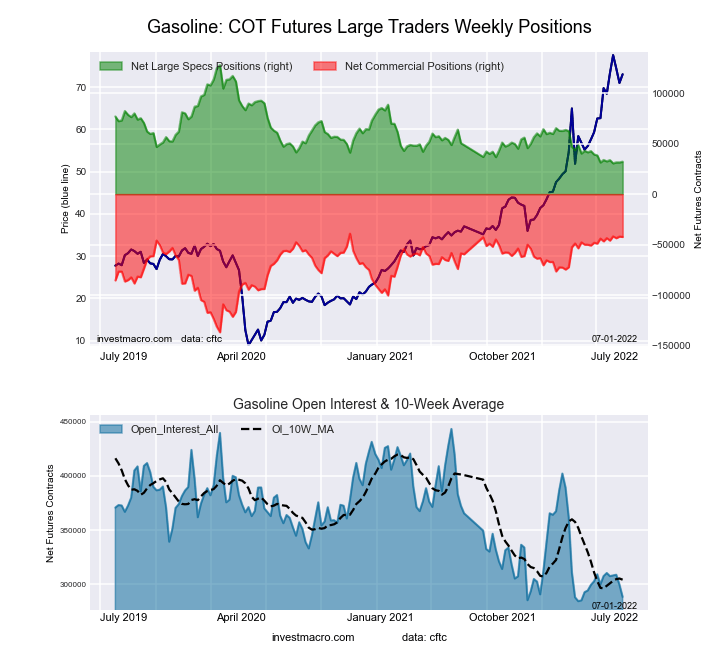
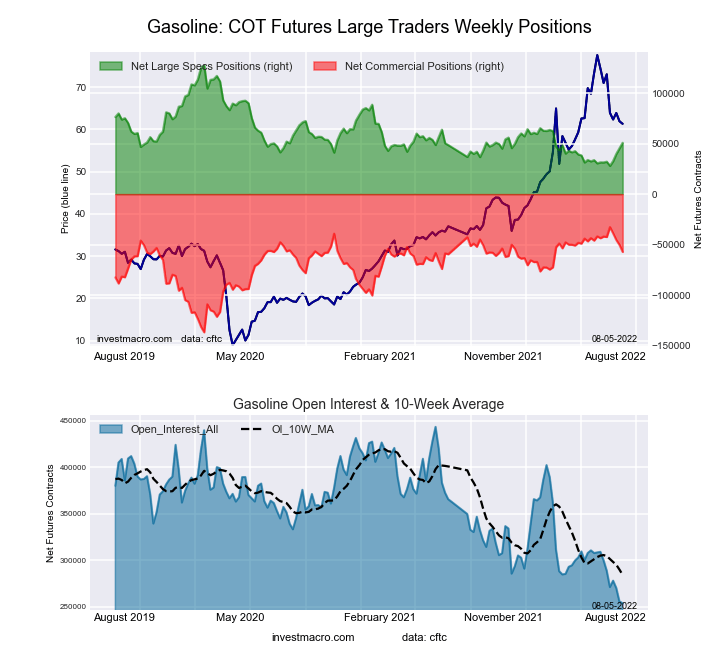 The Gasoline Blendstock Futures large speculator standing this week resulted in a net position of 50,818 contracts in the data reported through Tuesday. This was a weekly increase of 5,414 contracts from the previous week which had a total of 45,404 net contracts.
This week’s current strength score (the trader positioning range over the past three years, measured from 0 to 100) shows the speculators are currently Bearish with a score of 22.9 percent. The commercials are Bullish with a score of 76.4 percent and the small traders (not shown in chart) are Bullish with a score of 55.9 percent.
| Nasdaq Mini Futures Statistics | SPECULATORS | COMMERCIALS | SMALL TRADERS |
| – Percent of Open Interest Longs: | 31.1 | 46.8 | 7.5 |
| – Percent of Open Interest Shorts: | 11.0 | 69.4 | 4.9 |
| – Net Position: | 50,818 | -57,295 | 6,477 |
| – Gross Longs: | 78,784 | 118,686 | 19,000 |
| – Gross Shorts: | 27,966 | 175,981 | 12,523 |
| – Long to Short Ratio: | 2.8 to 1 | 0.7 to 1 | 1.5 to 1 |
| NET POSITION TREND: | |||
| – Strength Index Score (3 Year Range Pct): | 22.9 | 76.4 | 55.9 |
| – Strength Index Reading (3 Year Range): | Bearish | Bullish | Bullish |
| NET POSITION MOVEMENT INDEX: | |||
| – 6-Week Change in Strength Index: | 19.5 | -14.6 | -27.9 |
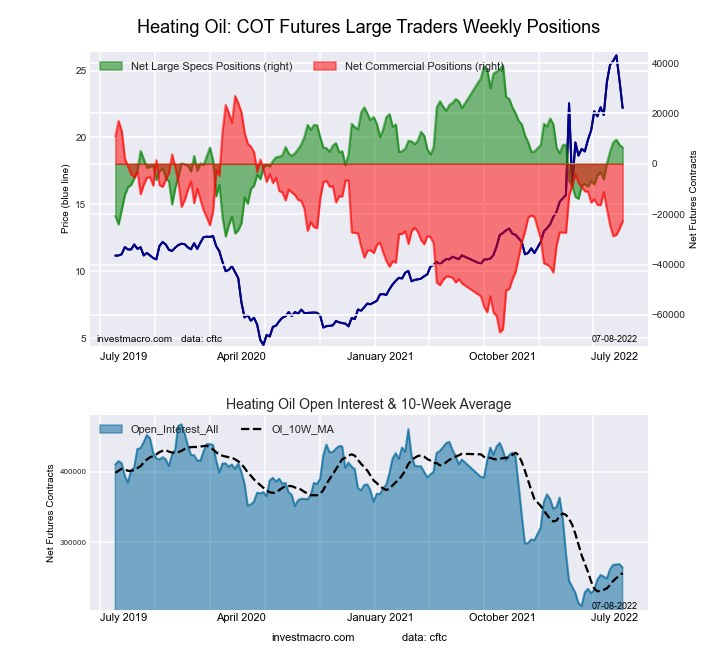
#2 Heating Oil NY-Harbor Futures:
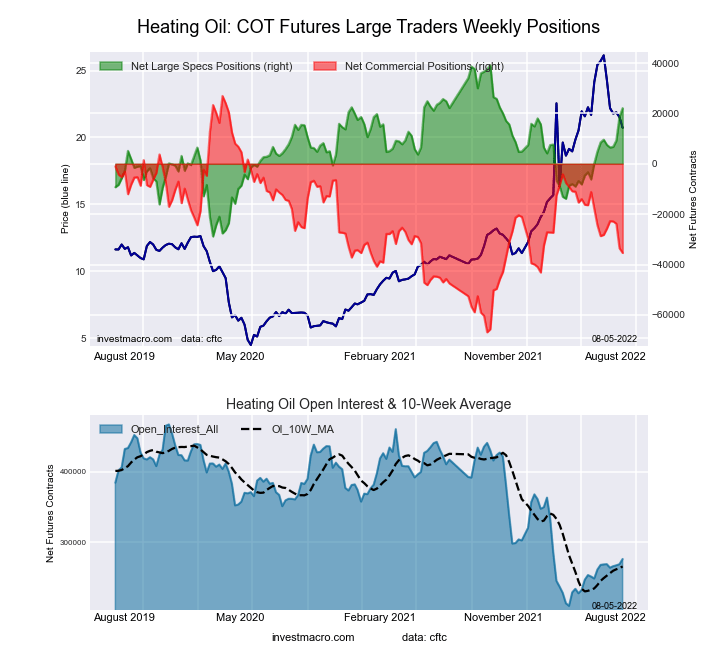 The #2 Heating Oil NY-Harbor Futures large speculator standing this week resulted in a net position of 22,068 contracts in the data reported through Tuesday. This was a weekly boost of 3,384 contracts from the previous week which had a total of 18,684 net contracts.
This week’s current strength score (the trader positioning range over the past three years, measured from 0 to 100) shows the speculators are currently Bullish with a score of 74.9 percent. The commercials are Bearish with a score of 33.6 percent and the small traders (not shown in chart) are Bearish with a score of 44.5 percent.
| Heating Oil Futures Statistics | SPECULATORS | COMMERCIALS | SMALL TRADERS |
| – Percent of Open Interest Longs: | 16.8 | 52.7 | 14.8 |
| – Percent of Open Interest Shorts: | 8.8 | 65.5 | 9.9 |
| – Net Position: | 22,068 | -35,389 | 13,321 |
| – Gross Longs: | 46,505 | 145,844 | 40,829 |
| – Gross Shorts: | 24,437 | 181,233 | 27,508 |
| – Long to Short Ratio: | 1.9 to 1 | 0.8 to 1 | 1.5 to 1 |
| NET POSITION TREND: | |||
| – Strength Index Score (3 Year Range Pct): | 74.9 | 33.6 | 44.5 |
| – Strength Index Reading (3 Year Range): | Bullish | Bearish | Bearish |
| NET POSITION MOVEMENT INDEX: | |||
| – 6-Week Change in Strength Index: | 18.4 | -7.7 | -18.4 |
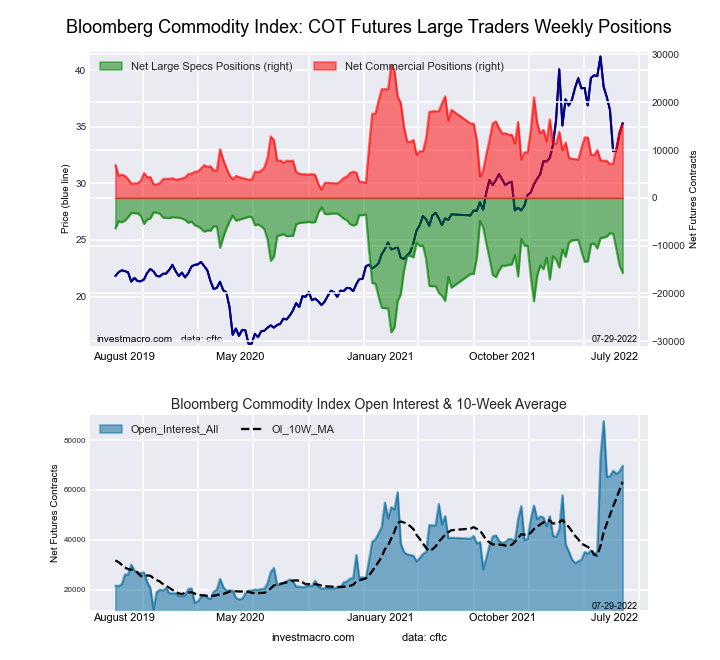
Bloomberg Commodity Index Futures:
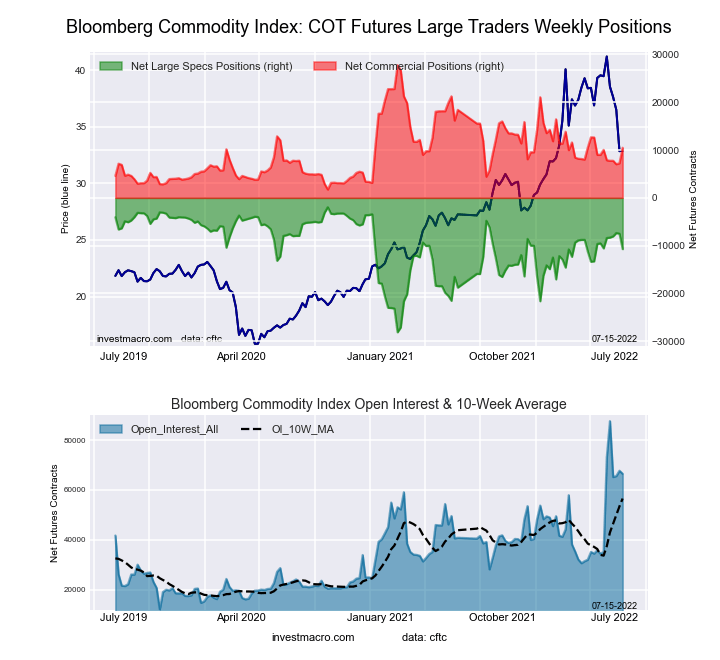
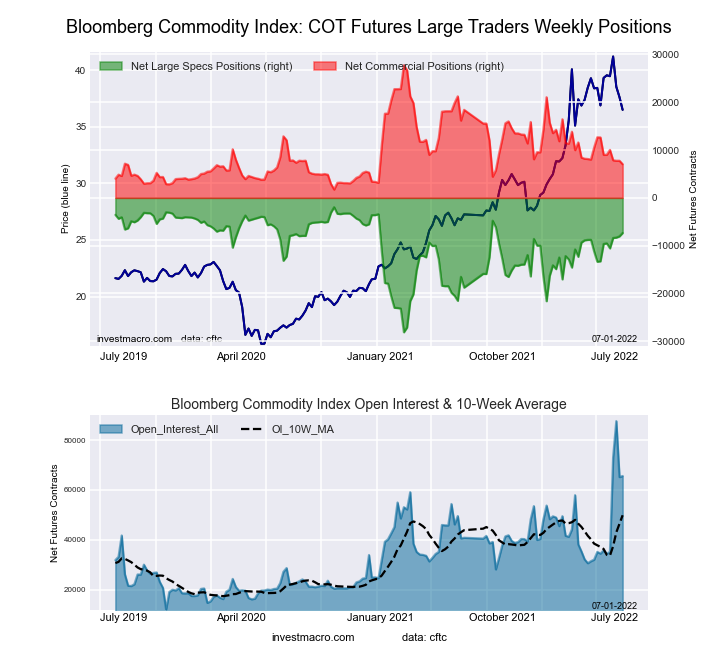
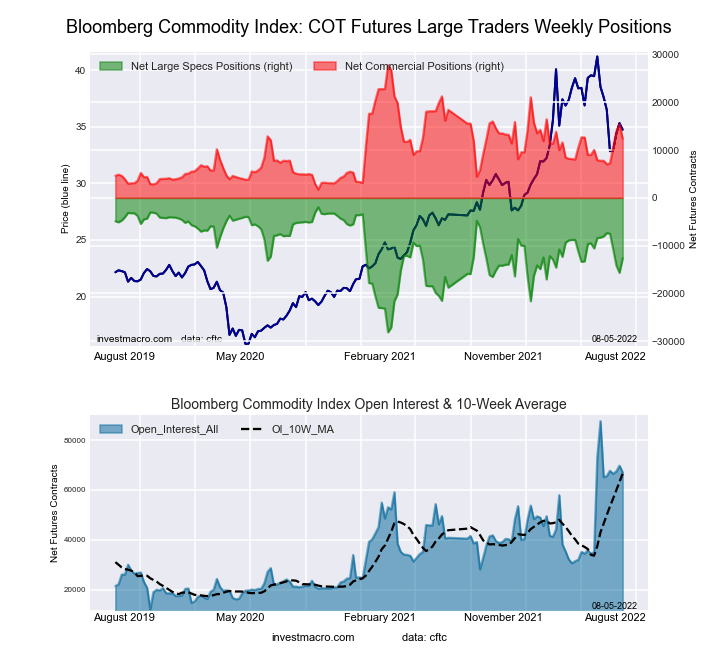 The Bloomberg Commodity Index Futures large speculator standing this week resulted in a net position of -12,623 contracts in the data reported through Tuesday. This was a weekly advance of 3,040 contracts from the previous week which had a total of -15,663 net contracts.
This week’s current strength score (the trader positioning range over the past three years, measured from 0 to 100) shows the speculators are currently Bullish with a score of 59.2 percent. The commercials are Bearish with a score of 40.9 percent and the small traders (not shown in chart) are Bearish-Extreme with a score of 18.7 percent.
| Bloomberg Index Futures Statistics | SPECULATORS | COMMERCIALS | SMALL TRADERS |
| – Percent of Open Interest Longs: | 23.5 | 74.4 | 0.6 |
| – Percent of Open Interest Shorts: | 42.4 | 55.9 | 0.2 |
| – Net Position: | -12,623 | 12,388 | 235 |
| – Gross Longs: | 15,791 | 49,891 | 373 |
| – Gross Shorts: | 28,414 | 37,503 | 138 |
| – Long to Short Ratio: | 0.6 to 1 | 1.3 to 1 | 2.7 to 1 |
| NET POSITION TREND: | |||
| – Strength Index Score (3 Year Range Pct): | 59.2 | 40.9 | 18.7 |
| – Strength Index Reading (3 Year Range): | Bullish | Bearish | Bearish-Extreme |
| NET POSITION MOVEMENT INDEX: | |||
| – 6-Week Change in Strength Index: | -17.5 | 17.8 | -2.1 |
Article By InvestMacro – Receive our weekly COT Reports by Email
*COT Report: The COT data, released weekly to the public each Friday, is updated through the most recent Tuesday (data is 3 days old) and shows a quick view of how large speculators or non-commercials (for-profit traders) were positioned in the futures markets.
The CFTC categorizes trader positions according to commercial hedgers (traders who use futures contracts for hedging as part of the business), non-commercials (large traders who speculate to realize trading profits) and nonreportable traders (usually small traders/speculators) as well as their open interest (contracts open in the market at time of reporting).See CFTC criteria here.


