
Brent
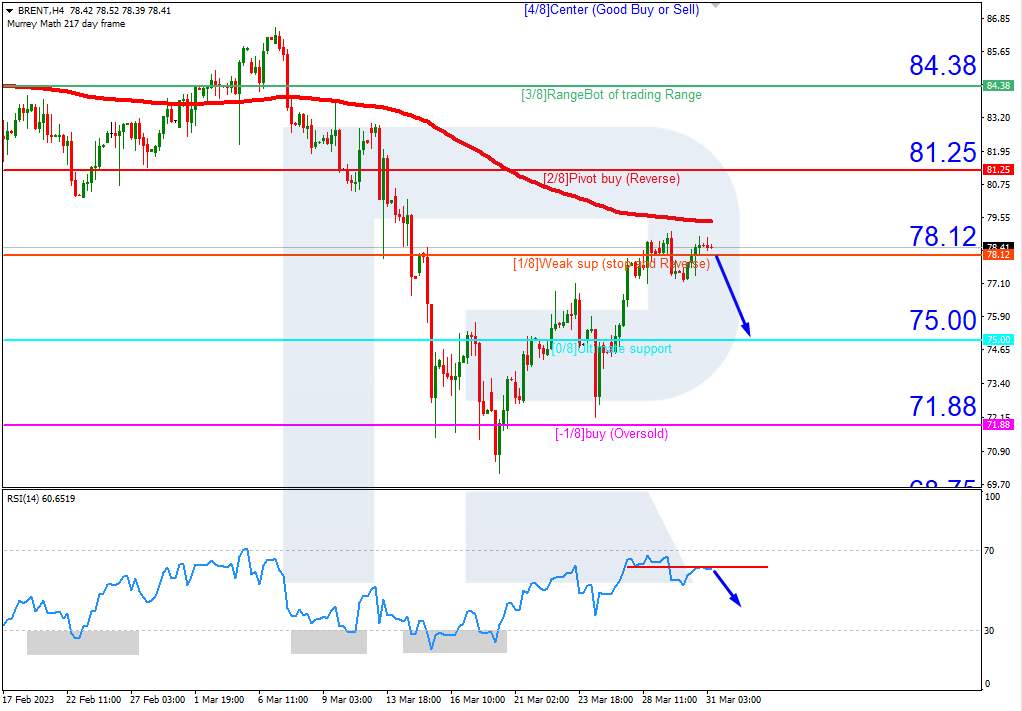
On H4, Brent quotes are under the 200-day Moving Average, which indicates the prevalence of a downtrend. The RSI is testing the resistance line. In this circumstances, we expect a downward breakout of 1/8 (78.12) and falling to the support at 0/8 (75.00). The scenario can be canceled by rising above 2/8 (81.25), which might lead to a trend reversal and growth to the resistance level of 3/8 (84.38).

On M15, a breakout of the lower line of the VoltyChannel indicator will increase the probability of further price falling.

Free Reports:
 Download Our Metatrader 4 Indicators – Put Our Free MetaTrader 4 Custom Indicators on your charts when you join our Weekly Newsletter
 Get our Weekly Commitment of Traders Reports - See where the biggest traders (Hedge Funds and Commercial Hedgers) are positioned in the futures markets on a weekly basis.
S&P 500
On H4, the quotes of the S&P 500 index have broken the 200-day Moving Average and are now above it, which indicates a probable development of the uptrend. However, the RSI has reached the overbought area. As a result, in such a situation, a rebound from the level of 4/8 (4062.5) is expected, after which the price could fall to the support at 3/8 (3984.4). The scenario can be canceled by rising above the resistance at 4/8 (4062.5). In this case, the growth of the S&P 500 index will continue, and the index could reach 5/8 (4140.6).

On M15, further price falling can be supported by a breakout of the lower border of VoltyChannel.

Article By RoboForex.com
Attention!
Forecasts presented in this section only reflect the author’s private opinion and should not be considered as guidance for trading. RoboForex LP bears no responsibility for trading results based on trading recommendations described in these analytical reviews.

- Geopolitical and macroeconomic conditions continue to pressure market sentiment Jul 20, 2026
- USD/JPY Poised to Continue Gains as Expensive Oil and Lack of Support Weigh on Yen Jul 20, 2026
- COT Metals Charts: Weekly Speculator Bets led by Copper & Steel Jul 18, 2026
- COT Bonds Charts: Weekly Speculator Bets led by 2-Year, SOFR 3M & 5-Year Bonds Jul 18, 2026
- COT Energy Charts: Weekly Speculator Bets led by Brent Oil & Heating Oil Jul 18, 2026
- COT Soft Commodities Charts: Weekly Speculator Bets led by Wheat, Corn & Soybean Meal Jul 18, 2026
- The Bank of Canada kept its interest rate unchanged. Platinum prices reached a three‑week high Jul 16, 2026
- Stock indices rose after the release of US inflation data. China’s GDP slowed sharply Jul 15, 2026
- GBP/USD Awaits Political News: What Will Happen Next Jul 15, 2026
- USD/JPY Holds at Highs: Pressure Lingers on Yen Jul 14, 2026
