Archive for Energy

Oil price volatility intensifies as conflict deepens

By ForexTime 

  • Risk aversion grips global stock markets
  • Brent crude hovers around triple digits amid supply shocks
  • Gold pressured by stronger dollar and inflation fears
  • RBA raises rates for second consecutive time
  • Fed seen leaving rates unchanged on Wednesday

Risk aversion returned to global markets on Tuesday as tensions in the Middle East sapped risk appetite.

The brief tech rally in the previous session merely served as a small distraction with equities on the back foot amid the overall caution.

All eyes remain on the ship traffic through the Strait of Hormuz as Trump calls for other nations to secure the critical waterway.

Ultimately, this has injected oil prices with monstrous levels of volatility with Brent rallying above $103 a barrel on Tuesday. Iran’s attacks on energy infrastructure around the Middle East have intensified fears around supply shocks, injecting oil bulls with renewed vigour.

To counter such shocks, the IEA launched its largest ever oil release amounting to 400million barrels of oil from their emergency stocks. In addition, the US issued its second temporary waiver for the purchase of Russian oil. Despite all of this, Brent is finding comfort at triple digits and could extend gains on geopolitical risk.

Gold remains on the back foot despite the growing risk aversion.

A broadly stronger dollar and dwindling bets around lower US interest rates have dealt gold a double blow. Traders are only pricing in just one Fed cut in 2026, thanks to concerns around conflict-induced inflation.

Gold’s near-term outlook may be influenced by the Fed decision on Wednesday. No changes are expected, but the Fed may be forced to reassess its policy strategy for 2026. Looking at the charts, gold is wobbling above $5000 as of writing. Weakness below this point may open a path toward $4900 while a rebound could see prices retest resistance at $5100.

Speaking of central banks, the RBA raised interest rates on Tuesday for a second consecutive meeting.

Growing concerns around conflict-induced inflation shocks may prompt central banks to reassess their policy strategies for 2026.

The Federal Reserve (Fed), European Central Bank (ECB) and Bank of England (BoE), among many others will be under the spotlight this week.

Market expectations have rapidly evaporated over the Fed cutting rates anytime while the BoE/ECB are seen potentially hiking rates by the end of the year if inflation persists. These sharp shifts in policy expectations may translate to heightened levels of volatility.


Forex-Time-LogoArticle by ForexTime


ForexTime Ltd (FXTM) is an award winning international online forex broker regulated by CySEC 185/12 www.forextime.com

Oil isn’t just fuel: Iran conflict could disrupt markets for everything from plastics to fertilizers

By André O. Hudson, Rochester Institute of Technology 

Tensions in the Middle East often trigger concerns about rising gasoline prices. But disruptions to oil supplies could affect much more than the cost of filling up a car. That’s because crude oil is not only burned as fuel. It is also the raw material for thousands of products that modern societies depend on, including plastics, fertilizers, clothing fibers, medicines and electronics.

As a biochemist, I’m interested in how certain chemicals can shape society, and oil is a prime example.

The stakes become clearer when looking at the Strait of Hormuz, a narrow waterway between Iran and Oman. About one-fifth of the world’s petroleum liquids consumption passes through the strait each day, making it one of the most important oil shipping routes on Earth. If conflict significantly disrupts traffic there, the effects could ripple far beyond energy markets.

A map of the Strait of Hormuz, which is a narrow body of water between Iran and Oman.
The Strait of Hormuz.
Goran_tek-en/Wikimedia Commons, CC BY-SA

Oil is a chemical starting point

Crude oil is a complex mixture of hydrocarbons – molecules made mainly of carbon and hydrogen. Refineries and chemical plants separate and transform these molecules into smaller chemical building blocks known as petrochemicals.

Some of the most important petrochemical building blocks include chemicals such as ethylene, propylene and benzene. Manufacturers can then convert these building blocks into more complex forms, which make up plastics, solvents, synthetic rubber and other industrial materials.

While fuel is a well-known product, fuels actually represents only a portion of what is produced from crude oil. The refining process generates a wide range of petroleum-based materials used to manufacture everyday items, such as plastics, medicines, electronics, cosmetics, clothing fibers and household goods.

A diagram showing a bunch of different types of hydrocarbon molecules derived from petroleum
Hydrocarbons are molecules made predominantly from hydrogen and carbon. Different forms, derived from crude oil, are used in many types of manufacturing.
André O. Hudson/Patel & Shah, 2013

Plastics that shape modern life

One of the most visible uses of oil is the production of plastics. Scientists can link individual petrochemical molecules to form polymers, which are long chains of repeating units that create materials such as polyethylene, polypropylene and polystyrene.

Because plastics are lightweight, durable and relatively inexpensive, they have become essential to global manufacturing.

These plastics appear in countless products, including food packaging and water bottles; medical equipment, such as syringes and IV bags; electronics casings and appliances; automotive parts; and construction materials, such as pipes and insulation.

Even technologies designed to reduce carbon emissions depend on them. Wind turbines, solar panels and electric vehicles all contain plastic components derived from petrochemicals.

Fertilizer that feeds billions

Oil and natural gas also play a critical role in agriculture. Modern fertilizers rely on nitrogen compounds, such as ammonia. Ammonia is produced through the Haber-Bosch process, which uses hydrogen typically derived from natural gas or other fossil fuels.

These fertilizers replenish nutrients in soil and dramatically increase crop yields. Without them, global food production would be far lower. Petrochemicals are also used to produce pesticides, herbicides and plastics used in irrigation systems and agricultural equipment.

Clothing, cosmetics and medicines

Petrochemicals also appear in many everyday consumer goods. Synthetic fabrics, such as polyester, nylon and acrylic, are made from petrochemical feedstocks. These feedstocks are the basic chemicals, made from crude oil or natural gas, that serve as the starting ingredients for products widely used in clothing, carpets and furniture.

Petroleum-derived ingredients are also common in cosmetics and personal care products. Certain lotions, shampoos and lipsticks rely on these compounds because they help stabilize formulas and extend shelf life.

Petrochemicals are also important in medicine. Petroleum-derived chemical intermediates − compounds made during the process of turning raw materials into a final product − are used to manufacture pharmaceuticals, medical tubing, sterile packaging and disposable gloves.

These materials help hospitals maintain sterility and safety in health care environments.

Crude oil is far more than just a source of gasoline.

Why the Strait of Hormuz matters

Because oil and petrochemical feedstocks move through global shipping routes, disruptions in one region will affect supply chains worldwide. The Strait of Hormuz is particularly important. If conflict or political tensions continue to interrupt shipping through the Strait, oil prices will rise quickly. Energy analysts have long warned that disruptions to the strait could send shock waves through global markets. The impact would not be limited to transportation fuels.

Petrochemical industries depend on steady supplies of crude oil and natural gas liquids as raw materials. If those supplies become more expensive or harder to obtain, manufacturers could face higher production costs.

The proportion of crude oil used for petrochemical feedstocks to create plastics, fertilizers and other materials represents around 10% to 20% of oil consumption. Most crude oil is refined for fuel production, including gasoline, diesel and jet fuel, so these fuel supply chains would likely be the first to take a hit. But over time, disruptions could affect the availability and price of products ranging from plastics and packaging to fertilizers, synthetic clothing fibers and even food.

A hidden foundation of modern economies

Because petrochemicals are often used behind the scenes as ingredients rather than finished products, the connection many agricultural, medical and consumer goods have to oil is easy to overlook. Yet, petrochemicals form a hidden foundation for modern economies. They enable large-scale agriculture, advanced health care systems and global manufacturing supply chains.

At the same time, concerns about climate change and plastic pollution are driving research into alternatives. Scientists are developing bio-based plastics made from plant materials, improving recycling technologies and exploring new ways to produce fertilizers with lower carbon emissions.

For now, the modern world remains deeply dependent on oil, not only for energy but also for the materials that shape everyday life. When news headlines focus on disruptions to oil supply, the consequences may extend far beyond the gas pump, affecting the products that underpin modern society.The Conversation

About the Author:

André O. Hudson, Dean of the College of Science, Professor of Biochemistry, Rochester Institute of Technology

This article is republished from The Conversation under a Creative Commons license. Read the original article.


COT Energy Charts: Speculator Bets led by Brent Oil & Heating Oil 

By InvestMacro

Speculators OI Energy Futures COT Chart
Here are the latest charts and statistics for the Commitment of Traders (COT) data published by the Commodities Futures Trading Commission (CFTC).

The latest COT data is updated through Tuesday March 3rd and shows a quick view of how large traders (for-profit speculators and commercial entities) were positioned in the futures markets.

Weekly Speculator Changes led by Brent Oil & Heating Oil

Speculators Nets Energy Futures COT Chart
The COT energy market speculator bets were overall lower this week as just two out of the six energy markets we cover had higher positioning while the other four markets had lower speculator contracts.

Leading the gains for the energy markets through Tuesday was Brent Oil (22,025 contracts) with Heating Oil (824 contracts) also having a small positive week.

The markets with declines in speculator bets for the week were Natural Gas (-7,903 contracts), Gasoline (-6,975 contracts), the Bloomberg Index (-1,650 contracts) and with WTI Crude (-562 contracts) also seeing lower bets on the week.

Oil Markets lead Price Performance this week as all 6 Markets saw strong gains on Iran War

Leading the Energy markets this week was WTI Crude Oil, which jumped by approximately 33% over the last five days due to the Iran war. Following next was Heating Oil, which also jumped by over 30%. And Brent Crude Oil was not to be outdone with a gain of 26.17% over that period. Gasoline rose sharply by 20% in the past five days, while Natural Gas was up by 10.73%, and the Bloomberg Commodity Index rose by a strong 8.69%.

These sharp increases in the past week have now pushed all of these six Energy markets higher over the past 30 days and over the past 90 days, with the exception of Natural Gas, which is down by -5.06% in the past 30 days and is also lower by -1.70% in the past 90 days.


Energy Data:

Speculators Table Energy Futures COT Chart
Legend: Weekly Speculators Change | Speculators Current Net Position | Speculators Strength Score compared to last 3-Years (0-100 range)


Strength Scores led by Gasoline & Heating Oil

Speculators Strength Energy Futures COT Chart
COT Strength Scores (a normalized measure of Speculator positions over a 3-Year range, from 0 to 100 where above 80 is Extreme-Bullish and below 20 is Extreme-Bearish) showed that Gasoline (88.5 percent) and Heating Oil (66.7 percent) lead the energy markets this week.

On the downside, Natural Gas (0.0 percent) comes in at the lowest strength level currently and is in Extreme-Bearish territory (below 20 percent). The next lowest strength score was the Bloomberg Commodity Index (40.8 percent).

Strength Statistics:
WTI Crude Oil (42.7 percent) vs WTI Crude Oil previous week (42.8 percent)
Brent Crude Oil (42.0 percent) vs Brent Crude Oil previous week (10.6 percent)
Natural Gas (0.0 percent) vs Natural Gas previous week (5.1 percent)
Gasoline (88.5 percent) vs Gasoline previous week (96.2 percent)
Heating Oil (66.7 percent) vs Heating Oil previous week (65.6 percent)
Bloomberg Commodity Index (40.8 percent) vs Bloomberg Commodity Index previous week (48.6 percent)


WTI Crude & Gasoline top the 6-Week Strength Trends

Speculators Trend Energy Futures COT Chart
COT Strength Score Trends (or move index, calculates the 6-week changes in strength scores) showed that WTI Crude (30.1 percent) and Gasoline (23.2 percent) lead the past six weeks trends for the energy markets.

The Bloomberg Index (-38.9 percent) leads the downside trend scores currently with Natural Gas (-8.3 percent) as the next market with lower trend scores.

Move Statistics:
WTI Crude Oil (30.1 percent) vs WTI Crude Oil previous week (36.9 percent)
Brent Crude Oil (20.9 percent) vs Brent Crude Oil previous week (-22.3 percent)
Natural Gas (-8.3 percent) vs Natural Gas previous week (-8.3 percent)
Gasoline (23.2 percent) vs Gasoline previous week (29.0 percent)
Heating Oil (2.1 percent) vs Heating Oil previous week (3.1 percent)
Bloomberg Commodity Index (-38.9 percent) vs Bloomberg Commodity Index previous week (-31.0 percent)


Individual COT Market Charts:

WTI Crude Oil Futures:

WTI Crude Oil Futures COT ChartThe WTI Crude Oil Futures large speculator standing this week reached a net position of 172,150 contracts in the data reported through Tuesday. This was a weekly decline of -562 contracts from the previous week which had a total of 172,712 net contracts.

This week’s current strength score (the trader positioning range over the past three years, measured from 0 to 100) shows the speculators are currently Bearish with a score of 42.7 percent. The commercials are Bearish with a score of 48.8 percent and the small traders (not shown in chart) are Bullish-Extreme with a score of 100.0 percent.

Price Trend-Following Model: Strong Uptrend

Our weekly trend-following model classifies the current market price position as: Strong Uptrend.

WTI Crude Oil Futures StatisticsSPECULATORSCOMMERCIALSSMALL TRADERS
– Percent of Open Interest Longs:17.140.74.3
– Percent of Open Interest Shorts:8.851.41.9
– Net Position:172,150-222,32750,177
– Gross Longs:355,158842,95789,225
– Gross Shorts:183,0081,065,28439,048
– Long to Short Ratio:1.9 to 10.8 to 12.3 to 1
NET POSITION TREND:
– Strength Index Score (3 Year Range Pct):42.748.8100.0
– Strength Index Reading (3 Year Range):BearishBearishBullish-Extreme
NET POSITION MOVEMENT INDEX:
– 6-Week Change in Strength Index:30.1-38.363.0


Brent Crude Oil Futures:

Brent Last Day Crude Oil Futures COT ChartThe Brent Crude Oil Futures large speculator standing this week reached a net position of -27,468 contracts in the data reported through Tuesday. This was a weekly increase of 22,025 contracts from the previous week which had a total of -49,493 net contracts.

This week’s current strength score (the trader positioning range over the past three years, measured from 0 to 100) shows the speculators are currently Bearish with a score of 42.0 percent. The commercials are Bullish with a score of 58.1 percent and the small traders (not shown in chart) are Bullish with a score of 59.3 percent.

Price Trend-Following Model: Strong Uptrend

Our weekly trend-following model classifies the current market price position as: Strong Uptrend.

Brent Crude Oil Futures StatisticsSPECULATORSCOMMERCIALSSMALL TRADERS
– Percent of Open Interest Longs:25.439.53.4
– Percent of Open Interest Shorts:36.429.42.6
– Net Position:-27,46825,4002,068
– Gross Longs:64,04099,3388,498
– Gross Shorts:91,50873,9386,430
– Long to Short Ratio:0.7 to 11.3 to 11.3 to 1
NET POSITION TREND:
– Strength Index Score (3 Year Range Pct):42.058.159.3
– Strength Index Reading (3 Year Range):BearishBullishBullish
NET POSITION MOVEMENT INDEX:
– 6-Week Change in Strength Index:20.9-20.7-14.1


Natural Gas Futures:

Natural Gas Futures COT ChartThe Natural Gas Futures large speculator standing this week reached a net position of -206,422 contracts in the data reported through Tuesday. This was a weekly decline of -7,903 contracts from the previous week which had a total of -198,519 net contracts.

This week’s current strength score (the trader positioning range over the past three years, measured from 0 to 100) shows the speculators are currently Bearish-Extreme with a score of 0.0 percent. The commercials are Bullish-Extreme with a score of 100.0 percent and the small traders (not shown in chart) are Bullish with a score of 58.9 percent.

Price Trend-Following Model: Downtrend

Our weekly trend-following model classifies the current market price position as: Downtrend.

Natural Gas Futures StatisticsSPECULATORSCOMMERCIALSSMALL TRADERS
– Percent of Open Interest Longs:13.137.83.9
– Percent of Open Interest Shorts:26.026.42.5
– Net Position:-206,422184,36022,062
– Gross Longs:210,477607,90762,972
– Gross Shorts:416,899423,54740,910
– Long to Short Ratio:0.5 to 11.4 to 11.5 to 1
NET POSITION TREND:
– Strength Index Score (3 Year Range Pct):0.0100.058.9
– Strength Index Reading (3 Year Range):Bearish-ExtremeBullish-ExtremeBullish
NET POSITION MOVEMENT INDEX:
– 6-Week Change in Strength Index:-8.31.526.9


Gasoline Blendstock Futures:

RBOB Gasoline Energy Futures COT ChartThe Gasoline Blendstock Futures large speculator standing this week reached a net position of 91,817 contracts in the data reported through Tuesday. This was a weekly decrease of -6,975 contracts from the previous week which had a total of 98,792 net contracts.

This week’s current strength score (the trader positioning range over the past three years, measured from 0 to 100) shows the speculators are currently Bullish-Extreme with a score of 88.5 percent. The commercials are Bearish-Extreme with a score of 6.9 percent and the small traders (not shown in chart) are Bullish-Extreme with a score of 96.2 percent.

Price Trend-Following Model: Strong Uptrend

Our weekly trend-following model classifies the current market price position as: Strong Uptrend.

Nasdaq Mini Futures StatisticsSPECULATORSCOMMERCIALSSMALL TRADERS
– Percent of Open Interest Longs:26.942.86.1
– Percent of Open Interest Shorts:4.768.22.9
– Net Position:91,817-104,85013,033
– Gross Longs:111,324177,26325,236
– Gross Shorts:19,507282,11312,203
– Long to Short Ratio:5.7 to 10.6 to 12.1 to 1
NET POSITION TREND:
– Strength Index Score (3 Year Range Pct):88.56.996.2
– Strength Index Reading (3 Year Range):Bullish-ExtremeBearish-ExtremeBullish-Extreme
NET POSITION MOVEMENT INDEX:
– 6-Week Change in Strength Index:23.2-25.726.3


#2 Heating Oil NY-Harbor Futures:

NY Harbor Heating Oil Energy Futures COT ChartThe #2 Heating Oil NY-Harbor Futures large speculator standing this week reached a net position of 17,655 contracts in the data reported through Tuesday. This was a weekly increase of 824 contracts from the previous week which had a total of 16,831 net contracts.

This week’s current strength score (the trader positioning range over the past three years, measured from 0 to 100) shows the speculators are currently Bullish with a score of 66.7 percent. The commercials are Bearish with a score of 26.0 percent and the small traders (not shown in chart) are Bullish-Extreme with a score of 86.3 percent.

Price Trend-Following Model: Strong Uptrend

Our weekly trend-following model classifies the current market price position as: Strong Uptrend.

Heating Oil Futures StatisticsSPECULATORSCOMMERCIALSSMALL TRADERS
– Percent of Open Interest Longs:18.345.415.4
– Percent of Open Interest Shorts:12.659.17.3
– Net Position:17,655-42,60224,947
– Gross Longs:56,514140,46347,560
– Gross Shorts:38,859183,06522,613
– Long to Short Ratio:1.5 to 10.8 to 12.1 to 1
NET POSITION TREND:
– Strength Index Score (3 Year Range Pct):66.726.086.3
– Strength Index Reading (3 Year Range):BullishBearishBullish-Extreme
NET POSITION MOVEMENT INDEX:
– 6-Week Change in Strength Index:2.1-9.222.0


Bloomberg Commodity Index Futures:

Bloomberg Commodity Index Futures COT ChartThe Bloomberg Commodity Index Futures large speculator standing this week reached a net position of -14,034 contracts in the data reported through Tuesday. This was a weekly reduction of -1,650 contracts from the previous week which had a total of -12,384 net contracts.

This week’s current strength score (the trader positioning range over the past three years, measured from 0 to 100) shows the speculators are currently Bearish with a score of 40.8 percent. The commercials are Bullish with a score of 58.1 percent and the small traders (not shown in chart) are Bearish with a score of 49.9 percent.

Price Trend-Following Model: Strong Uptrend

Our weekly trend-following model classifies the current market price position as: Strong Uptrend.

Bloomberg Index Futures StatisticsSPECULATORSCOMMERCIALSSMALL TRADERS
– Percent of Open Interest Longs:31.666.90.4
– Percent of Open Interest Shorts:38.360.50.0
– Net Position:-14,03413,355679
– Gross Longs:66,250140,036759
– Gross Shorts:80,284126,68180
– Long to Short Ratio:0.8 to 11.1 to 19.5 to 1
NET POSITION TREND:
– Strength Index Score (3 Year Range Pct):40.858.149.9
– Strength Index Reading (3 Year Range):BearishBullishBearish
NET POSITION MOVEMENT INDEX:
– 6-Week Change in Strength Index:-38.939.21.9


Article By InvestMacroReceive our weekly COT Newsletter

*COT Report: The COT data, released weekly to the public each Friday, is updated through the most recent Tuesday (data is 3 days old) and shows a quick view of how large speculators or non-commercials (for-profit traders) were positioned in the futures markets.

The CFTC categorizes trader positions according to commercial hedgers (traders who use futures contracts for hedging as part of the business), non-commercials (large traders who speculate to realize trading profits) and nonreportable traders (usually small traders/speculators) as well as their open interest (contracts open in the market at time of reporting). See CFTC criteria here.

Brent headed for $100?

By ForexTime 

  • Oil benchmarks surge over 15% since Monday on supply fears
  • Spiking energy prices have fueled inflation fears
  • Cooling Fed cut bets could hit equity markets
  • Brent firmly bullish with $90and $100 acting as key levels of interest

Brent oil has rallied as much as 17% since Monday, pushing 2026 gains to 35%.

Why:

  •  Iran conflict: Global oil markets have been thrown into turmoil by the US and Israeli war against Iran. This has halted trade, driven producers to lock output and forced the closure of a major refinery part.


  • Closure of the Strait of Hormuz: This is a narrow waterway that connects the Persian Gulf to the Indian Ocean where around 20% of the world’s oil passes through. Iran has effectively closed this passage – warning that any vessel that passes would be set “ablaze”.

What does this mean?

  • Consumer pain: A sustained rise in oil prices could be bad news for consumers as the cost of petrol and domestic energy bills increases.
  • Inflation fears: Aggressively rising energy prices may raise inflationary fears, forcing markets to push back against rate-cut expectations.
  • Return of equity bears: This domino effect may hit global stocks which have been benefiting from the prospect of lower rates in 2026.

Potential scenarios

Bullish Scenario: The direct military escalation in the Middle East has led to the closure of the Strait of Hormuz. Any supply shock could drive Brent toward $90 and $100.

Bearish Scenario: Easing tensions or the re-opening of the Strait of Hormuz may cool supple-side fears. A break below the $78 support could trigger a sell-off toward $75 for Brent.


Forex-Time-LogoArticle by ForexTime


ForexTime Ltd (FXTM) is an award winning international online forex broker regulated by CySEC 185/12 www.forextime.com

The oil price surge is just one symptom of a supply chain network that is not fit for this age of global tensions

By Maryam Lotfi, Cardiff University 

The escalating conflict between Iran, the US and Israel has taken a critical turn. The strait of Hormuz – one of the most important shipping routes for oil and gas – is facing significant disruption. The strait is the main route connecting Persian Gulf ports in Iran and some of the region’s other oil producers to the open ocean.

The strikes on Iran are already having tangible effects: energy flows are slowing, markets are reacting and supply chains are under pressure. This is not just a regional conflict – it is a global supply chain crisis unfolding in real time.

As an expert on supply chains, I am acutely aware of how central the strait is – not only for the stability of the region but also to the functioning of the global economy.

This narrow corridor is one of the world’s most critical chokepoints – around a fifth of the world’s oil passes through the strait daily. Its sudden disruption represents a “chokepoint failure” – a breakdown at a critical node that triggers cascading effects across global systems.

Tanker traffic has dropped sharply, with vessels waiting in surrounding waters as ship owners reassess the risks. Oil prices surged in response to the strikes and the threat to shipping routes. Analysts have warned that prices could climb significantly higher if the disruption persists.

But crucially, this reaction was not driven solely by actual shortages. Markets respond to uncertainty itself. The mere possibility that several million barrels per day could be disrupted is enough to push prices up, even before supply is properly hit. This reflects a broader feature of geopolitical risk: expectations and perceptions can be as economically powerful as material disruptions.

Because energy underpins almost every sector, these price increases transmit rapidly through supply chains. Higher fuel costs raise transportation expenses, increase production costs and ultimately feed into inflation across goods and services that eventually land with consumers.

The strategic importance of the Gulf states

The disruption is not confined to the strait. Instability across the wider Gulf region also affects the United Arab Emirates, as well as other strategically important energy producers and logistics hubs, such as Qatar, Kuwait and Saudi Arabia.

This dimension matters because the Gulf functions not only as an energy supplier but also as a crossroads in global trade and logistics.

Ports such as Dubai handle vast volumes of international shipping, linking Asia, Europe and Africa. As tensions spread, the reliability of these logistics systems is increasingly called into question.

The result is a shift to more widespread insecurity, where both energy flows and trade infrastructure – things like major container ports, shipping lanes, export terminals and storage facilities – are simultaneously at risk.

Energy is the heart of global supply chains. Manufacturing depends on electricity and fuel, transport relies on oil-based logistics and agriculture depends heavily on natural gas-derived fertilisers. When energy flows are disrupted or become more expensive, the effects propagate across entire networks.

Research on geopolitical crises shows that disruptions to key inputs such as oil and gas quickly translate into broader supply chain instability. This affects production, trade and the availability of goods far beyond the conflict zone. The Iran crisis reflects this dynamic. What begins as disruption in a maritime corridor can become a global economic issue within days.

For decades, global supply chains have been optimised for efficiency. This means that they concentrate sourcing and production in regions that minimise costs. This model has delivered large economic benefits, but it has also created weaknesses in the structure.

The concentration of energy flowing through a single chokepoint such as the strait of Hormuz exemplifies this trade-off. When it is disrupted, the system lacks resilience.

In response, supply chains are likely to accelerate efforts to diversify and invest in alternative energy routes and sources. Countries that are heavily dependent on oil transiting through the Gulf will seek to expand strategic reserves, diversify their import routes and invest in pipelines that bypass maritime chokepoints.

But at the same time, geopolitical instability strengthens the case for renewable energy, electrification and regional energy integration. Expanding solar, wind and green hydrogen capacity reduces exposure to concentrated fossil fuel corridors. And cross-border electricity connections can improve flexibility during shocks. In this sense, resilience is also an energy transition issue.

At the same time, instability in conflict-hit regions can fuel the rise of informal and illegal supply chains, particularly where governance is weakened. These can include things like unregulated oil trading, goods being smuggled through informal maritime routes and labour exploitation hidden within subcontracting chains.

What’s more, supply chains themselves are increasingly shaped by geopolitical forces, as states use trade, energy and logistics networks as instruments of power.

For consumers, this could mean greater price volatility, shortages and reduced choice as firms adjust sourcing strategies in response to sanctions, trade restrictions or security risks. In some cases, it may also mean higher costs over the long term, as businesses prioritise resilience over efficiency.

A turning point for globalisation?

The situation in the strait of Hormuz may mark a turning point in how global supply chains are understood. It has shone a light on a fundamental tension at the heart of globalisation. Efficiency depends on sourcing and production being concentrated in a few locations, but resilience depends on diversification. When critical links in the chain fail, the consequences extend far beyond their immediate location.

This war demonstrates that supply chains are not merely economic systems. They are deeply embedded in geopolitical realities. The challenge ahead is not simply to manage disruption, but to redesign supply chains and energy sources for a world in which geopolitical risk is no longer exceptional, but structural.The Conversation

About the Author:

Maryam Lotfi, Senior Lecturer in Sustainable Supply Chain Management, Cardiff University

This article is republished from The Conversation under a Creative Commons license. Read the original article.


How natural hydrogen, hiding deep in the Earth, could serve as a new energy source

By Promise Longe, University of Kansas 

In the search for more, new and cleaner sources of energy, a largely untapped resource is emerging: natural hydrogen.

Unlike hydrogen produced from industrial processes, natural hydrogen forms through geological reactions that occur normally within the Earth’s crust, meaning it costs nothing to make – though it costs some amount to extract – and does not emit any carbon dioxide or other human‑caused pollutants.

Today, hydrogen is used mainly in oil refining, production of ammonia for fertilizer and to make methanol, which can be a fuel and an ingredient in plastics. Emerging technologies are making hydrogen a viable fuel for cars, planes, ships and factories. Hydrogen demand around the world is projected to grow from around 90 million metric tons in 2022 to more than 500 million metric tons by 2050. Some of that supply could come from nature itself, as well.

To describe each source of hydrogen, energy researchers like me, and the energy industry as a whole, use a range of colors. In general, “gray” and “blue” hydrogen are made by burning fossil fuels, with blue hydrogen incorporating technology that captures the carbon dioxide produced in the process to reduce emissions. “Green” hydrogen comes from renewable‑energy‑powered electrolysis, using electricity to split water into hydrogen and oxygen. “White” or “gold” hydrogen occurs naturally underground and can be extracted directly with minimal processing.

How natural hydrogen forms

Natural hydrogen originates from several geological processes. The most well‑studied mechanism is serpentinization, a reaction where water interacts with iron‑rich rocks known as ultramafics, releasing hydrogen gas.

Serpentinization occurs in diverse settings around the world, including ocean ridges and continental formations such as the Midcontinent Rift in North America, a band of mostly igneous rocks with some sedimentary rocks mixed in, which extends from Minnesota through the Lake Superior region and southward toward Kansas.

Another process, thermogenic hydrogen formation, occurs in deep sedimentary basins when organic material decomposes under high temperatures, roughly 480 to 930 degrees Fahrenheit (250 to 500 degrees Celsius). These reactions can also produce hydrogen alongside other gases, such as methane or nitrogen.

Because these processes happen over millions of years, using natural hydrogen generally requires far less energy than human‑made methods such as electrolysis, which consumes roughly 50 kilowatt-hours of electricity per kilogram of hydrogen produced – enough to power an average home for a day or two, and more than the energy that kilogram of hydrogen can provide. Natural hydrogen is already made – it just has to be collected.

The science and the search

Researchers and exploration companies are developing methods similar to those used in oil and gas exploration to locate potential hydrogen accumulations. They are looking at three types of geological formations:

  1. Focused seepage, where hydrogen seeps naturally through cracks and faults. It tends to reach the surface and disperse quickly, making large-scale capture difficult.
  2. Coal beds, where hydrogen binds to coal layers, offer higher potential density but pose difficulties for extraction. The hydrogen must first be separated from the coal and then flow through tight rock layers to the extraction point.
  3. Reservoir‑trap‑seal systems, comparable to the rock formations that trap natural gas underground, are considered the most promising for commercial production because they can concentrate large volumes of hydrogen in well‑defined, drillable structures. However, they remain largely unproven in practice: The basic idea is well established, and geologists have a good sense of where those formations might occur, but they still lack detailed data on how much hydrogen these formations actually contain and how easy it would be to extract.

Massive reserves – somewhere

The U.S. Geological Survey estimates there could be more than 5 trillion metric tons of geological hydrogen underground around the world. But only a small fraction of that is estimated to be recoverable, both technically and in terms of reasonable costs.

However, even 2% of that total would be more than all proven natural gas reserves on the planetand enough to meet projected demand for the next 200 years, even accounting for increased consumption.

All of that reserve has built up over billions of years. The Earth naturally produces between 15 million and 31 million metric tons of natural hydrogen each year – less than 1% of the amount expected to be needed each year by 2050. But only a fraction of that is likely to be efficiently captured.

So geologic hydrogen is likely best viewed as a very large but ultimately finite source of low‑carbon energy that can substantially complement, but not replace, other energy sources, including various methods of producing hydrogen.

Global hot spots

Currently, only one hydrogen field, at Mali’s Bourakébougou village, produces natural hydrogen commercially, supplying tens of tons of hydrogen per year to power the village.

However, the number of companies exploring for natural hydrogen has increased rapidly, from roughly 10 in 2020 to about 40 by the end of 2023, according to Rystad Energy and related government and research‑lab reports.

Apart from that one field in Mali, exploration is concentrated in the United States, Australia, Canada and several European countries.

In the U.S., HyTerra’s Nemaha Project in Kansas has confirmed subsurface hydrogen concentrations reaching more than 90% hydrogen and 3% helium. The higher the concentration of hydrogen, the more efficient and cost‑effective it is to recover. HyTerra is also exploring elsewhere in the Midwest and Rocky Mountain regions.

A close-up image of a rock that is mottled in shades of green and gray.
The geologic process of forming serpentinite can produce hydrogen.
James St. John via Flickr, CC BY

Technical barriers

Transforming geological hydrogen into a commercial energy source presents tough scientific and technical challenges. Detecting and measuring hydrogen underground is difficult because of its small molecular size and reactivity with other elements in the rocks.

And if what’s found is low concentrations of hydrogen mixed with large amounts of other gases, it can be costly, even prohibitively so, to separate and purify the hydrogen before it can be used.

Economics and efficiency

The economic promise of natural hydrogen lies in its simplicity.

Because geological processes already performed the production work, early estimates suggest that extraction costs could be one‑tenth the production costs for other traditional hydrogen generation techniques – or possibly even less than that.

But those figures are based on the small amounts of hydrogen found so far and may not represent future large‑scale performance. Producing enough to serve commercial demand will require discovering large, high-quality accumulations.

As one leading research group noted, “This is not a gold rush.” It’s a careful exploration for scientific evidence that could lead, in time, to an abundant, carbon‑free and continuous energy source that complements other renewable energy sources.The Conversation

About the Author: 

Promise Longe, Ph.D. Candidate in Chemical and Petroleum Engineering, University of Kansas

This article is republished from The Conversation under a Creative Commons license. Read the original article.


Uranium Is Now a Critical Mineral, and This Co. Is On a Fast Track to US Production

Source: Streetwise Reports (2/9/26)

The U.S. introduces new initiatives aimed at forming a preferential trade bloc for critical minerals like uranium. This company is on a literal fast-track for its projects in the Southwest.

Last week, the U.S. introduced new initiatives aimed at forming a preferential trade bloc for critical minerals like uranium, including coordinated price floors, as part of efforts to counter China’s dominance in this essential market for technology and defense, according to a CNBC report on February 5 by Dylan Butts.

These plans were discussed at a “Critical Minerals Ministerial” in Washington, which included representatives from 54 countries, the European Union, and senior Trump administration officials. Following the event, Washington announced that it had signed bilateral critical minerals agreements with 11 countries, building on 10 similar agreements made over the past five months. Negotiations were also completed with an additional 17 nations.

The Trump administration’s new minerals stockpile initiative, known as “Project Vault,” can encompass any materials identified as “critical” by the U.S. Geological Survey, a White House official told CNBC, according to another February 3 report by Pippa Stevens and Spencer Kimball for the website. The agency, which is part of the Interior Department, lists over 50 minerals as critical, including rare earths, lithium, uranium, and copper. These minerals are considered essential for national security, economic stability, and supply chain resilience. According to the USGS, these minerals are crucial because they “underpin key industries, drive technological innovation, and support critical infrastructure vital for a modern American economy.”

The objectives of these agreements are to tackle pricing challenges, encourage development, create fairer markets, and expand access to financing in the critical minerals sector. Secretary of State Marco Rubio, who hosted the Ministerial, also announced the creation of the “Forum on Resource Geostrategic Engagement (FORGE)” on Wednesday. This partnership aims to coordinate critical mineral policy and projects.

“We have a number of countries that have signed on to that, and many more that we hope will do so… the purpose of FORGE is to foster collaboration and to build a network of partners across the world,” Rubio said.

FORGE will complement an earlier initiative between the U.S. and nine partners, known as “Pax Silica.” While Pax Silica focuses on safeguarding AI-related supply chains, FORGE is designed as a broader platform to coordinate critical mineral policy, pricing, and project development. Rubio highlighted the risks associated with the concentration of critical minerals in “one country,” implicitly referring to China, including geopolitical leverage and potential disruptions from pandemics or instability.

AI, Data Centers Begin Impacting Power Grids

Uranium is becoming one of the most important of these minerals. Predictions of increased electricity consumption from data centers are beginning to materialize, raising concerns about the impact on the power grid and the environment, according to a report by Benjamin Storrow for E&E News/Politico on December 24, 2025.

Commercial electricity demand, which serves as a proxy for data center power usage, rose by 2% in the first nine months of 2025 compared to the same period last year, following a 3% increase in 2024. This marks a significant shift for the U.S. power sector, which had experienced flat electricity demand for much of the past two decades.

Demand is expected to climb even higher as the Trump administration and tech companies aim to outpace China in artificial intelligence development. The consulting firm Grid Strategies forecasts that peak electricity demand nationwide could rise by 166 gigawatts by 2030, equivalent to adding 15 New York Cities over the next five years.

“We’re now seeing in the data what we’ve all been talking about the last couple years,” said Rob Gramlich, CEO of Grid Strategies. He estimated that data centers would contribute to 55% of the growth in U.S. electricity demand over the next five years. The increasing power needs of data centers have become a political issue as electricity costs rise for consumers.

AI data centers and the electrification of various industries are driving a surge in power demand that exceeds global supply, prompting companies, policymakers, and investors to reconsider nuclear power, according to a research report by Morgan Stanley on August 28, 2025. Morgan Stanley Research projects 586 gigawatts (GW) of new global nuclear capacity by 2050, which is 53% higher than their previous forecast last year when analysts noted a “renaissance” in the industry. They now estimate that potential investments in the nuclear value chain could reach US$2.2 trillion by 2050, up from the initial US$1.5 trillion forecast. This increased momentum is expected to benefit several sectors, including uranium mining, nuclear power generation, and the construction of equipment and plants. “The nuclear renaissance has been building for some time already—with 22 nations pledging to triple nuclear capacity by 2050 at the COP28 summit in December 2023, plant life extensions in Europe, a strong pipeline in China, and Japan continuing to restart capacity,” says Tim Chan, Morgan Stanley’s Head of Asia Sustainability Research. “The dual imperatives of decarbonization and energy security are making the nuclear renaissance a truly global investment theme.”

While natural gas is currently the primary alternative to meet AI’s energy needs, technology companies are willing to pay a premium to transition to nuclear energy. “We believe natural gas will be the primary near-term solution for powering AI data centers due to its speed to market, reliability, and flexibility, while nuclear power represents a longer-term clean energy alternative that is likely to gradually increase in importance,” said Stephen Byrd, Morgan Stanley’s Global Head of Sustainability Research. “Gas and nuclear are likely to play complementary roles.”

Uranium Is Now a Critical Mineral

Last fall, the USGS released the final 2025 list of critical minerals deemed essential to mitigate potential risks from disrupted supply chains, reported Nick Mordowanec for Military.com on December 1, 2025. Ten new minerals were added, including uranium, bringing the total to 60.

“This is the most comprehensive, science-based assessment yet of the minerals our nation relies on,” said USGS Director Ned Mamula. “Critical minerals underpin industries worth trillions of dollars, and import dependence puts key sectors at risk. This work helps secure the materials needed for U.S. economic growth and technological leadership.”

Trump has called for a quadrupling of nuclear power by 2050, the article reported.

Christo Liebenberg, co-founder and president of the U.S.-based uranium enrichment company LIS Technologies, told Military.com that there is “huge market demand” for uranium to bolster a domestic electricity grid facing challenges from expanding AI data centers across the country.

He noted the significance of the critical list now including 60 minerals — more than half of the 118 elements on the periodic table.

“Being on that list, it’s clear that it triggers a whole set of advantages,” Liebenberg said. “That makes mining uranium in the U.S. a lot easier, faster, and more attractive to investors. It’s like flipping a switch that says, ‘OK, everybody, uranium is now important. Let’s make mining in the US easier, cheaper, faster, and more predictable.’ Of course, this is exactly what would stimulate production. But the thing is, it doesn’t stop just with mining. Being on that list actually has a ripple effect through the entire nuclear fuel supply chain.”

Key actions and impacts for uranium under the U.S. critical minerals framework include fast-tracked permitting, reduced foreign reliance, strategic stockpiling, improved support for the mining industry, and energy security.

Companies With Tangible Operational Progress in the Spotlight

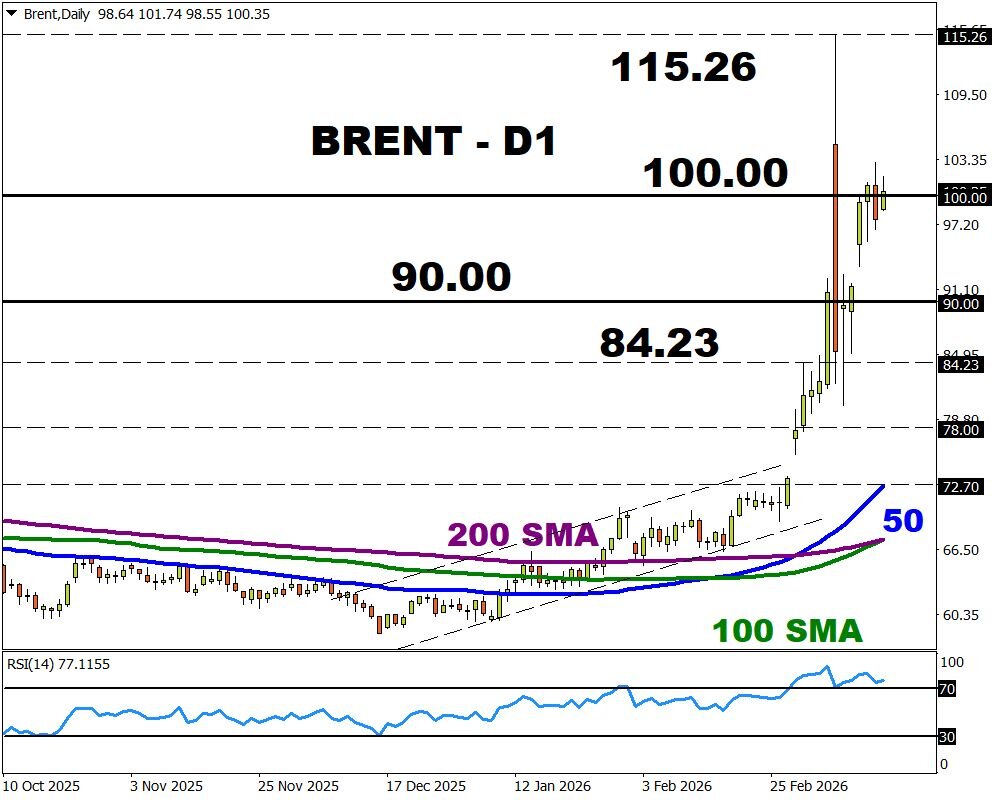
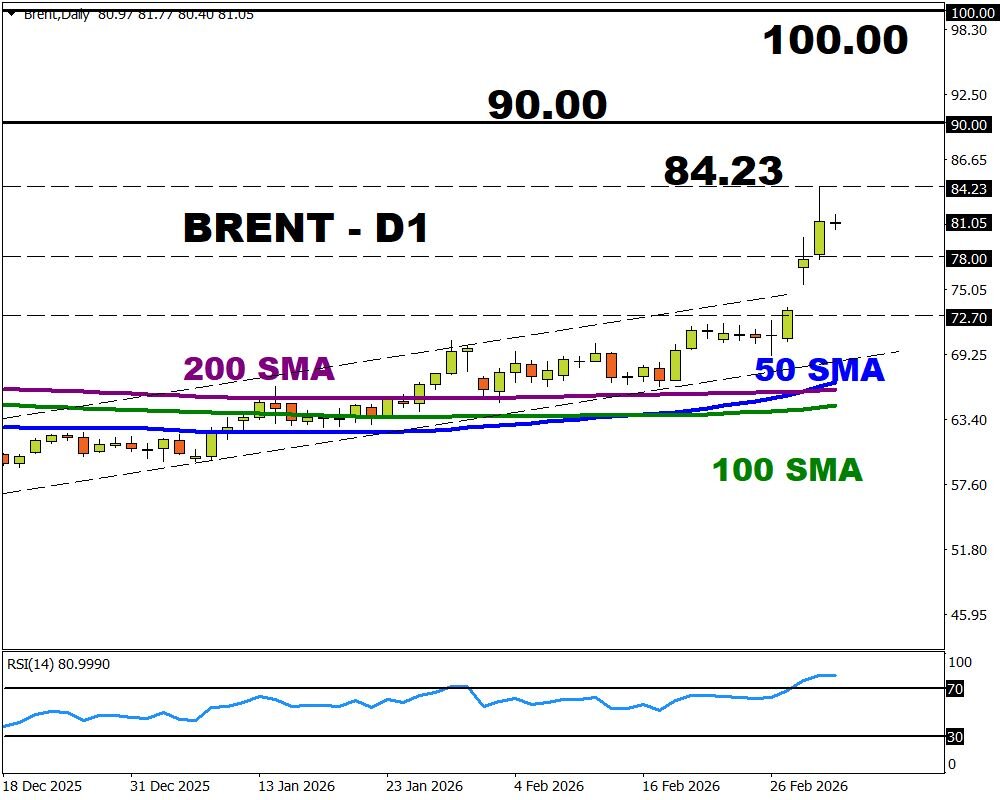
The uranium sector enters 2026 at a pivotal moment where operational execution increasingly distinguishes credible investment opportunities from speculative ventures, according to Henry Mann writing for Crux Investor on January 27. Spot uranium prices reached US$100 per pound in January 2026, marking 17-month highs. However, equity valuations across the sector reflect ongoing institutional caution about timing mismatches between nuclear buildouts and the upstream uranium supply response.

In this context of structural demand growth and supply fragility, companies demonstrating tangible operational progress — such as permitting momentum — are positioning themselves to attract capital as the gap between operational reality and equity pricing narrows, Mann wrote.

Chris Frostad, CEO of Purepoint Uranium, explains the demand fundamentals, according to Mann: “When a reactor begins operation, it creates a customer relationship lasting 40 years or more. Reactors operate under strict refueling schedules, and utilities know precisely how much fuel they will require annually for years into the future.” The growth in artificial intelligence infrastructure and data centers adds incremental demand considerations, though existing reactor fleets provide the foundation of predictable consumption.

In 2025, utilities contracted for approximately 82-85 million pounds of uranium, while replacement requirements approached 150-180 million pounds. However, utility contracting does not follow smooth patterns, as buyers may contract for 250 million pounds in a single year when conditions align with their strategies.

Laramide Resources Ltd.

One company uniquely positioned to take advantage of these events is Laramide Resources Ltd. (LAM:TSX; LMRXF:OTCQX: LAM:ASX), a uranium developer with both in-situ and hard-rock deposits located in the southwestern United States and Australia.

In June 2025, Laramide announced that its advanced-stage uranium projects, Crownpoint-Churchrock and La Jara Mesa in New Mexico, were designated as FAST-41 covered projects by the Federal Permitting Improvement Steering Council. This designation is part of the federal infrastructure permitting program established under Title 41 of the Fixing America’s Surface Transportation Act. It underscores the strategic importance of Laramide’s projects and streamlines the evaluation process.

The FAST-41 designation places these uranium projects among a select group of federally prioritized energy initiatives, receiving enhanced permitting coordination and transparency to support the Department of Energy’s domestic uranium reserve and the U.S. government’s broader energy-security goals.

“The project comprises two geographically distinct deposits: one at Crownpoint and the other at Churchrock,” the company said in a recent recap sent to Streetwise Reports. “They are unified under a single U.S. Nuclear Regulatory Commission (NRC) Source Material License. This regulatory status differentiates the project from many U.S. peers that remain at earlier permitting stages.”

Churchrock’s current NI 43-101 Inferred Mineral Resource is 50.8 million pounds U₃O₈ based on historic drilling consolidated into a modern database. Crownpoint adds an NI 43-101 Inferred Mineral Resource of 5.1 million pounds U₃O₈, also derived from historic datasets and interpreted for ISR-style mineralization geometry, the company said.

Laramide’s U.S. portfolio is “increasingly relevant against the backdrop of declining domestic uranium production and growing demand tied to nuclear energy, including life-extensions of existing reactors and new investments linked to data centers and advanced nuclear technologies,” Laramide said in the document. “With the majority of U.S. uranium supply currently imported, projects that are licensed, permitted, or moving visibly through federal processes have taken on heightened strategic importance.”

Analyst: Co. ‘Scans Very Well on Value’

Laramide is a uranium exploration and development company with projects in the western United States and Australia, according to Beacon Securities Analyst Michael Curran in an updated research note on November 3, 2025.

Crownpoint-Churchrock’s designation as a FAST-41 project is expected to streamline the permitting process as part of the U.S. government’s initiative to advance domestic critical mineral and metal projects toward production. This followed a similar designation for LAM’s La Jara Mesa project in early May, also in New Mexico.

“In mid-July, LAM’s Westmoreland project in Queensland, Australia, received a Mineral Development License (MDL), which allows Laramide to proceed with studies to advance the project towards a Mining Lease (ML) application,” the analyst wrote. “This work is likely to include metallurgical testing, environmental, engineering and design studies, as well as feasibility-related work.”

In July, Laramide raised gross proceeds of CA$12 million by issuing 20 million common shares at CA$0.60 each.

Beacon’s 12-month fair value increased from CA$1.45 to CA$1.50 per LAM share. As this still represents significant upside from current price levels, the firm maintained its BUY rating for Laramide Resources.

“In our view, Laramide represents an attractive investment for exposure to uranium developments in the top-tier mining jurisdictions,” Curran wrote. “Laramide’s assets are in areas of historical uranium mining, thus should have lower barriers to development than other jurisdictions.”

Curran said the firm’s preferred valuation for mining equities uses cash flow-based metrics such as P/CF and P/NAV, utilizing life-of-mine production forecasts and commodity price assumptions.

“However, for earlier-staged explorers where it is arguably too early to create a DCF model with much accuracy, we employ a more basic valuation metric of Adjusted Market Capitalization per total resource (AMC/lb) or Enterprise Value per resource pound (EV/lb),” the analyst wrote. For Laramide, he employed a hybrid model using DCF-based valuation for Churchrock and EV/lb valuation methods for the company’s other U.S. and Australian assets. Curran noted that Beacon currently did not attribute any value to the Kazakhstan assets.

Streetwise Ownership Overview*

Laramide Resources Ltd. (LAM:TSX; LMRXF:OTCQX: LAM:ASX)

Retail: 70%
Strategic Investors: 19%
Insiders and Management: 11%

*Share Structure as of 2/9/2026

Churchrock is recognized as a development-ready asset, as noted by SCP Equity Research analysts J. Chan, E. Magdzinski, and K. Kormpis in a June 3 research note. The company’s January 2024 PEA forecasts a 31-year operational lifespan, producing 31.2 million pounds at an all-in sustaining cost of US$34.83 per pound using ISR extraction methods.

With uranium valued at US$75 per pound, this results in a US$239 million after-tax NPV, strongly supporting Laramide’s evaluation. The plan involves accelerating wellfield development to increase output to 2-3 million pounds, thereby shortening the operational timeline while improving financial outcomes.

“We think Laramide scans very well on value, with two projects of reasonable size/scale in the U.S. and Australia (arguably two of the top three jurisdictions in today’s geopolitically bifurcating market),” the analysts remarked, giving the stock a Buy rating with a CA$1.35 per share target price.

Ownership and Share Structure1

Laramide reports that insiders and management hold about 11% of the company, with strategic corporate entity Boss Energy Ltd. owning 19%. The remainder is held by retail investors.

Other major shareholders include Alps Advisors with 9.4%, Henderson with 6.82%, Mirae Asset Global Investments LLC with 4.78%, and Vident Investment Advisory LLC with 1.1%. As of February 9, its market capitalization is CA$215.06 million, with 283.62 million shares outstanding. It trades within a 52-week range of CA$0.46 to CA$0.91.


Important Disclosures:

  1. Laramide Resources Ltd. is a billboard sponsor of Streetwise Reports and pays SWR a monthly sponsorship fee between US$3,000 and US$6,000.
  2. Steve Sobek wrote this article for Streetwise Reports LLC and provides services to Streetwise Reports as an employee.
  3. This article does not constitute investment advice and is not a solicitation for any investment. Streetwise Reports does not render general or specific investment advice and the information on Streetwise Reports should not be considered a recommendation to buy or sell any security. Each reader is encouraged to consult with his or her personal financial adviser and perform their own comprehensive investment research. By opening this page, each reader accepts and agrees to Streetwise Reports’ terms of use and full legal disclaimer. Streetwise Reports does not endorse or recommend the business, products, services or securities of any company.

For additional disclosures, please click here.

1. Ownership and Share Structure Information

The information listed above was updated on the date this article was published and was compiled from information from the company and various other data providers.

Final Approval Clears the Way for Full-Scale Uranium Push in Paraguay

Source: Streetwise Reports (2/23/26) 

Vanguard Mining Corp. (UUU:CSE; UUUFF:OTC; SL51:FWB) received its final environmental licences for the Yuty PrometeoSan Jose Uranium Project in southeastern Paraguay. Read how the approvals complete the permitting process and coincide with Vanguards application for a Prospection Permit to advance uranium exploration.

Fraser Institute Jurisdiction Rating
Vanguard Mining Corp.

British Columbia
(last modified 11/26/25)
Friendly Policies 67.42%
Best Practices Mineral Potential Index 85.45%
Socioeconomic Agreements/Community Development Conditions, aka Safety 40%
Political Stability 50%

Data from the
Fraser Institute’s Mining Survey

Vanguard Mining Corp. (UUU:CSE; UUUFF:OTC; SL51:FWB) announced that it has secured its final set of Environmental Licences from Paraguay’s Ministerio del Ambiente y Desarrollo Sostenible (MADES), completing the licensing process for its 90,000-hectare Yuty Prometeo–San Jose Uranium Project in southeastern Paraguay.

The company reported that the Environmental Licences now cover the entire land position at Yuty Prometeo–San Jose, with no additional environmental approvals required. Concurrently, Vanguard has submitted an application for a Prospection Permit with Paraguay’s Vice Ministry of Mining and Energy (VMME), which is described as a critical step toward full-scale uranium exploration authorization.

This development coincides with Paraguay’s growing profile in the global critical minerals sector, highlighted by its participation alongside the United States in a high-level ministerial summit in Washington, D.C., hosted by the U.S. Department of State. The meeting on February 4 addressed cooperation on uranium, lithium, and rare earth element supply chains. Paraguay’s Deputy Minister of Mines and Energy, Mauricio Bejarano, cited rising global demand as a factor drawing international attention to the country.

David Greenway, Chief Executive Officer of Vanguard Mining, stated in a company news release, “The receipt of our final MADES Environmental Licences marks a significant permitting milestone and further advances the Yuty Prometeo–San Jose Uranium Project toward prospection authorization.”

According to the company, the project area spans four concessions — three San Jose and one Prometeo — within the Paraná Basin. The Prometeo Concession covers approximately 27,666 hectares and is adjacent to Uranium Energy Corp.’s (UEC) Yuty Project. Historical data referenced in the news release described uranium-bearing mineralization identified in seven of 27 drill holes completed on the Prometeo property, including one hole reporting values between 0.05% and 0.10% U₃O₈ across 107 meters. The San Jose concessions cover an additional 62,210 hectares. A radiometric car survey conducted over this area identified significant uranium anomalies.

Vanguard noted that all drill results are historical in nature and have not been independently verified. The company intends to complete confirmatory drilling to validate this information in accordance with NI 43-101.

Uranium Market Sees Rising Production and Tightening Supply

According to a February 2 report from Mining.com, uranium production forecasts increased as Kazatomprom projected 71.5 to 75.4 million pounds of U₃O₈ output, marking a 9% rise over the previous year. The company attributed the increase to ramp-up activities at its Budenovskoye joint venture in southern Kazakhstan. Analyst Alexander Pearce of BMO Capital Markets noted the projection was 6% higher than BMO’s internal estimates and commented that “the update could see some modest pressure on uranium prices via a slightly reduced supply deficit near-term.”

In a February 4 article published by Mining.com, Blair McBride reported that the Sprott Physical Uranium Trust purchased 250,000 pounds of uranium oxide, bringing its first-quarter total to 3.65 million pounds. That purchase contributed to a total inventory of 78.4 million pounds and marked Sprott’s second-highest quarterly acquisition in four years. The report noted that the uranium spot price fell from US$101.55 per pound to US$91.80 per pound during the same week.

Materials from Sprott.com released in February outlined broader sector dynamics. The firm stated there were 436 operational nuclear reactors globally, with 190 additional units either planned or under construction, based on data from the World Nuclear Association as of January 13. Sprott wrote that “global uranium production in 2024 covered less than 80% of reactor demand,” with the shortfall offset by inventory drawdowns and spot market activity. It also noted that uranium inventories at nuclear power plants had reached “strategic lows,” creating what the firm described as significant pent-up demand from utilities.

Sprott further explained that even if all existing and planned uranium mines operated at peak levels, they were not expected to meet projected reactor demand through 2045. The firm stated that this shortfall could reach 1.4 billion pounds under current scenarios and up to 3 billion pounds if global nuclear capacity were to triple. The report also highlighted that uranium and uranium miners had outperformed other major asset classes over the prior five-year period, based on internal performance tracking.

“Key Property of Interest”: Analyst Flags Vanguard’s Uranium Project as Standout Asset

1In a December 23 technical commentary, John Newell of John Newell & Associates referred to Vanguard Mining Corp. as a situation where “the fundamentals, the asset base, and the technical picture are beginning to align.” He noted that the company held a diversified portfolio of uranium, copper, and gold assets across the Americas, with core uranium concessions in Paraguay’s Paraná Basin and base metals projects in British Columbia. He described the Yuty Prometeo Uranium Project as the company’s “key property of interest” and stated it had “the greatest potential to move Vanguard’s shares.”

Newell highlighted that the Prometeo Uno concession had returned uranium grades ranging from 0.05% to 0.10% U₃O₈ from 28 historical drill holes. He added that geophysical surveys and sampling suggested the property “aligns with the same regional trend” as known mineralization in the area. He called the setting “compelling” and pointed to upcoming confirmatory drilling as a “clear near-term catalyst that could materially de-risk the project.”

Regarding the company’s British Columbia assets, Newell stated that the Redonda Copper-Molybdenum Project and Brussels Creek Gold-Copper-Palladium Project were “prospective for porphyry-style systems.” He also noted that Vanguard held “an early-stage lithium brine project in Argentina” for exposure to the battery metals sector.

Newell acknowledged the company’s oversubscribed August 2025 financing and stated that Vanguard appeared “funded for upcoming exploration programs and reducing near-term financing risk.” He described the capital structure as “reasonable for a company at this stage and offers leverage to exploration success.”

From a technical perspective, he wrote that the stock’s chart showed “a long base forming after the sharp decline seen through late 2023 and early 2024,” along with a “progressive series of higher lows, accompanied by improving volume, suggesting accumulation rather than distribution.” He identified several upside targets, including CA$0.32 (met), CA$0.50, CA$0.90, and a broader long-term target of CA$1.50.

Newell concluded, “With a tight share structure, experienced management, exposure to uranium and copper in proven jurisdictions, and a constructive technical setup, Vanguard Mining checks several boxes for speculative investors.” He assigned the company a “Speculative Buy rating.”

Upcoming Work and Regulatory Milestones

Vanguard Mining outlined several near-term programs and policy developments related to its uranium and copper-gold exploration assets in its investor presentation. In Paraguay, the company plans to conduct a confirmatory drill program. The objective of this program is to validate historical results and potentially align the concession with the adjacent uranium trend associated with UEC’s Yuty project. Vanguard noted that successful assays would support a maiden resource estimate pathway.

In British Columbia, the company has scheduled trenching and drilling at its Brussels Creek Project. These efforts are aimed at testing priority gold-copper targets identified through historical exploration. The company highlighted that the project’s proximity to infrastructure such as highways, power, and services may reduce exploration and development risk.

Additionally, the company’s August 2025 financing, which raised CA$2.32 million, was described in the investor presentation as providing funding for uranium exploration in Paraguay and gold-copper work in British Columbia.

Streetwise Ownership Overview*

Vanguard Mining Corp. (UUU:CSE; UUUFF:OTC; SL51:FWB)

Retail: 96.05%
Management & Insiders: 3.95%
Share Structure as of 2/18/2026

Market and policy catalysts identified in the company’s investor materials included increasing uranium spot prices, an expanding global fleet of nuclear reactors, and support from U.S. initiatives such as Section 232 tariffs on critical minerals. The company also pointed to rising electricity demand from artificial intelligence and data centers as a relevant factor supporting interest in nuclear energy.

Ownership and Share Structure2

3.95% of Vanguard Mining is owned by management and insiders.

The rest is retail.

Vanguard Mining Corp. has 76,306,621 shares outstanding and an estimated market capitalization of approximately US$12.36 million, based on recent trading prices. Shares trade in a 52-week range between US$0.06 and US$0.49.


Important Disclosures:

  1. Vanguard Mining is a billboard sponsor of Streetwise Reports and pays SWR a monthly sponsorship fee between US$3,000 and US$6,000. In addition, Vanguard Mining has a consulting relationship with Street Smart an affiliate of Streetwise Reports. Street Smart Clients pay a monthly consulting fee between US$8,000 and US$20,000.
  2. As of the date of this article, officers, contractors, shareholders, and/or employees of Streetwise Reports LLC (including members of their household) own securities of Vanguard Mining.
  3. James Guttman wrote this article for Streetwise Reports LLC and provides services to Streetwise Reports as an employee.
  4.  This article does not constitute investment advice and is not a solicitation for any investment. Streetwise Reports does not render general or specific investment advice and the information on Streetwise Reports should not be considered a recommendation to buy or sell any security. Each reader is encouraged to consult with his or her personal financial adviser and perform their own comprehensive investment research. By opening this page, each reader accepts and agrees to Streetwise Reports’ terms of use and full legal disclaimer. Streetwise Reports does not endorse or recommend the business, products, services or securities of any company.

For additional disclosures, please click here.

1. Disclosure for the quote from the John Newell article published on December 23, 2025

  1. For the quoted article (published on December 23, 2025), the Company has paid Street Smart, an affiliate of Streetwise Reports, US$3,000.
  2. Author Certification and Compensation: [John Newell of John Newell and Associates] was retained and compensated as an independent contractor by Street Smart for writing this article. Mr. Newell holds a Chartered Investment Management (CIM) designation (2015) and a  U.S. Portfolio Manager designation (2015). The recommendations and opinions expressed in this content reflect the personal, independent, and objective views of the author regarding any and all of the companies discussed. No part of the compensation received by the author was, is, or will be directly or indirectly tied to the specific recommendations or views expressed.

John Newell Disclaimer

As always it is important to note that investing in precious metals like silver carries risks, and market conditions can change violently with shock and awe tactics, that we have seen over the past 20 years. Before making any investment decisions, it’s advisable consult with a financial advisor if needed. Also the practice of conducting thorough research and to consider your investment goals and risk tolerance.

2. Ownership and Share Structure Information

The information listed above was updated on the date this article was published and was compiled from information from the company and various other data providers.

COT Energy Charts: WTI Crude Speculator Bets rise to highest level since August

By InvestMacro

Speculators OI Energy Futures COT Chart
Here are the latest charts and statistics for the Commitment of Traders (COT) data published by the Commodities Futures Trading Commission (CFTC).

The latest COT data is updated through Tuesday February 17th and shows a quick view of how large traders (for-profit speculators and commercial entities) were positioned in the futures markets.

Weekly Speculator Changes led by WTI Crude Oil

Speculators Nets Energy Futures COT Chart
The COT energy market speculator bets were overall lower this week as just two out of the six energy markets we cover had higher positioning while the other four markets had lower speculator contracts.

Leading the gains for the energy markets was WTI Crude (23,529 contracts) with the Bloomberg Commodity Index (80 contracts) also having a small positive week.

The markets with declines in speculator bets for the week were Natural Gas (-13,947 contracts), Heating Oil (-4,050 contracts), Gasoline (-1,214 contracts) and with Brent Oil (-185 contracts) also seeing lower bets on the week.

WTI Crude Speculator Bets rise to highest level since August

Leading the energy markets for speculative bets this week was WTI Crude Oil, which rose by over +23,000 contracts on the week. This was the fifth week out of the past six that the WTI net large speculative positions improved.

This recent positive sentiment has pushed the overall net speculative standing above the +100,000 contract level for the first time since September. This week’s speculative position (+141,343 net contracts) is now at the highest standing since August 5th of 2025, a span of 28 weeks.

Heating Oil and Brent Oil lead the Energy Market Price Performances on the Week

Leading the energy markets over the past week was Heating Oil with a 7.55% gain. Brent Crude Oil was not far behind with a 6.27% increase, while WTI Crude Oil also advanced by 5.85%. Gasoline was higher by 4.70% and the Bloomberg Commodity Index rounded out the gainers with a 3.03% uptick on the week.

Natural Gas was the only market over the last five trading periods that was lower with a -3.38% decrease.


Energy Data:

Speculators Table Energy Futures COT Chart
Legend: Weekly Speculators Change | Speculators Current Net Position | Speculators Strength Score compared to last 3-Years (0-100 range)


Strength Scores led by Gasoline & Heating Oil

Speculators Strength Energy Futures COT Chart
COT Strength Scores (a normalized measure of Speculator positions over a 3-Year range, from 0 to 100 where above 80 is Extreme-Bullish and below 20 is Extreme-Bearish) showed that Gasoline (85.1 percent) and Heating Oil (63.7 percent) lead the energy markets this week.

On the downside, Natural Gas (5.4 percent) comes in at the lowest strength level currently and is in Extreme-Bearish territory (below 20 percent). The next lowest strength score was Brent Oil (29.4 percent) and then WTI Crude (32.7 percent).

Strength Statistics:
WTI Crude Oil (32.7 percent) vs WTI Crude Oil previous week (25.1 percent)
Brent Crude Oil (29.4 percent) vs Brent Crude Oil previous week (29.7 percent)
Natural Gas (5.4 percent) vs Natural Gas previous week (15.1 percent)
Gasoline (85.1 percent) vs Gasoline previous week (86.4 percent)
Heating Oil (63.7 percent) vs Heating Oil previous week (69.1 percent)
Bloomberg Commodity Index (55.4 percent) vs Bloomberg Commodity Index previous week (55.0 percent)


WTI Crude & Gasoline top the 6-Week Strength Trends

Speculators Trend Energy Futures COT Chart
COT Strength Score Trends (or move index, calculates the 6-week changes in strength scores) showed that WTI Crude (27.1 percent) and Gasoline (20.7 percent) lead the past six weeks trends for the energy markets.

Natural Gas (-14.2 percent) and Brent Oil (-12.0 percent) lead the downside trend scores currently with Heating Oil (-4.6 percent) as the next market with lower trend scores.

Move Statistics:
WTI Crude Oil (27.1 percent) vs WTI Crude Oil previous week (17.2 percent)
Brent Crude Oil (-12.0 percent) vs Brent Crude Oil previous week (-12.1 percent)
Natural Gas (-14.2 percent) vs Natural Gas previous week (-11.9 percent)
Gasoline (20.7 percent) vs Gasoline previous week (18.7 percent)
Heating Oil (-4.6 percent) vs Heating Oil previous week (2.4 percent)
Bloomberg Commodity Index (13.4 percent) vs Bloomberg Commodity Index previous week (25.0 percent)


Individual COT Market Charts:

WTI Crude Oil Futures:

WTI Crude Oil Futures COT ChartThe WTI Crude Oil Futures large speculator standing this week reached a net position of 141,343 contracts in the data reported through Tuesday. This was a weekly advance of 23,529 contracts from the previous week which had a total of 117,814 net contracts.

This week’s current strength score (the trader positioning range over the past three years, measured from 0 to 100) shows the speculators are currently Bearish with a score of 32.7 percent. The commercials are Bullish with a score of 61.3 percent and the small traders (not shown in chart) are Bullish-Extreme with a score of 84.2 percent.

Price Trend-Following Model: Strong Uptrend

Our weekly trend-following model classifies the current market price position as: Strong Uptrend.

WTI Crude Oil Futures StatisticsSPECULATORSCOMMERCIALSSMALL TRADERS
– Percent of Open Interest Longs:15.441.03.9
– Percent of Open Interest Shorts:8.649.72.0
– Net Position:141,343-181,62940,286
– Gross Longs:321,645855,37881,123
– Gross Shorts:180,3021,037,00740,837
– Long to Short Ratio:1.8 to 10.8 to 12.0 to 1
NET POSITION TREND:
– Strength Index Score (3 Year Range Pct):32.761.384.2
– Strength Index Reading (3 Year Range):BearishBullishBullish-Extreme
NET POSITION MOVEMENT INDEX:
– 6-Week Change in Strength Index:27.1-33.955.5


Brent Crude Oil Futures:

Brent Last Day Crude Oil Futures COT ChartThe Brent Crude Oil Futures large speculator standing this week reached a net position of -36,267 contracts in the data reported through Tuesday. This was a weekly decrease of -185 contracts from the previous week which had a total of -36,082 net contracts.

This week’s current strength score (the trader positioning range over the past three years, measured from 0 to 100) shows the speculators are currently Bearish with a score of 29.4 percent. The commercials are Bullish with a score of 73.8 percent and the small traders (not shown in chart) are Bearish with a score of 41.9 percent.

Price Trend-Following Model: Strong Uptrend

Our weekly trend-following model classifies the current market price position as: Strong Uptrend.

Brent Crude Oil Futures StatisticsSPECULATORSCOMMERCIALSSMALL TRADERS
– Percent of Open Interest Longs:21.641.82.5
– Percent of Open Interest Shorts:34.928.72.3
– Net Position:-36,26735,690577
– Gross Longs:59,005113,9926,755
– Gross Shorts:95,27278,3026,178
– Long to Short Ratio:0.6 to 11.5 to 11.1 to 1
NET POSITION TREND:
– Strength Index Score (3 Year Range Pct):29.473.841.9
– Strength Index Reading (3 Year Range):BearishBullishBearish
NET POSITION MOVEMENT INDEX:
– 6-Week Change in Strength Index:-12.015.9-22.6


Natural Gas Futures:

Natural Gas Futures COT ChartThe Natural Gas Futures large speculator standing this week reached a net position of -185,812 contracts in the data reported through Tuesday. This was a weekly reduction of -13,947 contracts from the previous week which had a total of -171,865 net contracts.

This week’s current strength score (the trader positioning range over the past three years, measured from 0 to 100) shows the speculators are currently Bearish-Extreme with a score of 5.4 percent. The commercials are Bullish-Extreme with a score of 95.1 percent and the small traders (not shown in chart) are Bearish with a score of 30.9 percent.

Price Trend-Following Model: Strong Downtrend

Our weekly trend-following model classifies the current market price position as: Strong Downtrend.

Natural Gas Futures StatisticsSPECULATORSCOMMERCIALSSMALL TRADERS
– Percent of Open Interest Longs:12.838.23.3
– Percent of Open Interest Shorts:24.327.32.6
– Net Position:-185,812174,79811,014
– Gross Longs:205,853615,91053,277
– Gross Shorts:391,665441,11242,263
– Long to Short Ratio:0.5 to 11.4 to 11.3 to 1
NET POSITION TREND:
– Strength Index Score (3 Year Range Pct):5.495.130.9
– Strength Index Reading (3 Year Range):Bearish-ExtremeBullish-ExtremeBearish
NET POSITION MOVEMENT INDEX:
– 6-Week Change in Strength Index:-14.214.1-1.6


Gasoline Blendstock Futures:

RBOB Gasoline Energy Futures COT ChartThe Gasoline Blendstock Futures large speculator standing this week reached a net position of 88,742 contracts in the data reported through Tuesday. This was a weekly decline of -1,214 contracts from the previous week which had a total of 89,956 net contracts.

This week’s current strength score (the trader positioning range over the past three years, measured from 0 to 100) shows the speculators are currently Bullish-Extreme with a score of 85.1 percent. The commercials are Bearish-Extreme with a score of 9.8 percent and the small traders (not shown in chart) are Bullish-Extreme with a score of 97.4 percent.

Price Trend-Following Model: Strong Uptrend

Our weekly trend-following model classifies the current market price position as: Strong Uptrend.

Nasdaq Mini Futures StatisticsSPECULATORSCOMMERCIALSSMALL TRADERS
– Percent of Open Interest Longs:25.246.26.1
– Percent of Open Interest Shorts:6.168.23.2
– Net Position:88,742-101,98413,242
– Gross Longs:117,261214,86528,300
– Gross Shorts:28,519316,84915,058
– Long to Short Ratio:4.1 to 10.7 to 11.9 to 1
NET POSITION TREND:
– Strength Index Score (3 Year Range Pct):85.19.897.4
– Strength Index Reading (3 Year Range):Bullish-ExtremeBearish-ExtremeBullish-Extreme
NET POSITION MOVEMENT INDEX:
– 6-Week Change in Strength Index:20.7-27.750.6


#2 Heating Oil NY-Harbor Futures:

NY Harbor Heating Oil Energy Futures COT ChartThe #2 Heating Oil NY-Harbor Futures large speculator standing this week reached a net position of 15,402 contracts in the data reported through Tuesday. This was a weekly fall of -4,050 contracts from the previous week which had a total of 19,452 net contracts.

This week’s current strength score (the trader positioning range over the past three years, measured from 0 to 100) shows the speculators are currently Bullish with a score of 63.7 percent. The commercials are Bearish with a score of 32.6 percent and the small traders (not shown in chart) are Bullish with a score of 73.4 percent.

Price Trend-Following Model: Strong Uptrend

Our weekly trend-following model classifies the current market price position as: Strong Uptrend.

Heating Oil Futures StatisticsSPECULATORSCOMMERCIALSSMALL TRADERS
– Percent of Open Interest Longs:16.748.612.9
– Percent of Open Interest Shorts:12.658.07.5
– Net Position:15,402-35,61520,213
– Gross Longs:63,052183,34348,508
– Gross Shorts:47,650218,95828,295
– Long to Short Ratio:1.3 to 10.8 to 11.7 to 1
NET POSITION TREND:
– Strength Index Score (3 Year Range Pct):63.732.673.4
– Strength Index Reading (3 Year Range):BullishBearishBullish
NET POSITION MOVEMENT INDEX:
– 6-Week Change in Strength Index:-4.6-7.631.3


Bloomberg Commodity Index Futures:

Bloomberg Commodity Index Futures COT ChartThe Bloomberg Commodity Index Futures large speculator standing this week reached a net position of -10,939 contracts in the data reported through Tuesday. This was a weekly advance of 80 contracts from the previous week which had a total of -11,019 net contracts.

This week’s current strength score (the trader positioning range over the past three years, measured from 0 to 100) shows the speculators are currently Bullish with a score of 55.4 percent. The commercials are Bearish with a score of 42.9 percent and the small traders (not shown in chart) are Bullish with a score of 53.3 percent.

Price Trend-Following Model: Strong Uptrend

Our weekly trend-following model classifies the current market price position as: Strong Uptrend.

Bloomberg Index Futures StatisticsSPECULATORSCOMMERCIALSSMALL TRADERS
– Percent of Open Interest Longs:27.869.30.4
– Percent of Open Interest Shorts:33.464.20.0
– Net Position:-10,93910,174765
– Gross Longs:54,901136,855790
– Gross Shorts:65,840126,68125
– Long to Short Ratio:0.8 to 11.1 to 131.6 to 1
NET POSITION TREND:
– Strength Index Score (3 Year Range Pct):55.442.953.3
– Strength Index Reading (3 Year Range):BullishBearishBullish
NET POSITION MOVEMENT INDEX:
– 6-Week Change in Strength Index:13.4-19.153.3


Article By InvestMacroReceive our weekly COT Newsletter

*COT Report: The COT data, released weekly to the public each Friday, is updated through the most recent Tuesday (data is 3 days old) and shows a quick view of how large speculators or non-commercials (for-profit traders) were positioned in the futures markets.

The CFTC categorizes trader positions according to commercial hedgers (traders who use futures contracts for hedging as part of the business), non-commercials (large traders who speculate to realize trading profits) and nonreportable traders (usually small traders/speculators) as well as their open interest (contracts open in the market at time of reporting). See CFTC criteria here.

COT Energy Charts: Weekly Speculator Bets led by WTI Crude & Brent Oil

By InvestMacro

Speculators OI Energy Futures COT Chart
Here are the latest charts and statistics for the Commitment of Traders (COT) data published by the Commodities Futures Trading Commission (CFTC).

The latest COT data is updated through Tuesday February 3rd and shows a quick view of how large traders (for-profit speculators and commercial entities) were positioned in the futures markets.

Weekly Speculator Changes led by WTI Crude & Brent Oil

Speculators Nets Energy Futures COT Chart
The COT energy market speculator bets were mixed this week as three out of the six energy markets we cover had higher positioning while the other three markets had lower speculator contracts.

Leading the gains for the energy markets was WTI Crude (27,583 contracts) with Brent Oil (7,638 contracts) and Heating Oil (1,444 contracts) also having a positive week.

The markets with declines in speculator bets for the week were Natural Gas (-8,704 contracts), Gasoline (-2,782 contracts) and with the Bloomberg Index (-1,171 contracts) also seeing lower bets on the week.

The Energy Markets Prices were mostly lower on the week.

Gasoline was the only energy market that rose over the past five days with a small 0.09% uptick.

On the downside, Brent Oil fell by -2.82%, followed by WTI Crude Oil which fell by -3.18% and the Bloomberg Commodity Index which dipped by -3.28%. Heating oil saw a shortfall of -5.05% while Natural Gas saw a sharpest decline at -21.48%.

Over the past 30 days, all the energy markets have seen higher levels with Heating Oil up by 12.8% followed by Brent Oil which is higher by 11.2% in that time-frame. Also, over the past 90 days, all the energy markets have seen higher levels with the Bloomberg Commodity Index showing the largest gain of 15.69%.


Energy Data:

Speculators Table Energy Futures COT Chart
Legend: Weekly Speculators Change | Speculators Current Net Position | Speculators Strength Score compared to last 3-Years (0-100 range)


Strength Scores led by Heating Oil & Bloomberg Index

Speculators Strength Energy Futures COT Chart
COT Strength Scores (a normalized measure of Speculator positions over a 3-Year range, from 0 to 100 where above 80 is Extreme-Bullish and below 20 is Extreme-Bearish) showed that Heating Oil (76.8 percent) and the Bloomberg Index (72.8 percent) lead the energy markets this week.

On the downside, Natural Gas (14.8 percent) comes in at the lowest strength level currently and is in Extreme-Bearish territory (below 20 percent). The next lowest strength score was the WTI Crude (27.3 percent).

Strength Statistics:
WTI Crude Oil (27.3 percent) vs WTI Crude Oil previous week (18.4 percent)
Brent Crude Oil (32.5 percent) vs Brent Crude Oil previous week (21.6 percent)
Natural Gas (14.8 percent) vs Natural Gas previous week (20.9 percent)
Gasoline (71.5 percent) vs Gasoline previous week (74.6 percent)
Heating Oil (76.8 percent) vs Heating Oil previous week (74.9 percent)
Bloomberg Commodity Index (72.8 percent) vs Bloomberg Commodity Index previous week (78.3 percent)


Bloomberg Index & WTI Crude top the 6-Week Strength Trends

Speculators Trend Energy Futures COT Chart
COT Strength Score Trends (or move index, calculates the 6-week changes in strength scores) showed that the Bloomberg Index (45.2 percent) and WTI Crude (19.2 percent) lead the past six weeks trends for the energy markets.

Natural Gas (-11.2 percent) leads the downside trend scores currently with Brent Oil (-5.4 percent) as the next market with lower trend scores.

Move Statistics:
WTI Crude Oil (19.2 percent) vs WTI Crude Oil previous week (13.6 percent)
Brent Crude Oil (-5.4 percent) vs Brent Crude Oil previous week (-14.9 percent)
Natural Gas (-11.2 percent) vs Natural Gas previous week (-24.9 percent)
Gasoline (6.2 percent) vs Gasoline previous week (3.1 percent)
Heating Oil (15.8 percent) vs Heating Oil previous week (11.2 percent)
Bloomberg Commodity Index (45.2 percent) vs Bloomberg Commodity Index previous week (72.1 percent)


Individual COT Market Charts:

WTI Crude Oil Futures:

WTI Crude Oil Futures COT ChartThe WTI Crude Oil Futures large speculator standing this week resulted in a net position of 124,565 contracts in the data reported through Tuesday. This was a weekly increase of 27,583 contracts from the previous week which had a total of 96,982 net contracts.

This week’s current strength score (the trader positioning range over the past three years, measured from 0 to 100) shows the speculators are currently Bearish with a score of 27.3 percent. The commercials are Bullish with a score of 70.2 percent and the small traders (not shown in chart) are Bullish with a score of 58.7 percent.

Price Trend-Following Model: Strong Uptrend

Our weekly trend-following model classifies the current market price position as: Strong Uptrend.

WTI Crude Oil Futures StatisticsSPECULATORSCOMMERCIALSSMALL TRADERS
– Percent of Open Interest Longs:15.142.13.4
– Percent of Open Interest Shorts:9.149.42.0
– Net Position:124,565-152,49927,934
– Gross Longs:315,529879,93270,726
– Gross Shorts:190,9641,032,43142,792
– Long to Short Ratio:1.7 to 10.9 to 11.7 to 1
NET POSITION TREND:
– Strength Index Score (3 Year Range Pct):27.370.258.7
– Strength Index Reading (3 Year Range):BearishBullishBullish
NET POSITION MOVEMENT INDEX:
– 6-Week Change in Strength Index:19.2-25.850.9


Brent Crude Oil Futures:

Brent Last Day Crude Oil Futures COT ChartThe Brent Crude Oil Futures large speculator standing this week resulted in a net position of -34,110 contracts in the data reported through Tuesday. This was a weekly boost of 7,638 contracts from the previous week which had a total of -41,748 net contracts.

This week’s current strength score (the trader positioning range over the past three years, measured from 0 to 100) shows the speculators are currently Bearish with a score of 32.5 percent. The commercials are Bullish with a score of 70.4 percent and the small traders (not shown in chart) are Bearish with a score of 42.8 percent.

Price Trend-Following Model: Strong Uptrend

Our weekly trend-following model classifies the current market price position as: Strong Uptrend.

Brent Crude Oil Futures StatisticsSPECULATORSCOMMERCIALSSMALL TRADERS
– Percent of Open Interest Longs:24.137.72.3
– Percent of Open Interest Shorts:38.323.82.0
– Net Position:-34,11033,458652
– Gross Longs:57,80490,4565,467
– Gross Shorts:91,91456,9984,815
– Long to Short Ratio:0.6 to 11.6 to 11.1 to 1
NET POSITION TREND:
– Strength Index Score (3 Year Range Pct):32.570.442.8
– Strength Index Reading (3 Year Range):BearishBullishBearish
NET POSITION MOVEMENT INDEX:
– 6-Week Change in Strength Index:-5.48.7-22.1


Natural Gas Futures:

Natural Gas Futures COT ChartThe Natural Gas Futures large speculator standing this week resulted in a net position of -172,310 contracts in the data reported through Tuesday. This was a weekly lowering of -8,704 contracts from the previous week which had a total of -163,606 net contracts.

This week’s current strength score (the trader positioning range over the past three years, measured from 0 to 100) shows the speculators are currently Bearish-Extreme with a score of 14.8 percent. The commercials are Bullish-Extreme with a score of 87.5 percent and the small traders (not shown in chart) are Bearish with a score of 25.5 percent.

Price Trend-Following Model: Uptrend

Our weekly trend-following model classifies the current market price position as: Uptrend.

Natural Gas Futures StatisticsSPECULATORSCOMMERCIALSSMALL TRADERS
– Percent of Open Interest Longs:13.037.52.9
– Percent of Open Interest Shorts:23.427.62.4
– Net Position:-172,310163,4568,854
– Gross Longs:215,099620,51348,080
– Gross Shorts:387,409457,05739,226
– Long to Short Ratio:0.6 to 11.4 to 11.2 to 1
NET POSITION TREND:
– Strength Index Score (3 Year Range Pct):14.887.525.5
– Strength Index Reading (3 Year Range):Bearish-ExtremeBullish-ExtremeBearish
NET POSITION MOVEMENT INDEX:
– 6-Week Change in Strength Index:-11.210.70.3


Gasoline Blendstock Futures:

RBOB Gasoline Energy Futures COT ChartThe Gasoline Blendstock Futures large speculator standing this week resulted in a net position of 76,431 contracts in the data reported through Tuesday. This was a weekly decline of -2,782 contracts from the previous week which had a total of 79,213 net contracts.

This week’s current strength score (the trader positioning range over the past three years, measured from 0 to 100) shows the speculators are currently Bullish with a score of 71.5 percent. The commercials are Bearish with a score of 23.0 percent and the small traders (not shown in chart) are Bullish-Extreme with a score of 93.2 percent.

Price Trend-Following Model: Strong Uptrend

Our weekly trend-following model classifies the current market price position as: Strong Uptrend.

Nasdaq Mini Futures StatisticsSPECULATORSCOMMERCIALSSMALL TRADERS
– Percent of Open Interest Longs:24.846.25.9
– Percent of Open Interest Shorts:8.565.13.2
– Net Position:76,431-88,85712,426
– Gross Longs:116,257216,55327,515
– Gross Shorts:39,826305,41015,089
– Long to Short Ratio:2.9 to 10.7 to 11.8 to 1
NET POSITION TREND:
– Strength Index Score (3 Year Range Pct):71.523.093.2
– Strength Index Reading (3 Year Range):BullishBearishBullish-Extreme
NET POSITION MOVEMENT INDEX:
– 6-Week Change in Strength Index:6.2-12.539.4


#2 Heating Oil NY-Harbor Futures:

NY Harbor Heating Oil Energy Futures COT ChartThe #2 Heating Oil NY-Harbor Futures large speculator standing this week resulted in a net position of 25,279 contracts in the data reported through Tuesday. This was a weekly boost of 1,444 contracts from the previous week which had a total of 23,835 net contracts.

This week’s current strength score (the trader positioning range over the past three years, measured from 0 to 100) shows the speculators are currently Bullish with a score of 76.8 percent. The commercials are Bearish with a score of 24.6 percent and the small traders (not shown in chart) are Bullish with a score of 69.4 percent.

Price Trend-Following Model: Strong Uptrend

Our weekly trend-following model classifies the current market price position as: Strong Uptrend.

Heating Oil Futures StatisticsSPECULATORSCOMMERCIALSSMALL TRADERS
– Percent of Open Interest Longs:17.146.512.9
– Percent of Open Interest Shorts:10.258.67.8
– Net Position:25,279-44,05118,772
– Gross Longs:62,759170,82947,433
– Gross Shorts:37,480214,88028,661
– Long to Short Ratio:1.7 to 10.8 to 11.7 to 1
NET POSITION TREND:
– Strength Index Score (3 Year Range Pct):76.824.669.4
– Strength Index Reading (3 Year Range):BullishBearishBullish
NET POSITION MOVEMENT INDEX:
– 6-Week Change in Strength Index:15.8-13.14.9


Bloomberg Commodity Index Futures:

Bloomberg Commodity Index Futures COT ChartThe Bloomberg Commodity Index Futures large speculator standing this week resulted in a net position of -7,246 contracts in the data reported through Tuesday. This was a weekly reduction of -1,171 contracts from the previous week which had a total of -6,075 net contracts.

This week’s current strength score (the trader positioning range over the past three years, measured from 0 to 100) shows the speculators are currently Bullish with a score of 72.8 percent. The commercials are Bearish with a score of 25.5 percent and the small traders (not shown in chart) are Bullish with a score of 50.7 percent.

Price Trend-Following Model: Strong Uptrend

Our weekly trend-following model classifies the current market price position as: Strong Uptrend.

Bloomberg Index Futures StatisticsSPECULATORSCOMMERCIALSSMALL TRADERS
– Percent of Open Interest Longs:24.472.60.4
– Percent of Open Interest Shorts:28.369.10.0
– Net Position:-7,2466,537709
– Gross Longs:44,675133,218732
– Gross Shorts:51,921126,68123
– Long to Short Ratio:0.9 to 11.1 to 131.8 to 1
NET POSITION TREND:
– Strength Index Score (3 Year Range Pct):72.825.550.7
– Strength Index Reading (3 Year Range):BullishBearishBullish
NET POSITION MOVEMENT INDEX:
– 6-Week Change in Strength Index:45.2-46.34.5


Article By InvestMacroReceive our weekly COT Newsletter

*COT Report: The COT data, released weekly to the public each Friday, is updated through the most recent Tuesday (data is 3 days old) and shows a quick view of how large speculators or non-commercials (for-profit traders) were positioned in the futures markets.

The CFTC categorizes trader positions according to commercial hedgers (traders who use futures contracts for hedging as part of the business), non-commercials (large traders who speculate to realize trading profits) and nonreportable traders (usually small traders/speculators) as well as their open interest (contracts open in the market at time of reporting). See CFTC criteria here.