
By RoboForex Analytical Department
Brent crude oil prices have continued to slip, touching 71.74 USD a barrel on Tuesday. This marks a downturn influenced by China’s underwhelming stimulus measures. The market’s lack of confidence in China’s rejuvenation efforts, coupled with persistently weak inflation and subdued energy demand within the country, has led to this downturn.
Compounding the downward pressure on oil prices, the US dollar’s strength makes commodity investments less attractive, as a robust USD typically dampens demand for dollar-priced assets like oil. However, the geopolitical landscape, which often serves as a driver for oil price volatility, appears stable for now. With reduced tensions in the Middle East, some risk premiums previously embedded in Brent prices have been alleviated.
Investors eagerly anticipate the monthly OPEC report expected later today, which is set to provide deeper insights into the supply-demand dynamics. This report has the potential to influence market sentiments significantly and is a key focus for investors as they consider global oil demand forecasts for 2025.
Brent technical analysis
Free Reports:
 Get our Weekly Commitment of Traders Reports - See where the biggest traders (Hedge Funds and Commercial Hedgers) are positioned in the futures markets on a weekly basis.
 Download Our Metatrader 4 Indicators – Put Our Free MetaTrader 4 Custom Indicators on your charts when you join our Weekly Newsletter
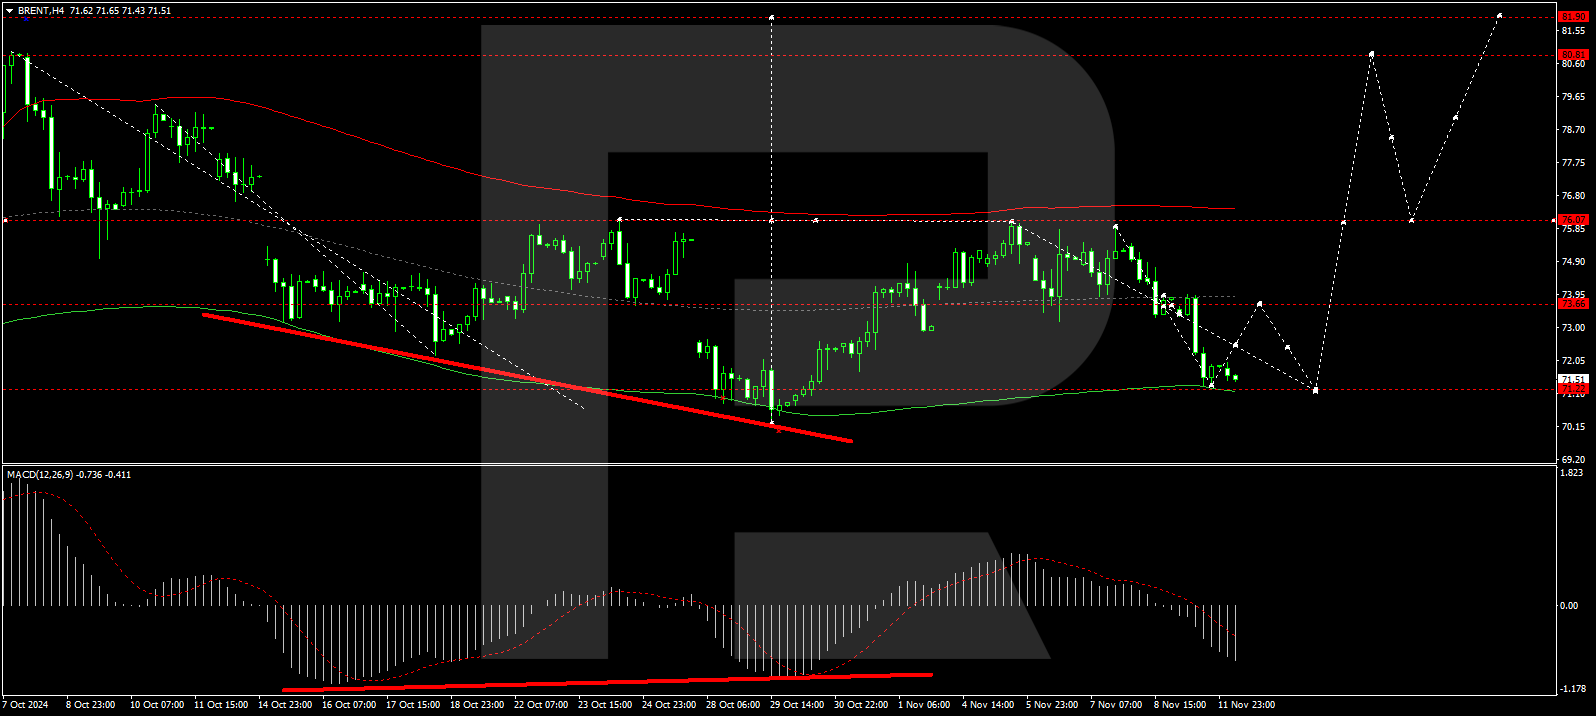
On the H4 chart of Brent, the market continues to develop a broad consolidation range around the level of 73.66, extending to the level of 71.33. Today, we expect a growth link to the level of 73.66. After reaching this level, developing another downside structure to 71.22 is possible. Further, we will consider the probability of the beginning of the growth wave development to 76.00, with the prospect of the trend’s continuation to 80.80, the local target. Technically, this scenario is confirmed by the MACD indicator. Its signal line is under the zero level and is directed downwards.
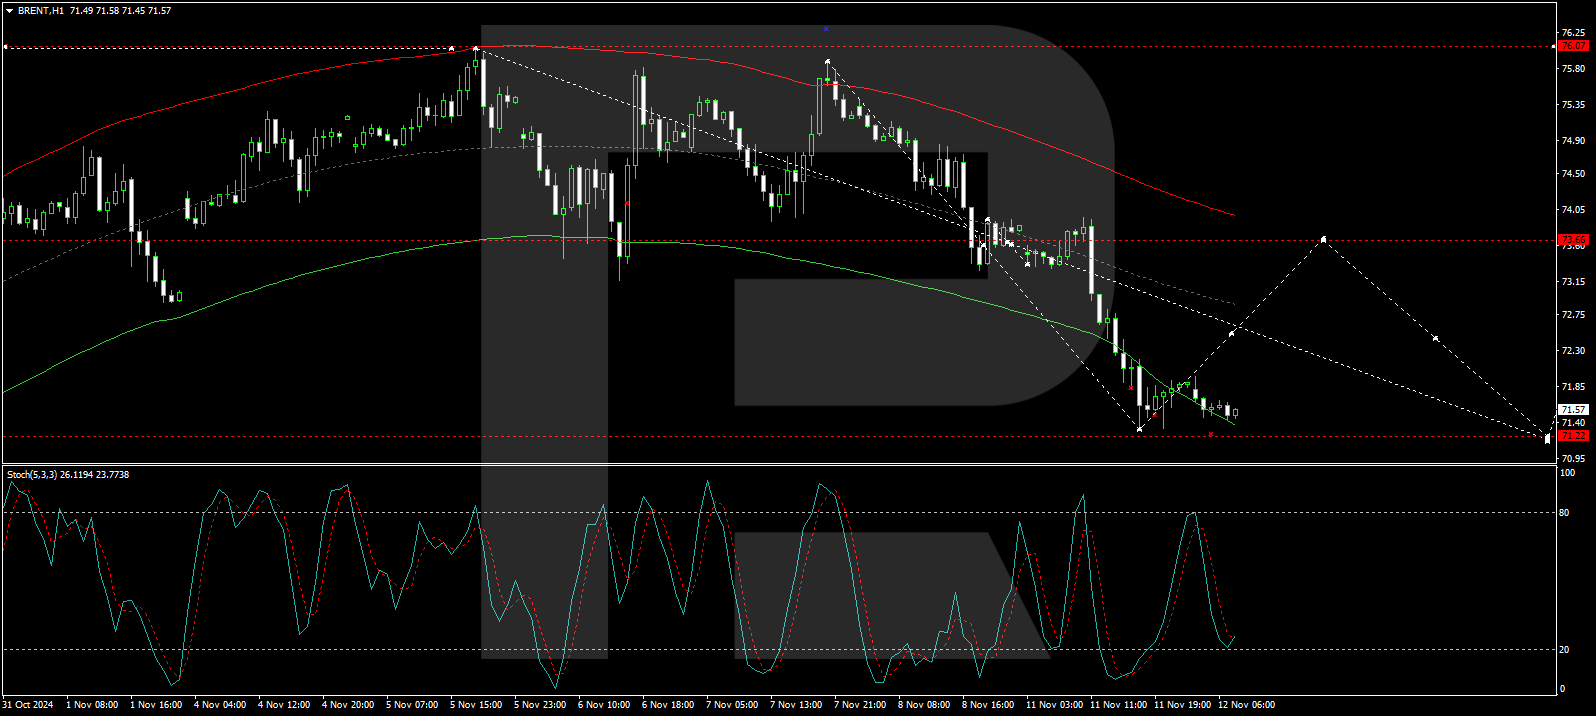
On the H1 Brent chart, the market has formed a consolidation range around 73.66 and worked out a downward wave to 71.33, the local target. Today, a correction link for this downward wave is likely with a target at 73.66, followed by another wave of decline to 71.22. At this point, the potential of the downward wave can be considered exhausted. Technically, this scenario is confirmed by the Stochastic oscillator. Its signal line is under 50 and is directed strictly downwards to 20.
Disclaimer
Any forecasts contained herein are based on the author’s particular opinion. This analysis may not be treated as trading advice. RoboForex bears no responsibility for trading results based on trading recommendations and reviews contained herein.

- COT Metals Charts: Weekly Speculator Bets see small gains for Silver & Gold Jul 12, 2026
- COT Bonds Charts: Speculator Bets led by SOFR 3-Months & 2-Year Bonds Jul 12, 2026
- COT Energy Charts: Weekly Speculator Changes led by Brent Oil Jul 12, 2026
- COT Soft Commodities Charts: Weekly Speculator Changes led by Sugar, Corn & Soybeans Jul 12, 2026
- The US and European stock indices are rising again amid renewed investor interest in the AI industry. Jul 10, 2026
- USD/JPY Falls as Yen Recovers Weekly Losses Jul 10, 2026
- Crude oil prices surged sharply by 7% in reaction to the rapid escalation of the conflict in the Middle East Jul 9, 2026
- Middle East Tensions Weigh on Gold Jul 9, 2026
- Pound Awaits Tighter Policy from Bank of England Jul 8, 2026
- The United States carried out airstrikes on Iran after Iran’s attacked tankers in the Strait of Hormuz. The RBNZ raised the interest rate to 2.5% Jul 8, 2026