When I was a child, one of the first school lessons in rote memory training was to memorize two songs and a prayer. Given that Upper Canada (specifically Ontario) was an Anglo-Saxon society, elementary school children were made to learn “The Lord’s Prayer”, “O Canada”, and “God Save the Queen”.
On the front wall of every classroom, usually just above the clock and public address speaker was a portrait of Queen Elizabeth II, and shortly after the bell sounded calling all of us to class, you would hear this lilting refrain:
“God Save our Gracious Queen
Long live our noble Queen
God save the Queen
Send her Victorious
Happy and Glorious
Long to Reign over us,
God Save the Queen.”
As a former British colony, whenever the Queen and Prince Philip visited Canada, there would be huge crowds lining both sides of Airport Road in northwest Toronto as their limousine swept them away into the heart of the downtown where several floors of the mighty King Edward Hotel would be reserved for their entourage of manservants.
What always puzzled me was how Canadians could be so mesmerized by people from a nation 3,500 miles away whose sole task was to maintain the traditional as opposed to functional role as leaders of the British Empire. Sure, Canada was (and is) a member of the British Commonwealth and is beholden to the Crown, but as of July 1, 1867, and the passage of the British North America Act, all legislation pertaining to Canadian law passed into the hands of Canadians. 157 years later, Canadian politicians still faun and faint over the presence of “The Royals,” and it absolutely baffles me.
On Wall Street, investment bankers are also lectured in the art of rote memory, but this time, it is not the smiling face of a monarch that adorns the walls of the boardrooms right next to the public address speakers and the song they all stand and sing goes something like this:
“God save our gracious Fed
Long live our noble Fed,
God save the Fed.
Send them victorious
Happy and Glorious
Long to reign over us,
God Save the Fed.”
Like Canadians in the presence of the monarchy, Wall Street looks upon the members of the U.S. Federal Reserve as an “American Monarchy.” They lay out red carpets and fill speaking halls whenever one of these economic geeks opens their mouth. The news cycle is one massive competition between the White House and 2051 Constitution St., Washington, D.C., otherwise known as the Eccles Building, and also the home of the U.S. Federal Reserve.
The major difference between the primary inhabitants of the White House and those of the Eccles Building is that one is elected while the other is appointed. One is the titular head of the executive arm of the U.S. government, while the other has an appointed Chairman whose job has nothing to do with government. We keep hearing about their dual mandates of “price stability” and “maximum full employment,” but in the end, their real job is to maintain the integrity of the global financial system, which is kept in check through the use of the world reserve currency, the U.S. dollar. This entails always keeping the U.S. government from running out of money while always protecting the member banks that own the Fed.
This past week, Jerome Powell introduced a new word to the fray — “recalibrate” — as in “recalibrating a rifle scope,” where minor adjustments are made to an operation or machinery designed to either improve performance or better fit an altered policy. For example, Ronald Reagan was forced to “recalibrate” the way they were treating the Sandinistas in Nicaragua in the 1980s by replacing “covert ops” with “blatant force” through the creation of the “Contras,” an army of counter-revolutionary, ex-National Guard troops assembled with money and advisors from the U.S.
Here in 2024, Fed Chairman Jerome Powell has now seen a need to “recalibrate” fiscal policy by claiming that the American economy is “fine” but totally contradicting that statement by slashing interest rates by a full half percent (0.50%) despite nearly full employment (4% unemployment rate), growth near 3%, and housing near at or near record highs. His actions resemble those of a man caught in the throes of panic but constantly repeating just how “awesome” everything is, particularly the American equity markets where stocks are at or near record highs as well.
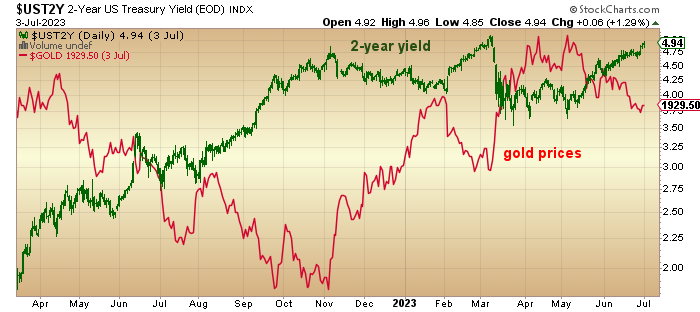
I have read a great deal of distinguished commentary since Wednesday’s Fed move and while the bulls are giddy with delight, those in the cynical camp are smelling something foul in the air. The best performers in the past month have been the defensive stocks like utilities, consumer staples and health care. Bonds did not scream higher; they sold off with yields rising instead of joining the lovefest. The one commodity watched like a Divining Rod is gold which used little subtlety by rocketing to all-time highs. Given that the Fed use gold as a barometer of inflationary expectations, they must be cursing silently for such a brazen act of rejection of the Fed’s description of a “fine” economy.
The last time Fed policy reversed on a dime was in 2008 when Ben Bernanke slashed rates the same amount while calling the sub-prime dilemma “contained.” By the March of 2009, the financial system was in full lockdown as those revered member banks did their utmost to blow up the financial system which in fact they did while stock price slid some 65% from the prior highs. Only a generous Congress had the power of a runaway and out-of-control printing press to conjure up enough fresh cash to save them and save them they did, not only on Wall Street but in every other banking centre across the planet. So, Ben Bernanke said that subprime was “contained,” and Jerome Powell said the U.S. economy was “fine.” I would submit that based on the Fed’s track record, the outcome of 16 years ago will be eerily similar to the outcome of Jerome’s current rosy assessment.
The latest economic data as interpreted by the likes of highly-respected economists like Stephanie Pomboy (MacroMavens) and David Rosenberg (Rosenberg Research) provided ample expectations of a big rate cut as both are looking at the latest employment figures where the U.S. lost over 400,000 full-time jobs but gained over 550,000 of part-time jobs. The ISM reports, and the University of Michigan sentiment surveys have all pointed to a “slowdown,” so the major issue I have while staring at myself in the mirror is whether or not corporate earnings will get a boost from lower funding costs. They certainly did not get pounded by the record pace of rate increases from March 2022 until July 2023 so why should the reverse occur into an easing cycle?
The bulls are now talking about a “new dawn” in fiscal policy that will unlock the small caps from a life in no-growth purgatory as the advance-decline line explodes to new highs as money-market cash on the sidelines to avoid a hostile Fed moves aggressively back into stocks embracing the Fed “recalibration” with open arms (and wallets). I reject that because of my contention that the Fed has seen something that rattled them and last week’s 50 b.p. cut was their getting ahead of the oncoming freight train called “global recession.”
If I am right, then earnings forecasts are going to get slashed and unless stocks correct to adjust for lower earnings, P/E’s are going into the rafters from a level that already resembles the high-diving board for armchair stock technicians. The action in markets was disappointing Wednesday, euphoric on Thursday and again disappointing on Friday. Until November 5, markets are going to look tentatively at the polls and start to reallocate risk the closer we get to that date and with one candidate threatening to increase the capital gains tax and the other threatening to impose massive tariffs, I see an increase in “risk-off” after the euphoria of last Thursday wears off.
The Gold Market
Discussing the gold market is a lot easier than discussing most other markets as it powers higher, dragging the bears into emotional agony and the sidelined bulls off the fence. The committed bulls like me, who have stayed long-term bullish despite some unfortunate forays into near-term hedging endeavours, are more than pleased with gold and now that many of the juniors have started to react to a December gold price at $2,647.10, I have the distinct impression that a new wave of retail participation is beginning and with that, a brand new wave of trading opportunities. With that, I see the financing environment picking up for companies that purposely put their drill rigs into dry-dock until markets started to actually reward them for positive drill results.
Gold is doing exactly what it should; it is responding to changes in the narrative. The anti-gold narrative has been led by the Fed’s adherence to the one mandate that is actually an oxymoron of sorts — price stability. For an entity to execute interest rate increases 11 times between March of 2022 and July of 2023, the Fed’s actions did very little to impact gold prices, which held up remarkably well during that 15-month period. Prices were anything but “stable” during a period that saw inflation rates drop from over 9% to the current 3% but the level of prices remains massively elevated from levels seen a mere five years ago.
Only the rate of price increases has been moderated while the real cost of feeding and housing and educating a family remains incredibly unmanageable for most. How can the Fed take victory laps over a 50-point rate cut when the average young married couple can’t even dream of owning a home?
Gold is a very solemn detector of geopolitical problems and I believe it has been totally ignoring that oh-so “fine” American economy while paying more than cursory attention to China’s economic woes and eastern Europe and Gaza and the biggest elephant in the room — the U.S. national debt monster — that is threatening to derail everything. Gold could care less whether the QQQ’s are up or down or whether the NASDAQ is “off the lows” on any given day. It looks so far beyond the NYSE that only traders with blinders affixed to their sight lines dare utter doubts about gold’s “staying power.”
As for the gold shares, the HUI at 328 is still some 30 points below the post-pandemic high of 357.68, which was reached on August 7, 2020, with gold at $2,070. I think that the HUI is a testament to just how abysmally the gold producers performed in the period 2002-2011 and just how much shareholders’ equity was destroyed. The reputations of the gold producers are still so mired in the memories of 2011 that investors have a very difficult time believing that they have learned the error of their tawdry ways and have rebuilt themselves into very profitable companies with Gibraltar-type balance sheets. The HUI topped at over 600 back in 2011 which was a little over thirteen years ago with gold pressing $1,900 per ounce. That is a lot of catching up to do with gold at $2,647.
The VanEck Gold Miners ETF (GDX:NYSEARCA) topped at over $42 in August 2020 with gold at $2,070 and closed Friday at $40.51. With an RSI at 63.51, it still has room to move higher so with the SPDR Gold Shares ETF (GLD:NYSE) about to move into overbought territory, perhaps the catch-up trade is to buy the seniors looking for a break-out above the 202 high.
As far as the junior explorer/developers are concerned, they are still locked in a low-liquidity nightmare, although the sentiment levels feel improved over this time last year. As represented by the TSX Venture Exchange, it looks as though the current level of 584.91 has only minor resistance levels to overcome before it becomes “clear sailing.”
The July peak at 602 and the May peak at 624 are all that remains before the TSXV achieves “escape velocity” and takes a run at the August 2020 peak above 1,000. Again, to put this into perspective, the TSXV topped in 2007 at 3,341. Just as a dead fish rots from the head first, the dismal action in the senior gold producers relative to gold prices spilled over into the junior explorer/developers leaving them drastically undervalued relative to both gold and the seniors and to equity markets in general, a condition now over thirteen years in the making.
We are long overdue for a trend reversal.
This letter makes no guarantee or warranty on the accuracy or completeness of the data provided. Nothing contained herein is intended or shall be deemed to be investment advice, implied or otherwise. This letter represents my views and replicates trades that I am making but nothing more than that. Always consult your registered advisor to assist you with your investments. I accept no liability for any loss arising from the use of the data contained on this letter. Options and junior mining stocks contain a high level of risk that may result in the loss of part or all invested capital and therefore are suitable for experienced and professional investors and traders only. One should be familiar with the risks involved in junior mining and options trading and we recommend consulting a financial adviser if you feel you do not understand the risks involved.