By InvestMacro

Here are the latest charts and statistics for the Commitment of Traders (COT) reports data published by the Commodities Futures Trading Commission (CFTC).
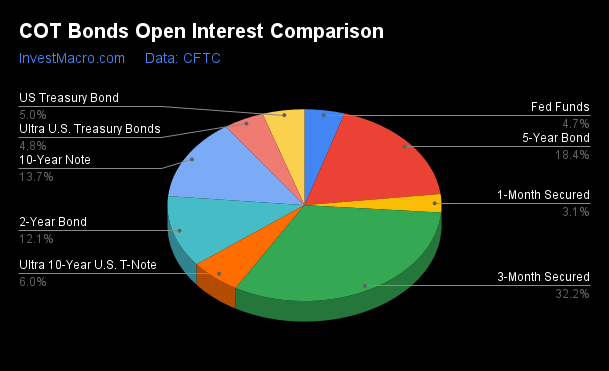
The latest COT data is updated through Tuesday September 24th and shows a quick view of how large traders (for-profit speculators and commercial hedgers) were positioned in the futures markets.
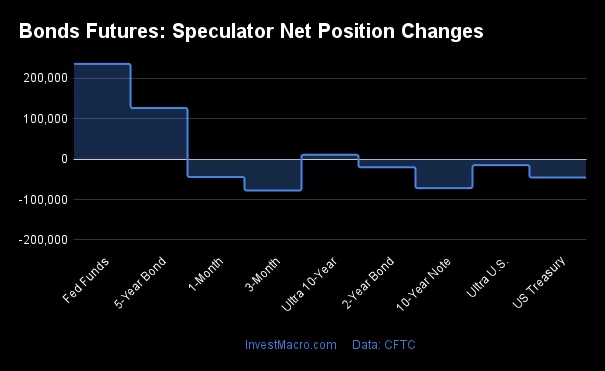
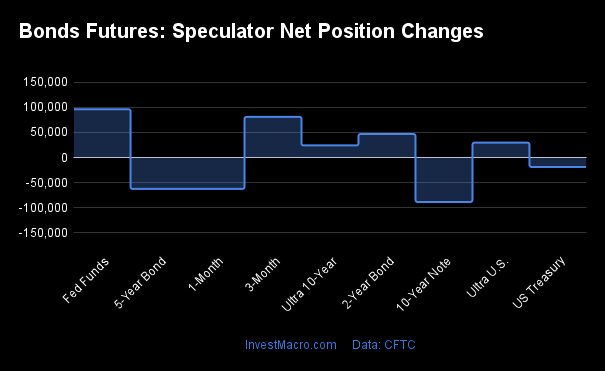
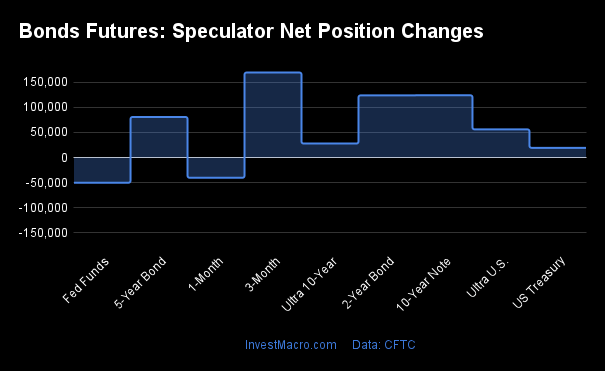
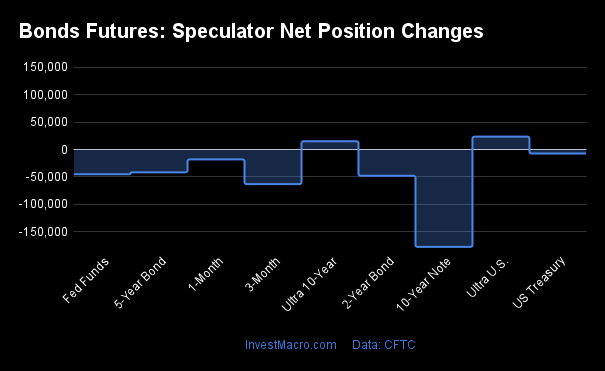
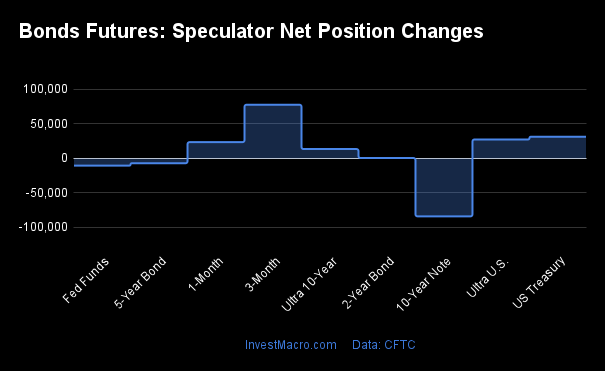
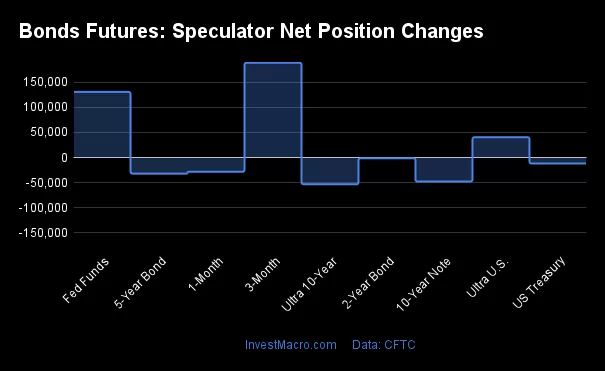
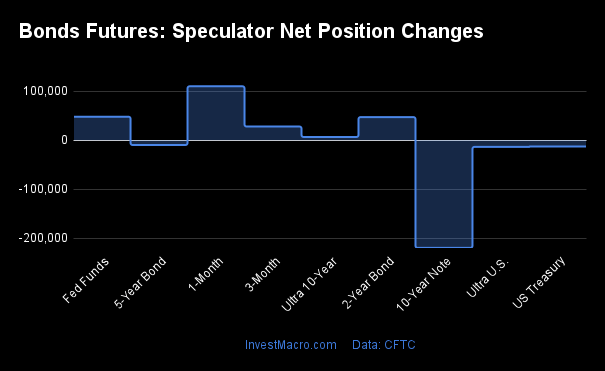
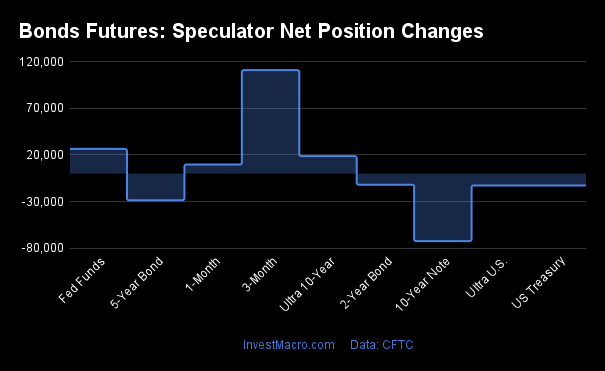
Weekly Speculator Changes led by 10-Year & 5-Year Bonds
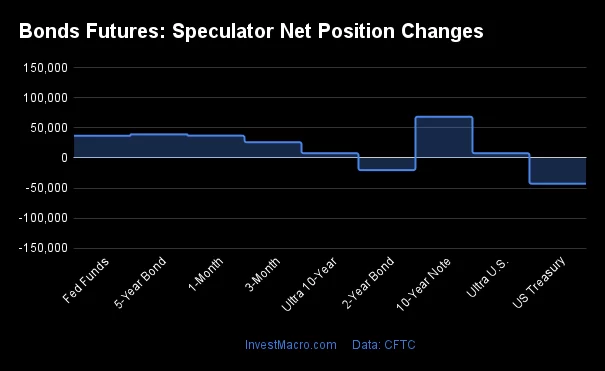
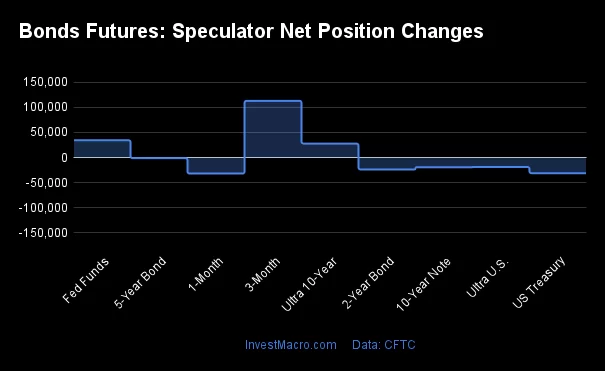
The COT bond market speculator bets were higher this week as seven out of the nine bond markets we cover had higher positioning while the other two markets had lower speculator contracts.
Leading the gains for the bond markets was the 10-Year Bonds (68,748 contracts) with the 5-Year Bonds (39,428 contracts), the SOFR 1-Month (37,194 contracts), the Fed Funds (37,053 contracts), the SOFR 3-Months (26,227 contracts), the Ultra 10-Year Bonds (7,961 contracts) and the Ultra Treasury Bonds (7,924 contracts) also showing positive weeks.
The bond markets with declines in speculator bets for the week were the US Treasury Bonds (-42,871 contracts) and the 2-Year Bonds (-20,140 contracts).
*COT Report: The COT data, released weekly to the public each Friday, is updated through the most recent Tuesday (data is 3 days old) and shows a quick view of how large speculators or non-commercials (for-profit traders) were positioned in the futures markets.
The CFTC categorizes trader positions according to commercial hedgers (traders who use futures contracts for hedging as part of the business), non-commercials (large traders who speculate to realize trading profits) and nonreportable traders (usually small traders/speculators) as well as their open interest (contracts open in the market at time of reporting). See CFTC criteria here.
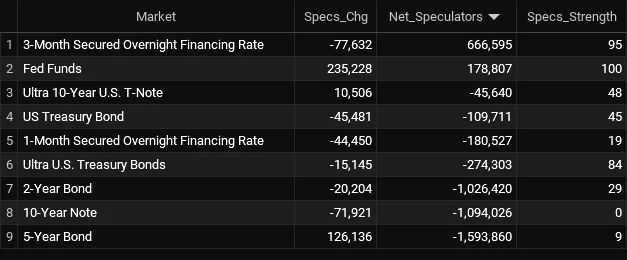
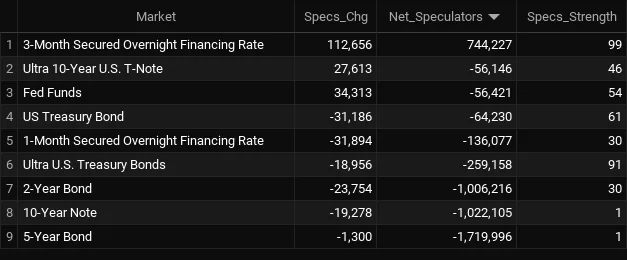
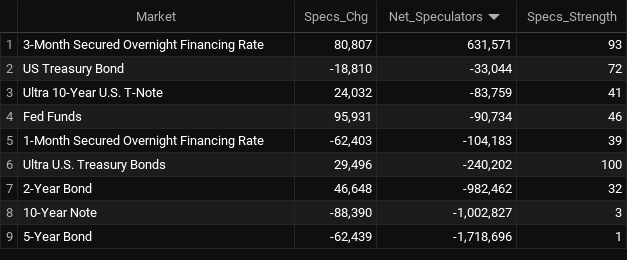
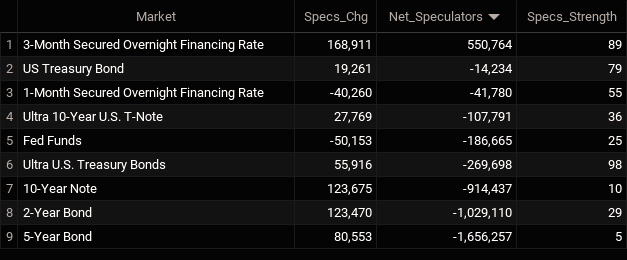
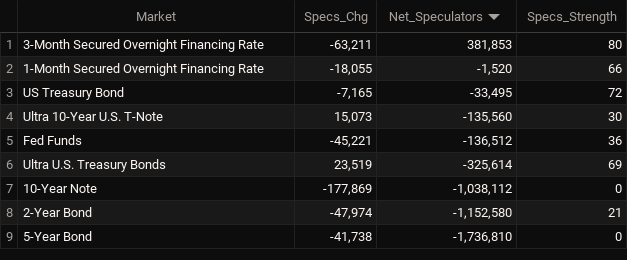
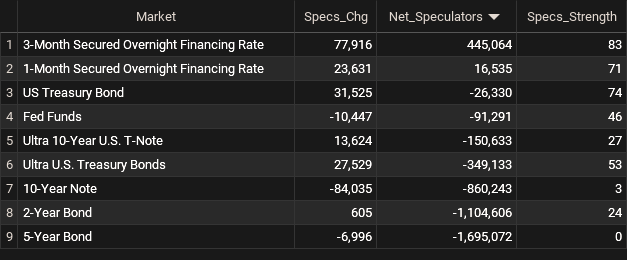
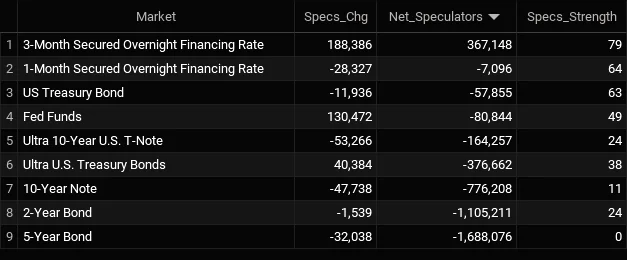
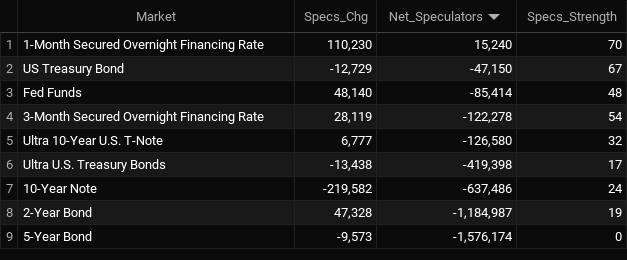
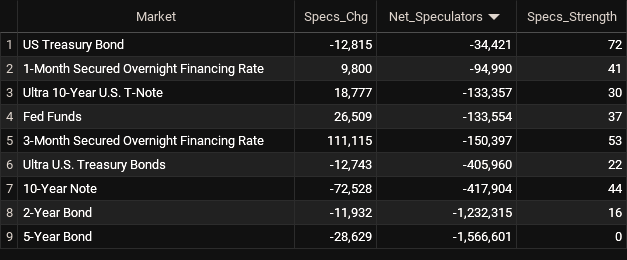
Bonds Net Speculators Leaderboard
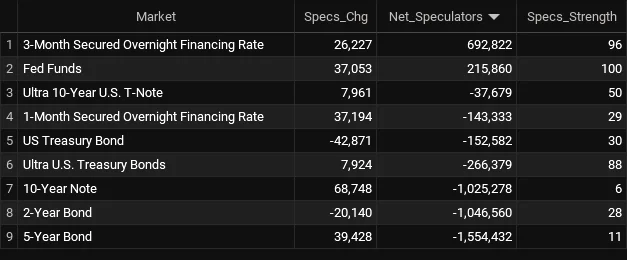
Legend: Weekly Speculators Change | Speculators Current Net Position | Speculators Strength Score compared to last 3-Years (0-100 range)
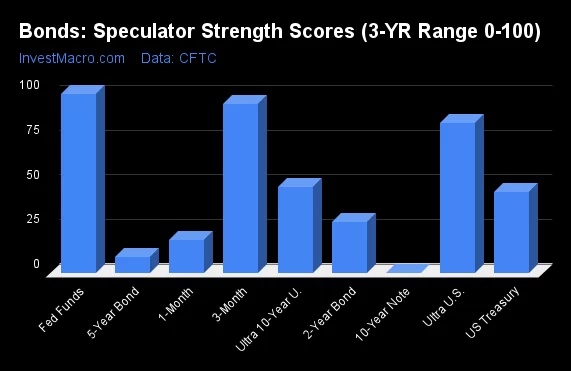
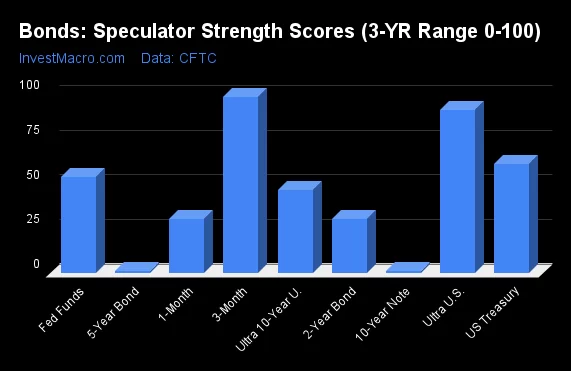
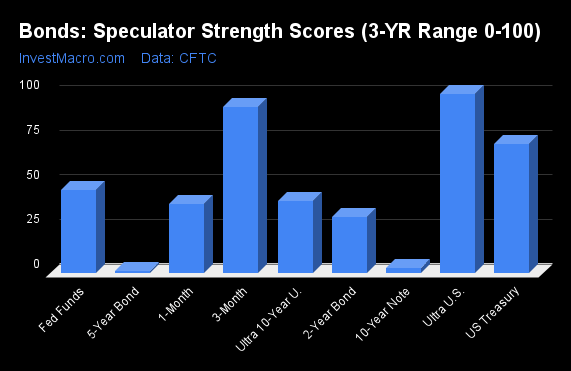
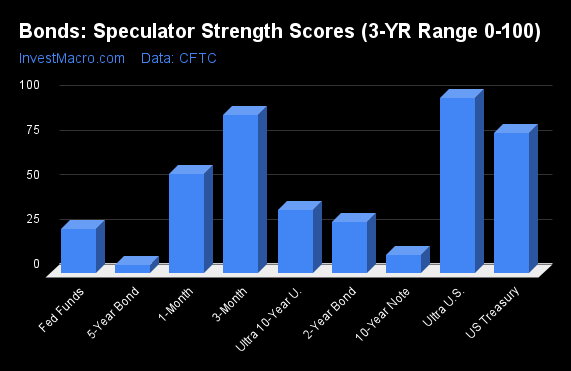
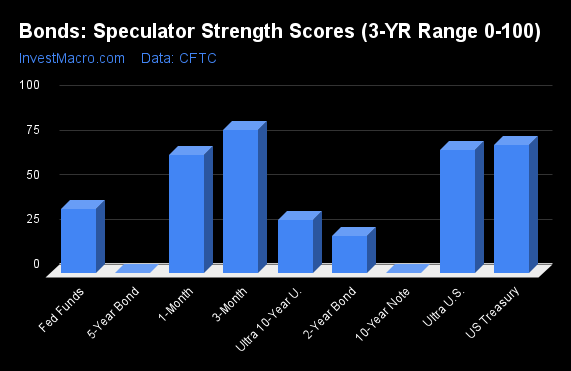
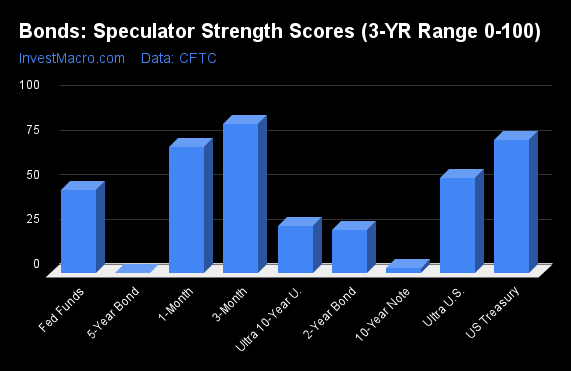
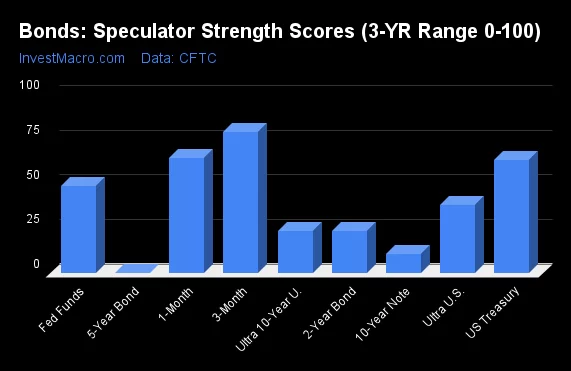
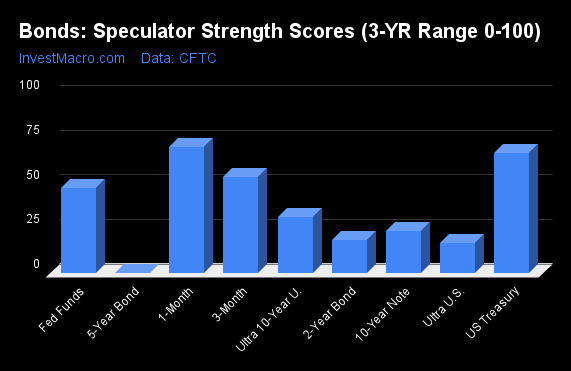
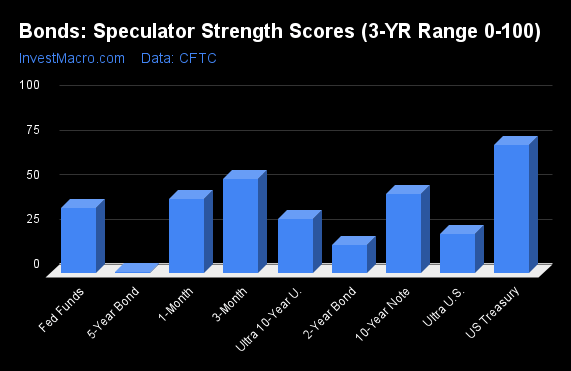
Strength Scores led by Fed Funds & SOFR 3-Months
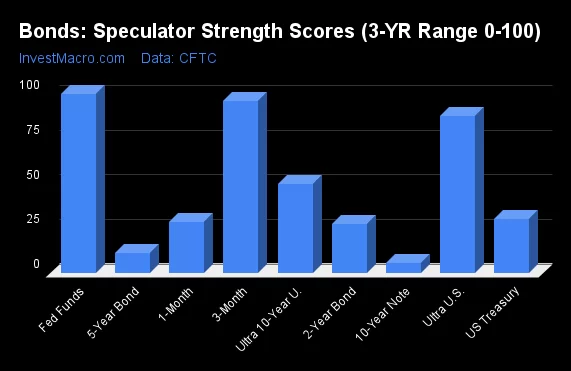
COT Strength Scores (a normalized measure of Speculator positions over a 3-Year range, from 0 to 100 where above 80 is Extreme-Bullish and below 20 is Extreme-Bearish) showed that the Fed Funds (100 percent) and the SOFR 3-Months (96 percent) lead the bond markets this week. The Ultra Treasury Bonds (88 percent) comes in as the next highest in the weekly strength scores.
On the downside, the 10-Year Bond (6 percent) and the 5-Year Bonds (11 percent) come in at the lowest strength level currently and are in Extreme-Bearish territory (below 20 percent). The next lowest strength scores were the 2-Year Bonds (27 percent), the SOFR 1-Month (29 percent) and the US Treasury Bonds (30 percent).
Strength Statistics:
Fed Funds (100.0 percent) vs Fed Funds previous week (92.8 percent)
2-Year Bond (27.5 percent) vs 2-Year Bond previous week (28.7 percent)
5-Year Bond (11.2 percent) vs 5-Year Bond previous week (8.8 percent)
10-Year Bond (5.5 percent) vs 10-Year Bond previous week (0.0 percent)
Ultra 10-Year Bond (50.1 percent) vs Ultra 10-Year Bond previous week (48.4 percent)
US Treasury Bond (30.3 percent) vs US Treasury Bond previous week (45.3 percent)
Ultra US Treasury Bond (87.9 percent) vs Ultra US Treasury Bond previous week (84.2 percent)
SOFR 1-Month (28.5 percent) vs SOFR 1-Month previous week (18.7 percent)
SOFR 3-Months (96.1 percent) vs SOFR 3-Months previous week (94.7 percent)
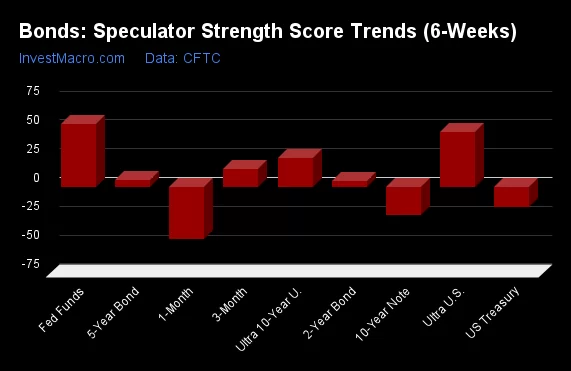
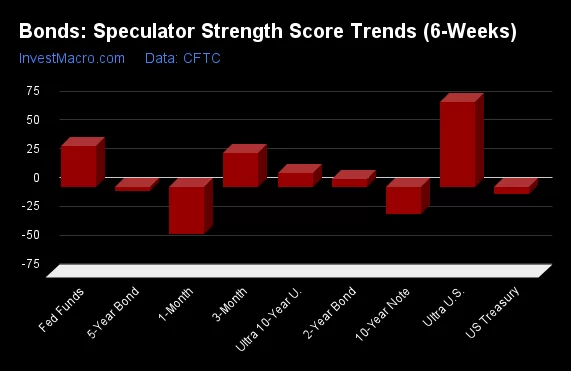
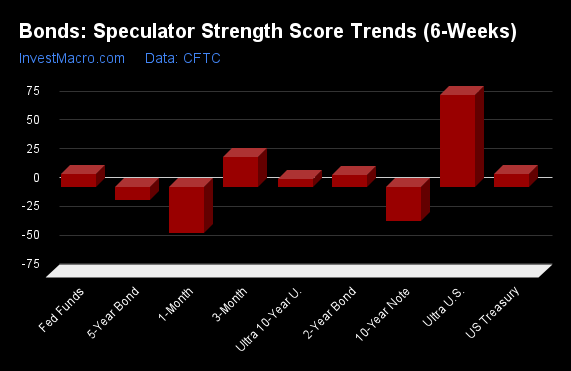
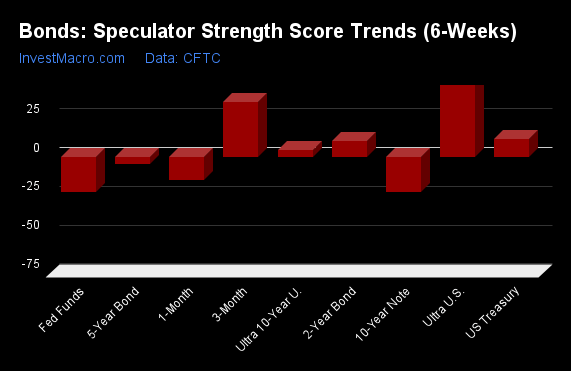
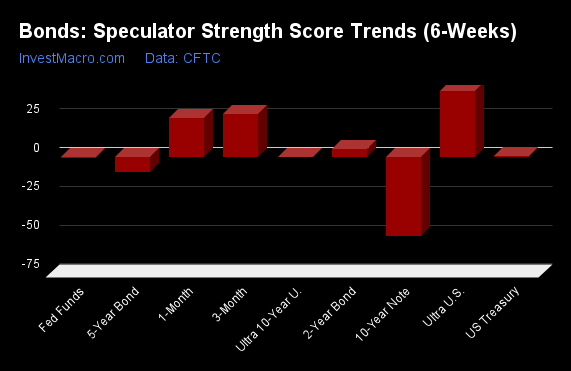
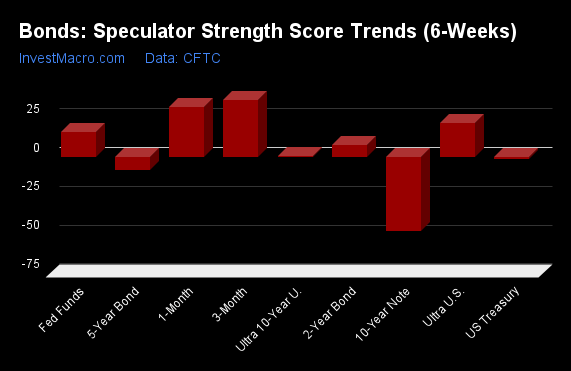
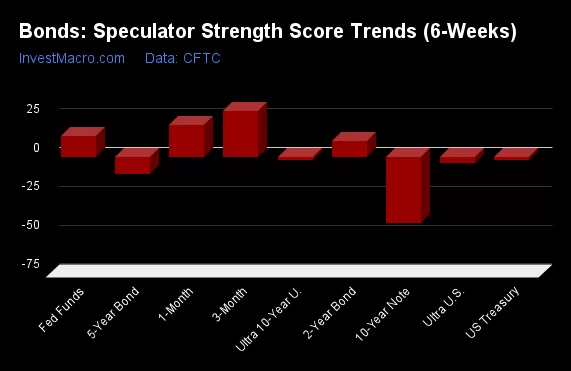
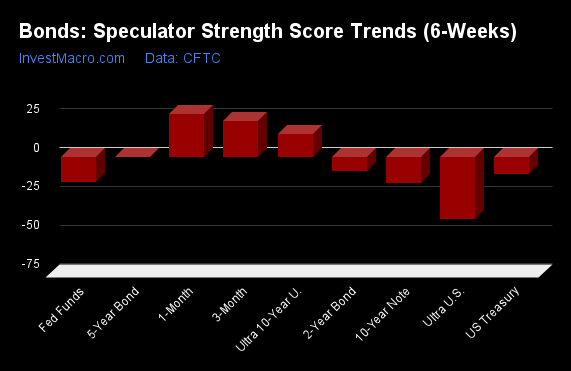
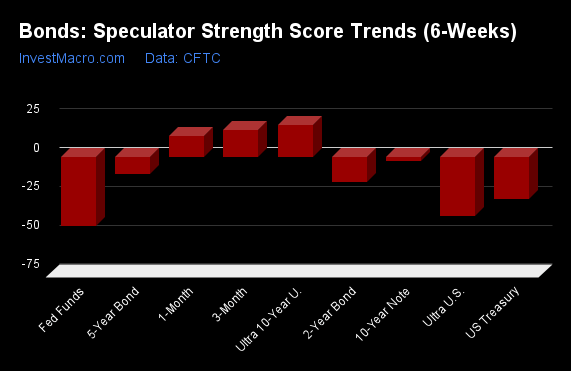
Fed Funds & Ultra Treasury Bonds top the 6-Week Strength Trends
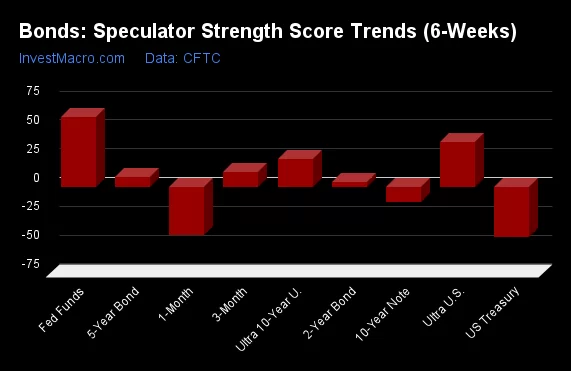
COT Strength Score Trends (or move index, calculates the 6-week changes in strength scores) showed that the Fed Funds (60 percent) and the Ultra Treasury Bonds (38 percent) lead the past six weeks trends for bonds. The Ultra 10-Year Bonds (24 percent) are the next highest positive movers in the latest trends data.
The US Treasury Bond (-44 percent) and the SOFR 1-Month (-42 percent) lead the downside trend scores currently with the 10-Year Bonds (-13 percent) following next with lower trend scores.
Strength Trend Statistics:
Fed Funds (60.0 percent) vs Fed Funds previous week (50.8 percent)
2-Year Bond (3.7 percent) vs 2-Year Bond previous week (5.0 percent)
5-Year Bond (8.6 percent) vs 5-Year Bond previous week (5.8 percent)
10-Year Bond (-13.2 percent) vs 10-Year Bond previous week (-25.4 percent)
Ultra 10-Year Bond (23.5 percent) vs Ultra 10-Year Bond previous week (24.7 percent)
US Treasury Bond (-44.0 percent) vs US Treasury Bond previous week (-18.1 percent)
Ultra US Treasury Bond (38.3 percent) vs Ultra US Treasury Bond previous week (47.3 percent)
SOFR 1-Month (-42.1 percent) vs SOFR 1-Month previous week (-45.7 percent)
SOFR 3-Months (12.8 percent) vs SOFR 3-Months previous week (15.5 percent)
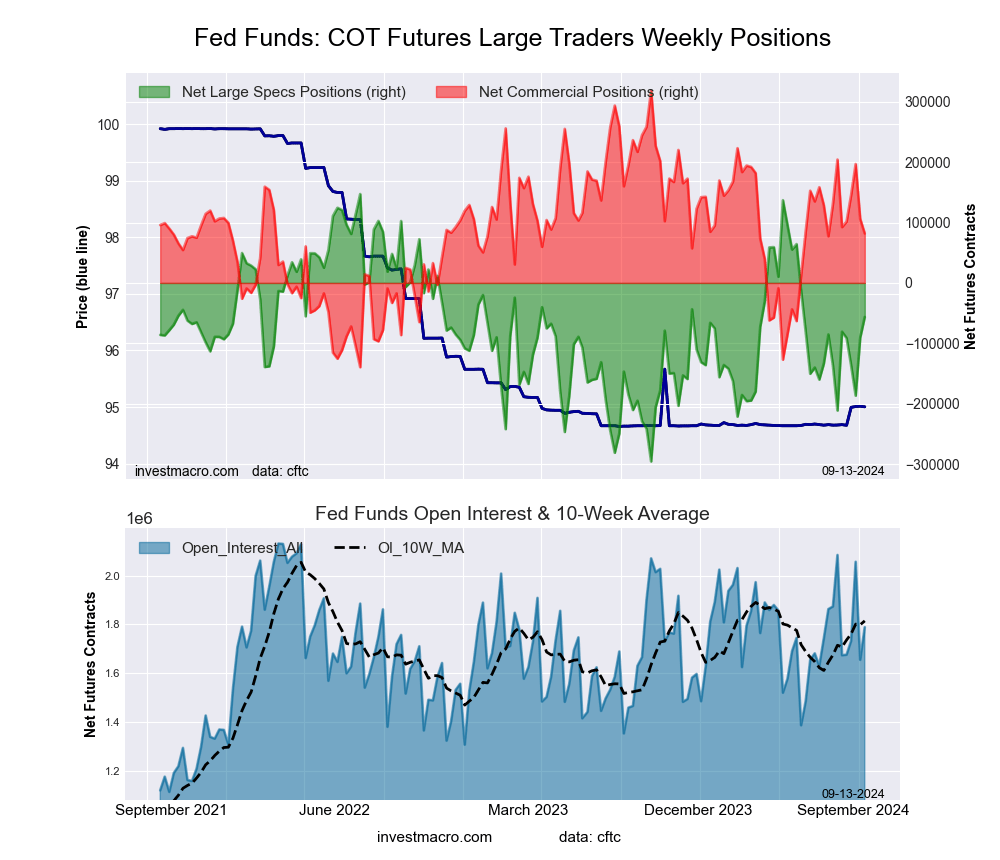
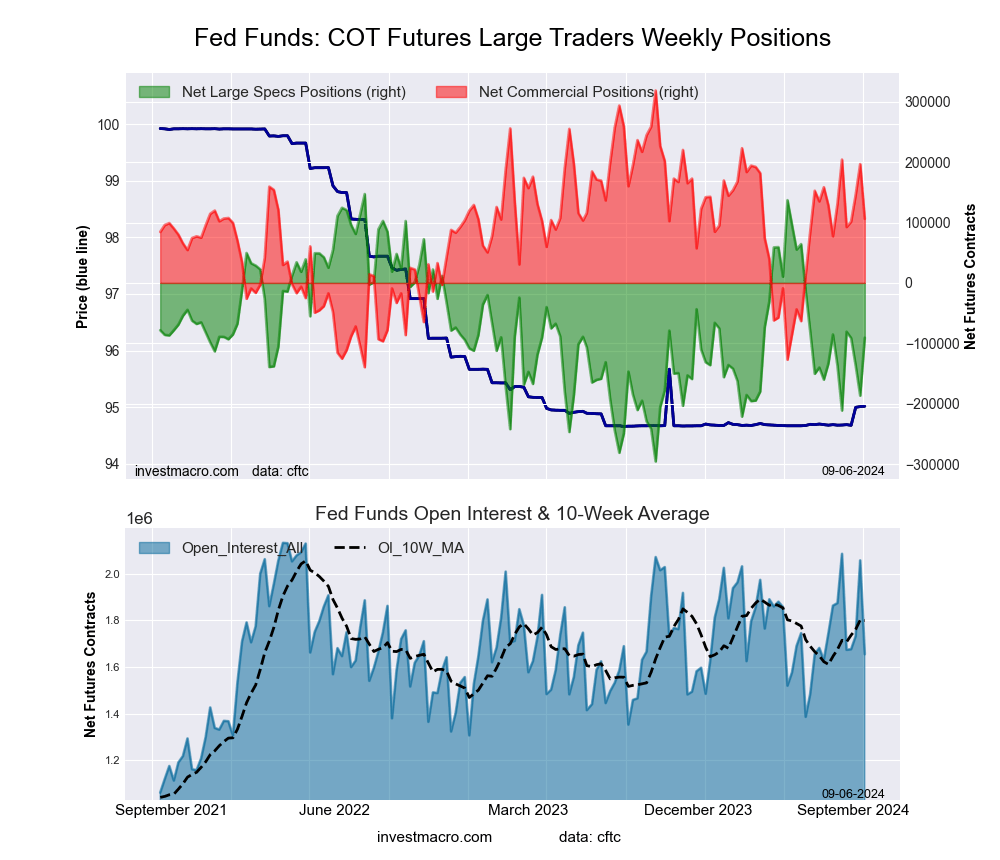
30-Day Federal Funds Futures:
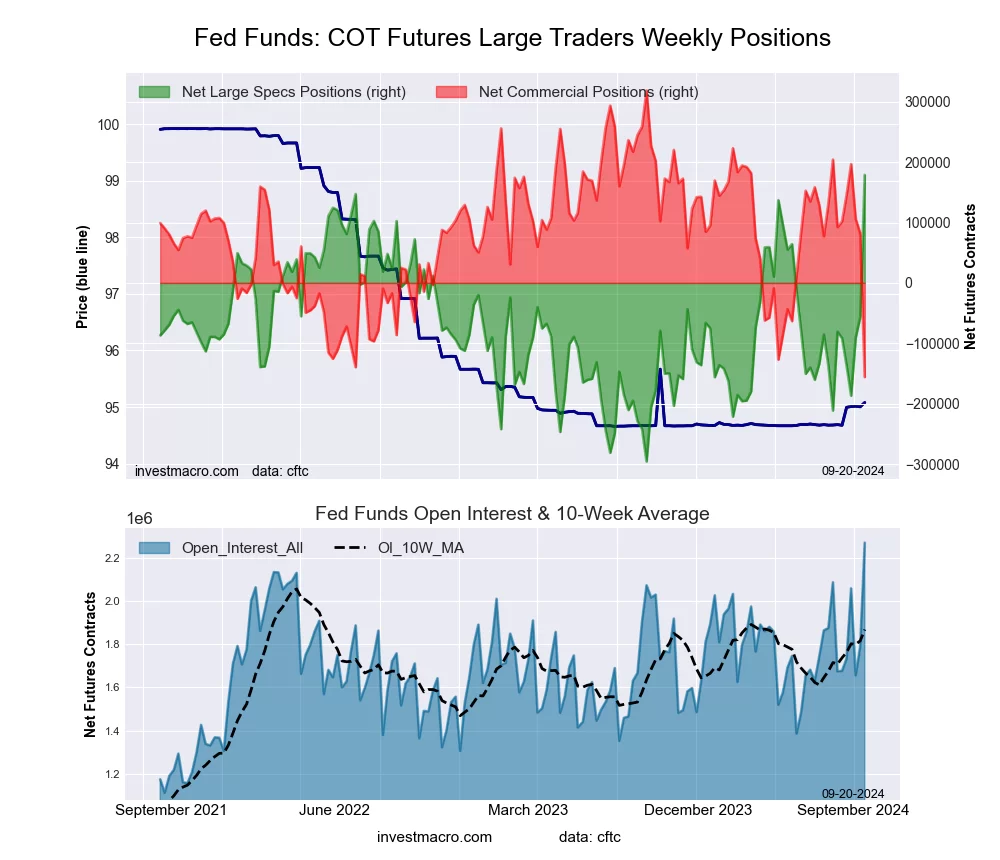
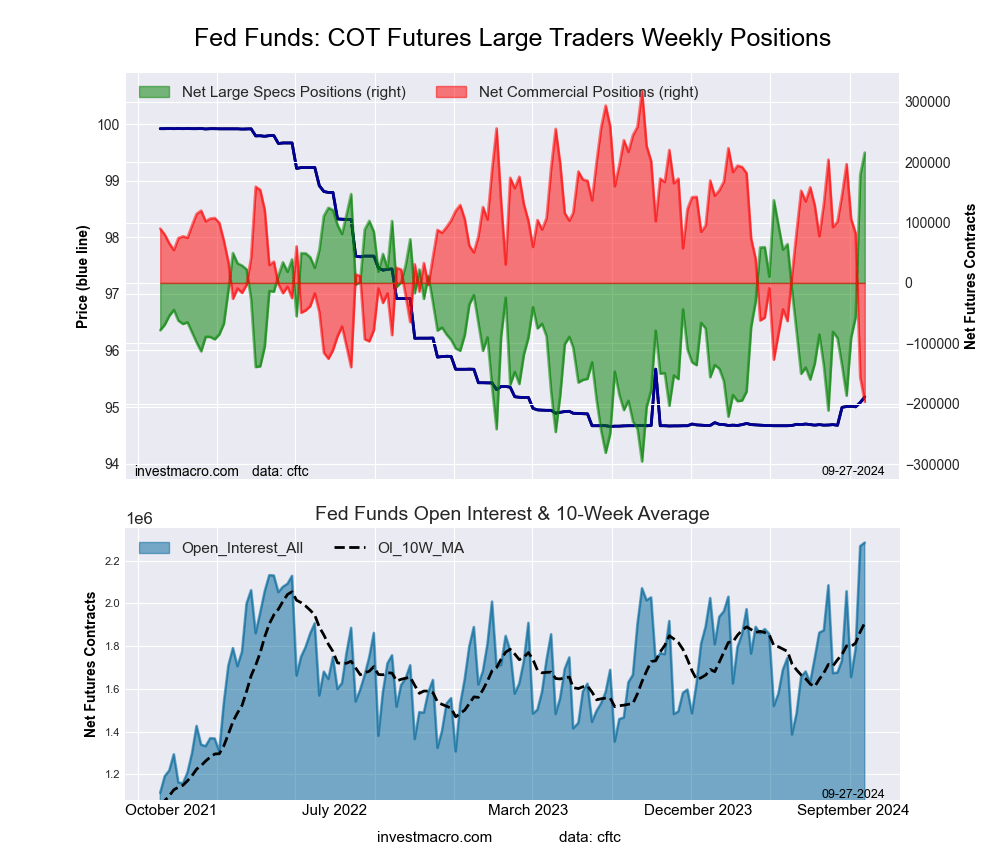 The 30-Day Federal Funds large speculator standing this week recorded a net position of 215,860 contracts in the data reported through Tuesday. This was a weekly lift of 37,053 contracts from the previous week which had a total of 178,807 net contracts.
This week’s current strength score (the trader positioning range over the past three years, measured from 0 to 100) shows the speculators are currently Bullish-Extreme with a score of 100.0 percent. The commercials are Bearish-Extreme with a score of 0.0 percent and the small traders (not shown in chart) are Bullish with a score of 50.2 percent.
Price Trend-Following Model: Downtrend
Our weekly trend-following model classifies the current market price position as: Downtrend. The current action for the model is considered to be: Hold – Maintain Short Position.
| 30-Day Federal Funds Statistics | SPECULATORS | COMMERCIALS | SMALL TRADERS |
| – Percent of Open Interest Longs: | 22.2 | 51.8 | 1.3 |
| – Percent of Open Interest Shorts: | 12.7 | 60.4 | 2.2 |
| – Net Position: | 215,860 | -196,844 | -19,016 |
| – Gross Longs: | 506,691 | 1,182,918 | 30,705 |
| – Gross Shorts: | 290,831 | 1,379,762 | 49,721 |
| – Long to Short Ratio: | 1.7 to 1 | 0.9 to 1 | 0.6 to 1 |
| NET POSITION TREND: | |||
| – Strength Index Score (3 Year Range Pct): | 100.0 | 0.0 | 50.2 |
| – Strength Index Reading (3 Year Range): | Bullish-Extreme | Bearish-Extreme | Bullish |
| NET POSITION MOVEMENT INDEX: | |||
| – 6-Week Change in Strength Index: | 60.0 | -57.9 | -16.0 |
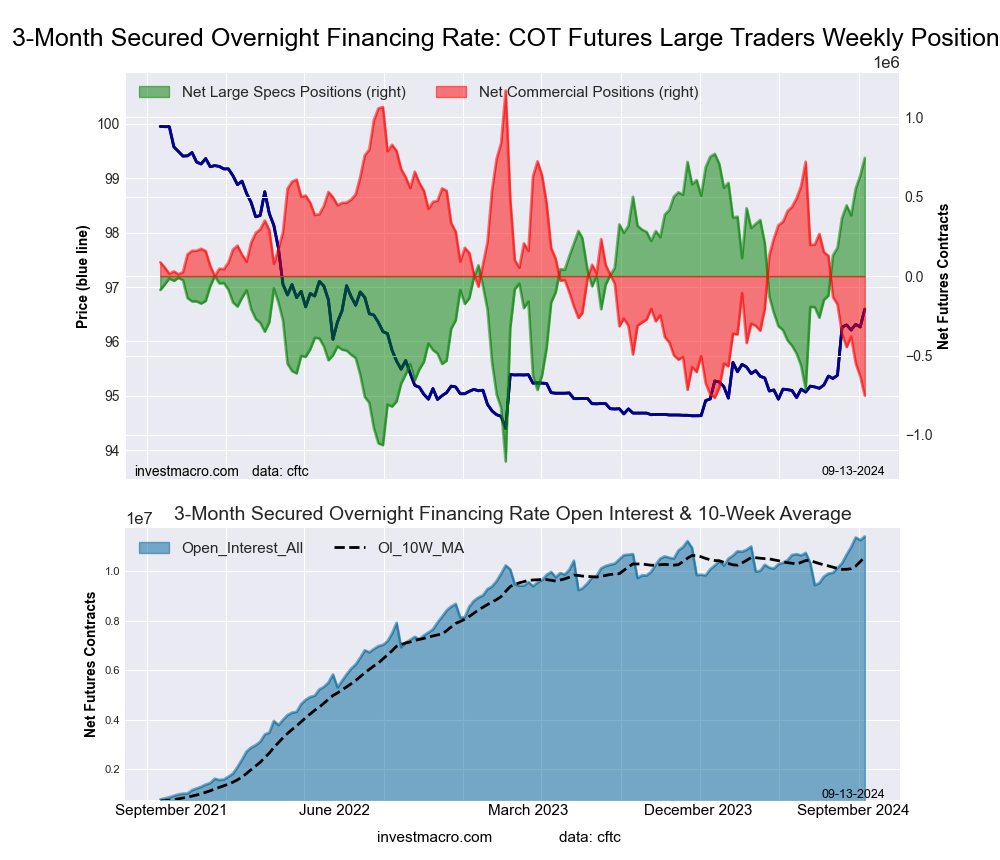
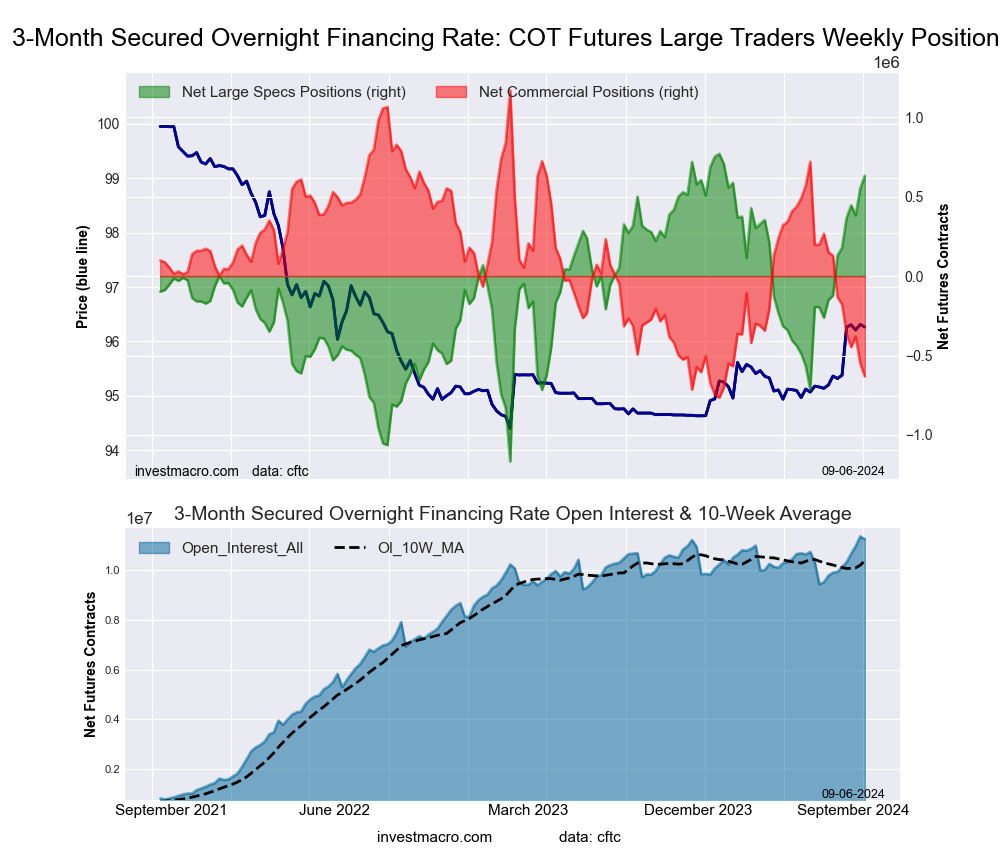
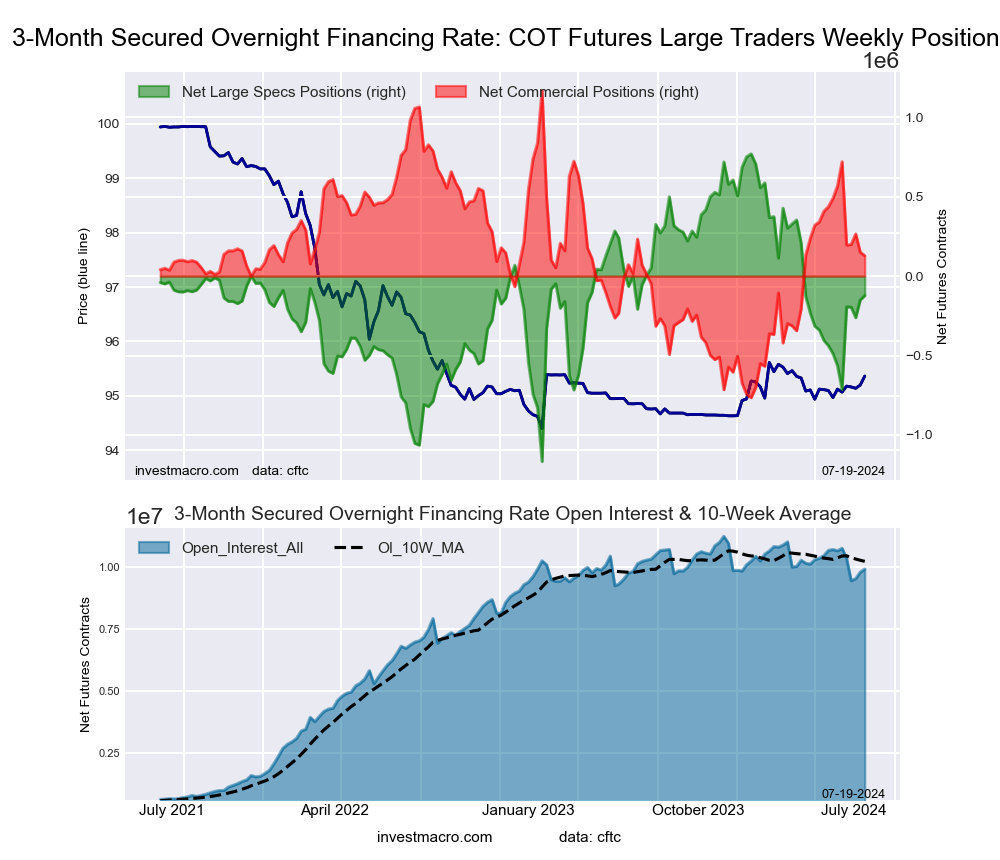
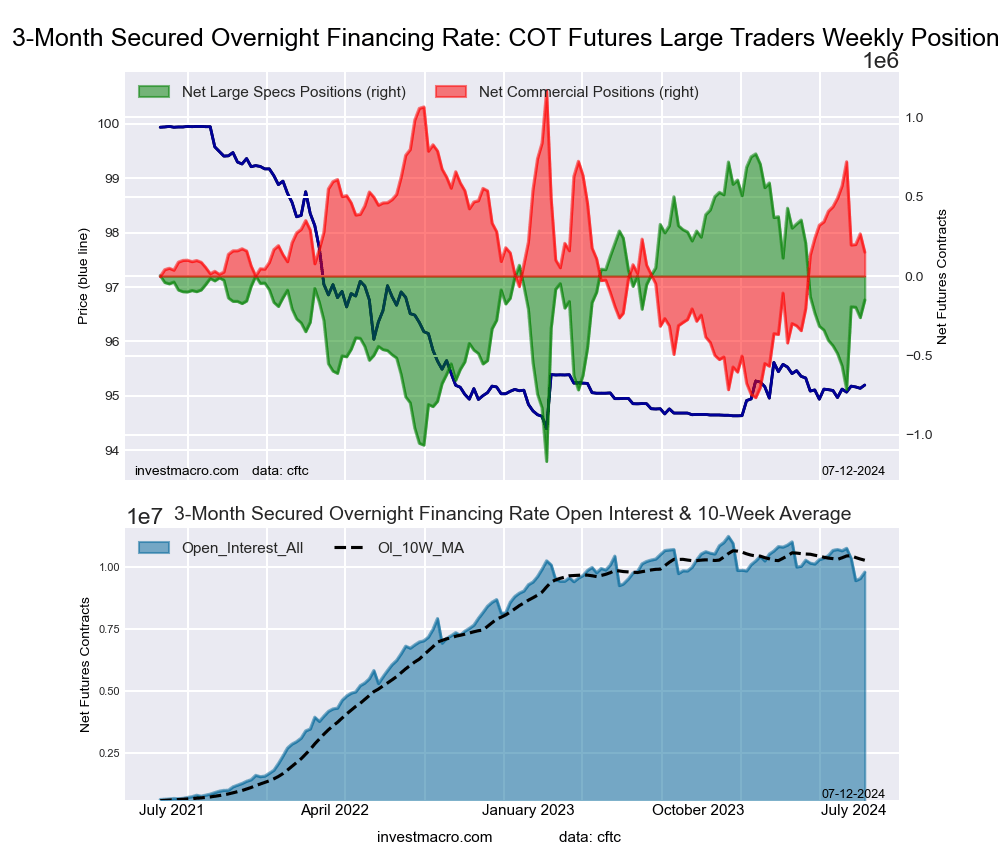
Secured Overnight Financing Rate (3-Month) Futures:
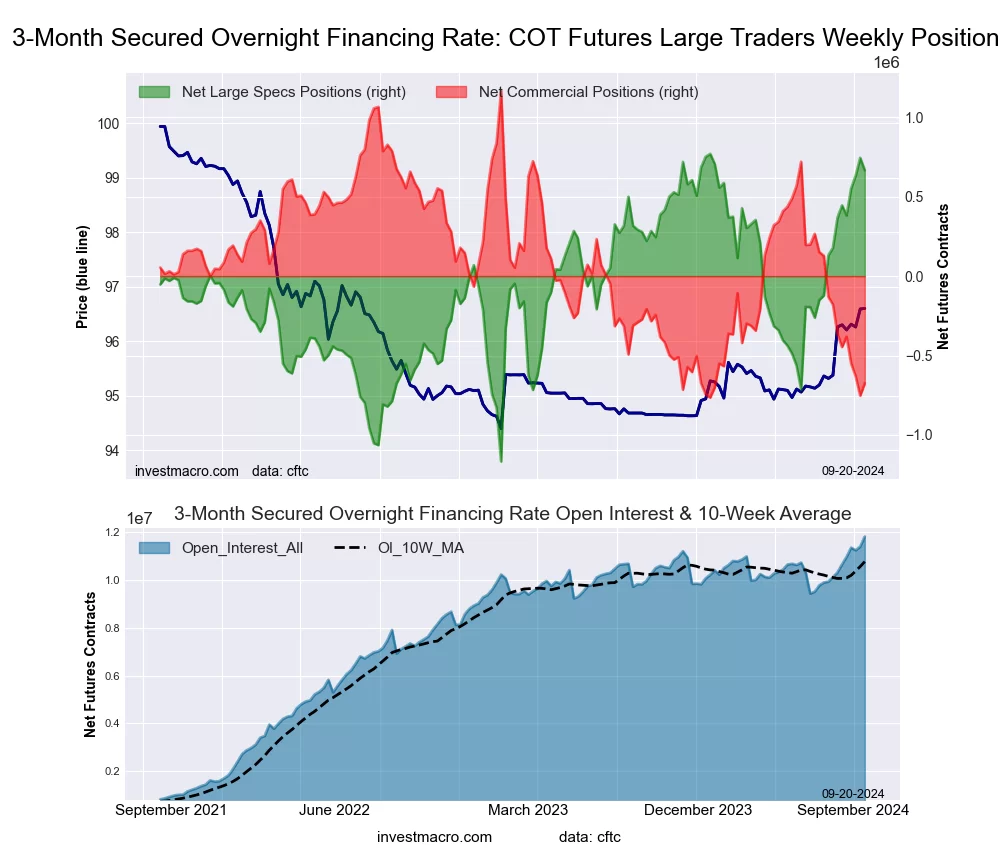
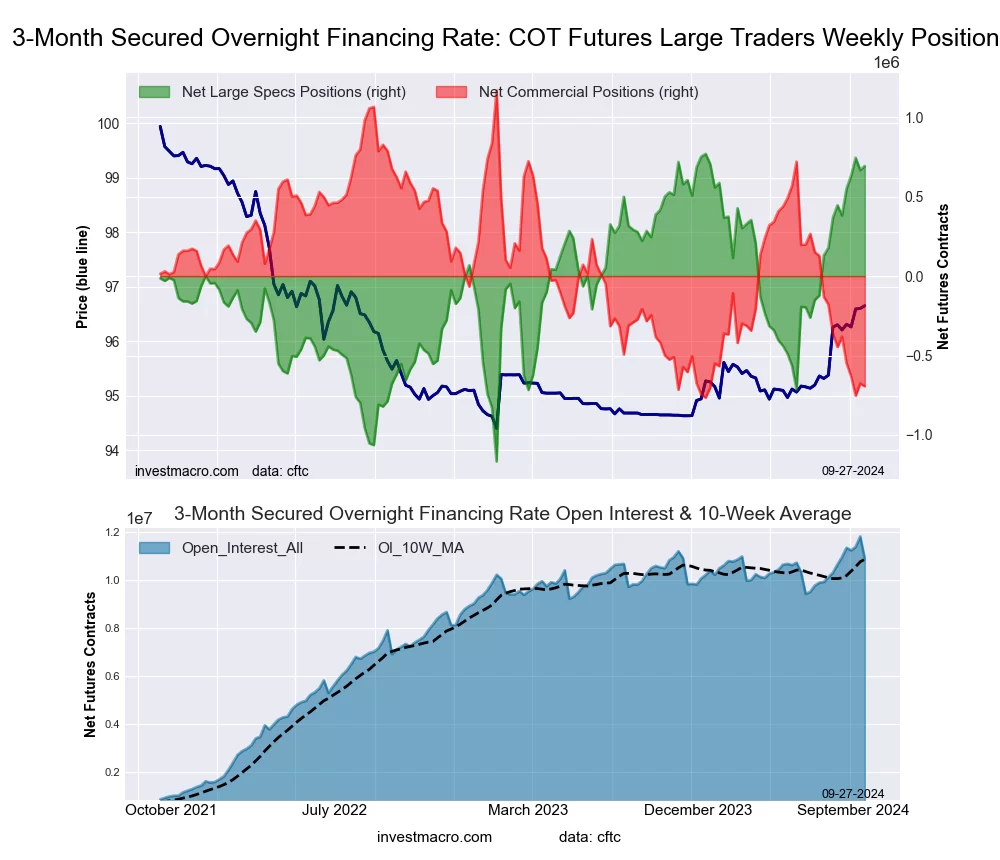 The Secured Overnight Financing Rate (3-Month) large speculator standing this week recorded a net position of 692,822 contracts in the data reported through Tuesday. This was a weekly gain of 26,227 contracts from the previous week which had a total of 666,595 net contracts.
This week’s current strength score (the trader positioning range over the past three years, measured from 0 to 100) shows the speculators are currently Bullish-Extreme with a score of 96.1 percent. The commercials are Bearish-Extreme with a score of 3.7 percent and the small traders (not shown in chart) are Bullish-Extreme with a score of 88.3 percent.
Price Trend-Following Model: Weak Uptrend
Our weekly trend-following model classifies the current market price position as: Weak Uptrend. The current action for the model is considered to be: Hold – Maintain Long Position.
| SOFR 3-Months Statistics | SPECULATORS | COMMERCIALS | SMALL TRADERS |
| – Percent of Open Interest Longs: | 19.0 | 52.7 | 0.3 |
| – Percent of Open Interest Shorts: | 12.7 | 59.0 | 0.3 |
| – Net Position: | 692,822 | -693,686 | 864 |
| – Gross Longs: | 2,075,175 | 5,741,888 | 33,659 |
| – Gross Shorts: | 1,382,353 | 6,435,574 | 32,795 |
| – Long to Short Ratio: | 1.5 to 1 | 0.9 to 1 | 1.0 to 1 |
| NET POSITION TREND: | |||
| – Strength Index Score (3 Year Range Pct): | 96.1 | 3.7 | 88.3 |
| – Strength Index Reading (3 Year Range): | Bullish-Extreme | Bearish-Extreme | Bullish-Extreme |
| NET POSITION MOVEMENT INDEX: | |||
| – 6-Week Change in Strength Index: | 12.8 | -12.8 | -0.4 |
Individual Bond Markets:
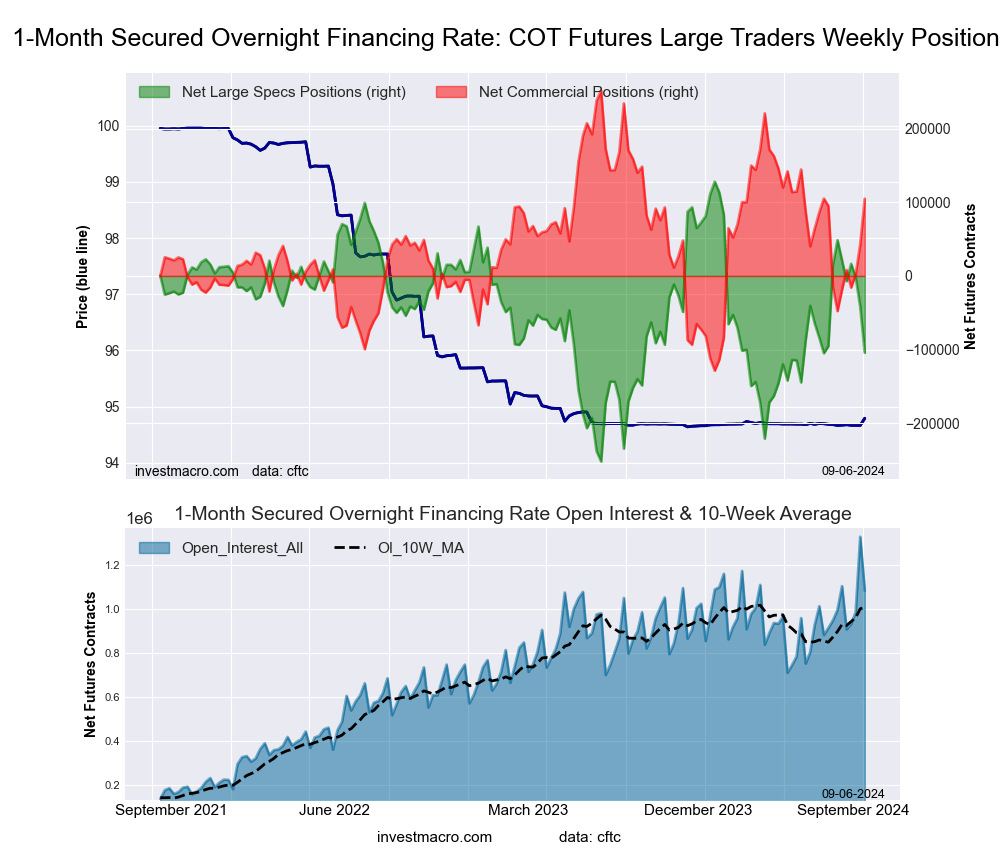
Secured Overnight Financing Rate (1-Month) Futures:
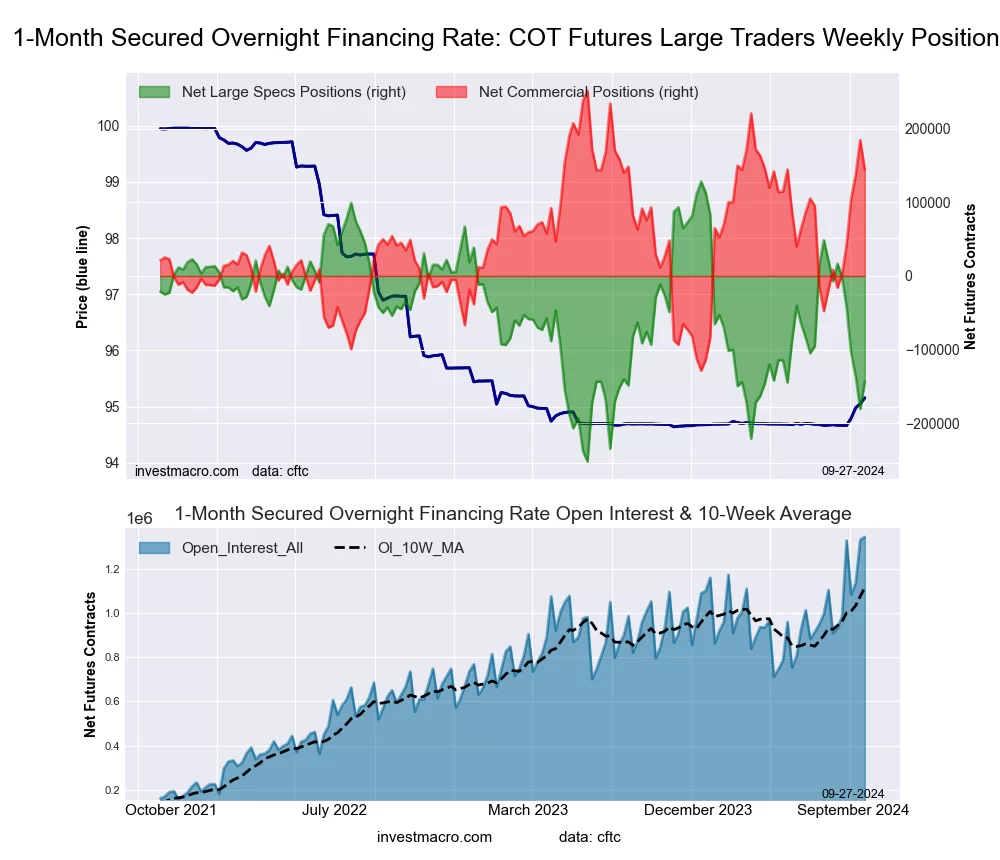 The Secured Overnight Financing Rate (1-Month) large speculator standing this week recorded a net position of -143,333 contracts in the data reported through Tuesday. This was a weekly lift of 37,194 contracts from the previous week which had a total of -180,527 net contracts.
This week’s current strength score (the trader positioning range over the past three years, measured from 0 to 100) shows the speculators are currently Bearish with a score of 28.5 percent. The commercials are Bullish with a score of 71.7 percent and the small traders (not shown in chart) are Bullish with a score of 51.0 percent.
Price Trend-Following Model: Strong Uptrend
Our weekly trend-following model classifies the current market price position as: Strong Uptrend.
| SOFR 1-Month Statistics | SPECULATORS | COMMERCIALS | SMALL TRADERS |
| – Percent of Open Interest Longs: | 16.2 | 61.6 | 0.0 |
| – Percent of Open Interest Shorts: | 26.8 | 50.9 | 0.1 |
| – Net Position: | -143,333 | 143,950 | -617 |
| – Gross Longs: | 216,897 | 827,328 | 419 |
| – Gross Shorts: | 360,230 | 683,378 | 1,036 |
| – Long to Short Ratio: | 0.6 to 1 | 1.2 to 1 | 0.4 to 1 |
| NET POSITION TREND: | |||
| – Strength Index Score (3 Year Range Pct): | 28.5 | 71.7 | 51.0 |
| – Strength Index Reading (3 Year Range): | Bearish | Bullish | Bullish |
| NET POSITION MOVEMENT INDEX: | |||
| – 6-Week Change in Strength Index: | -42.1 | 42.0 | 1.3 |
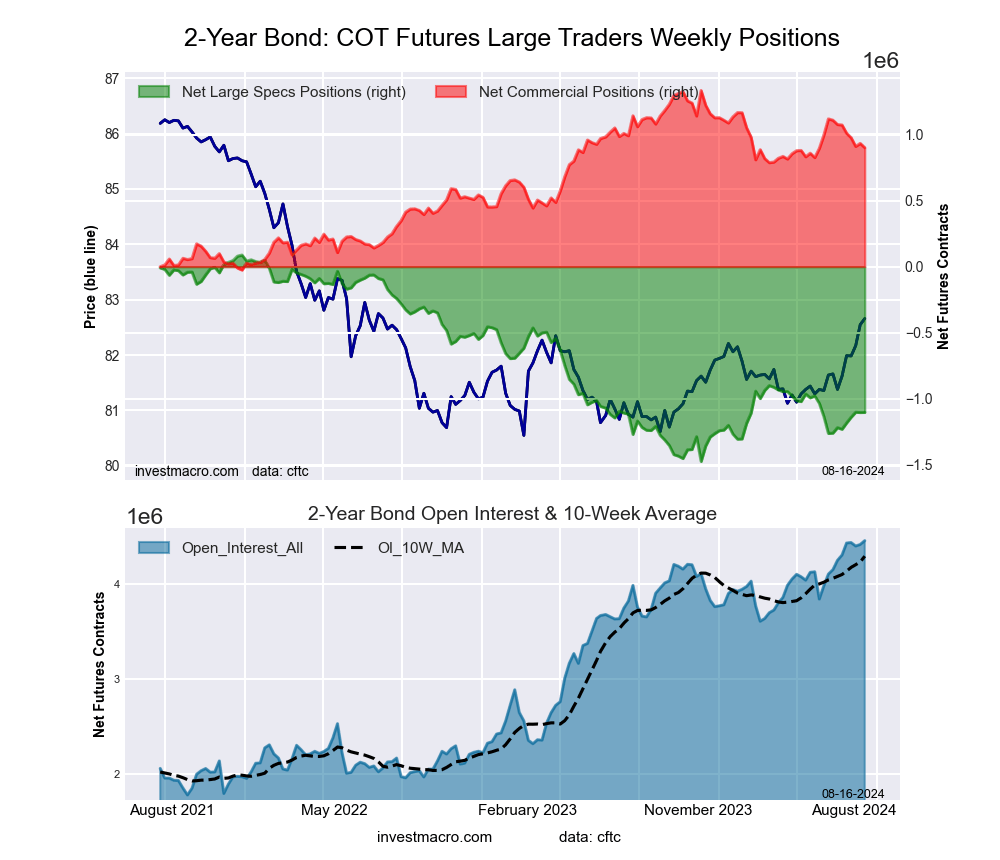
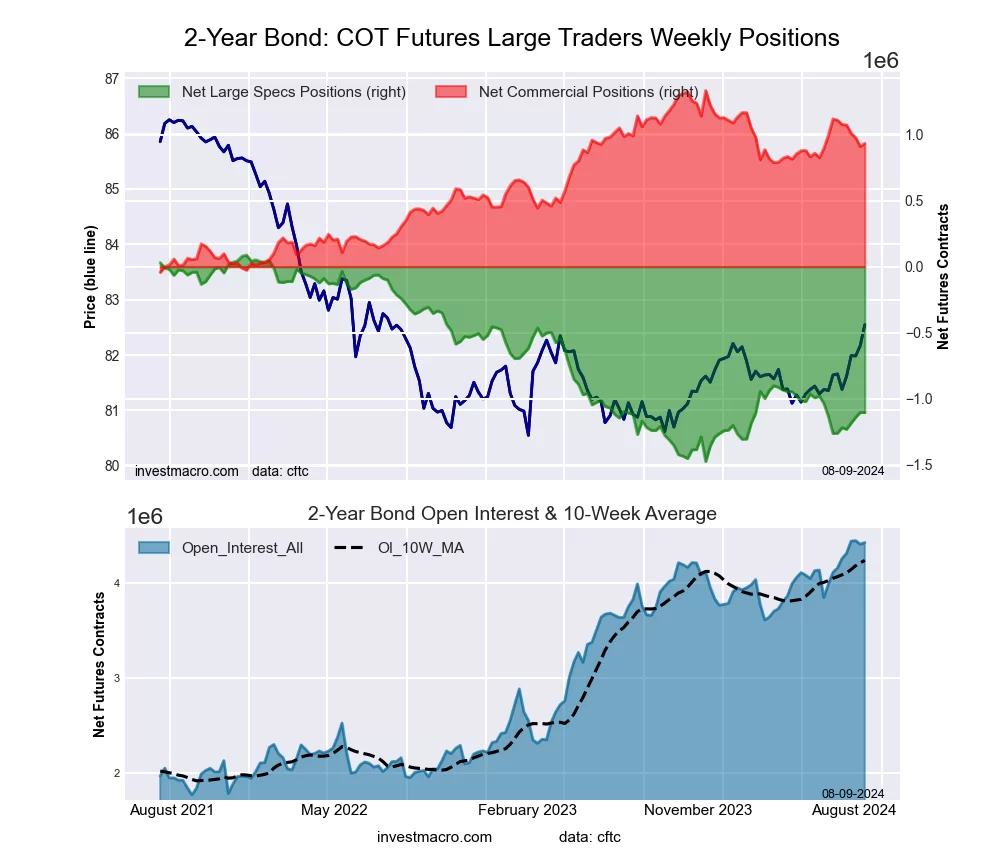
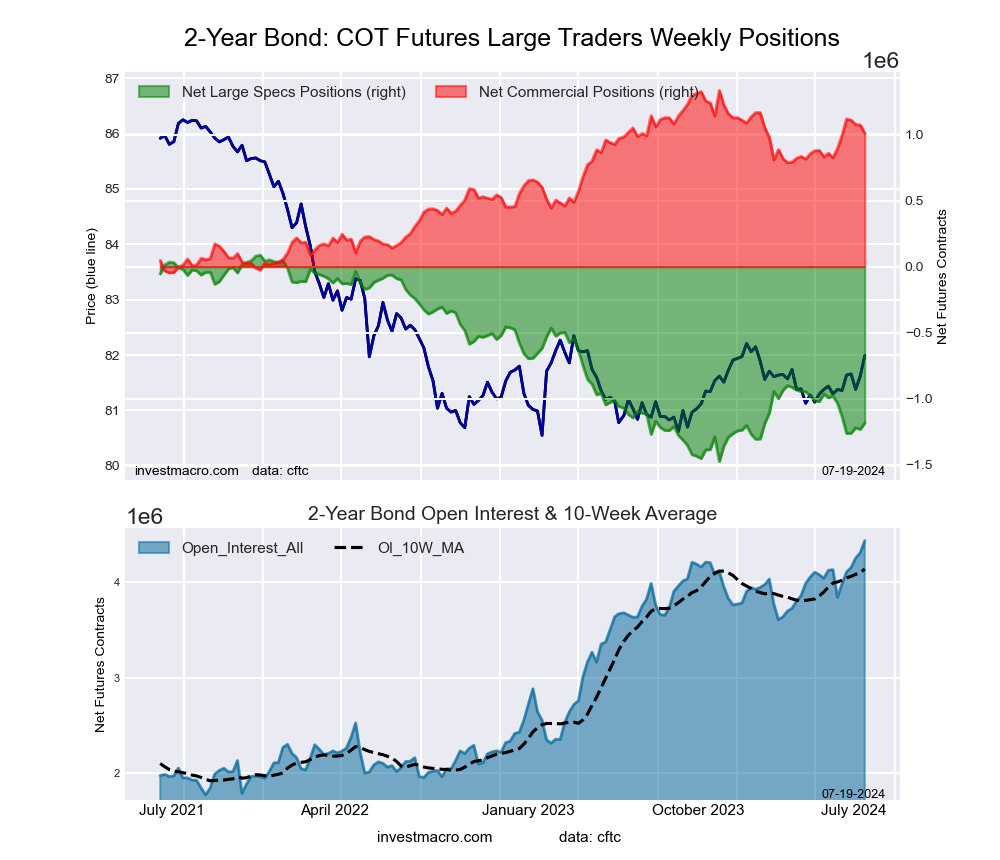
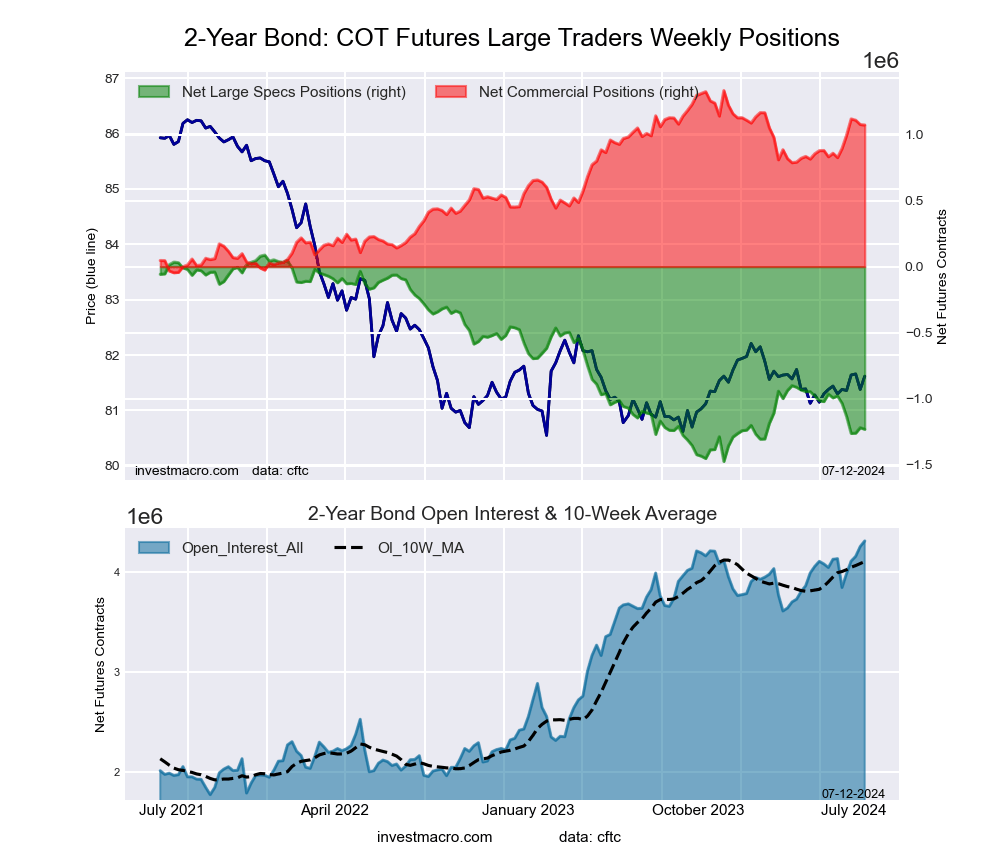
2-Year Treasury Note Futures:
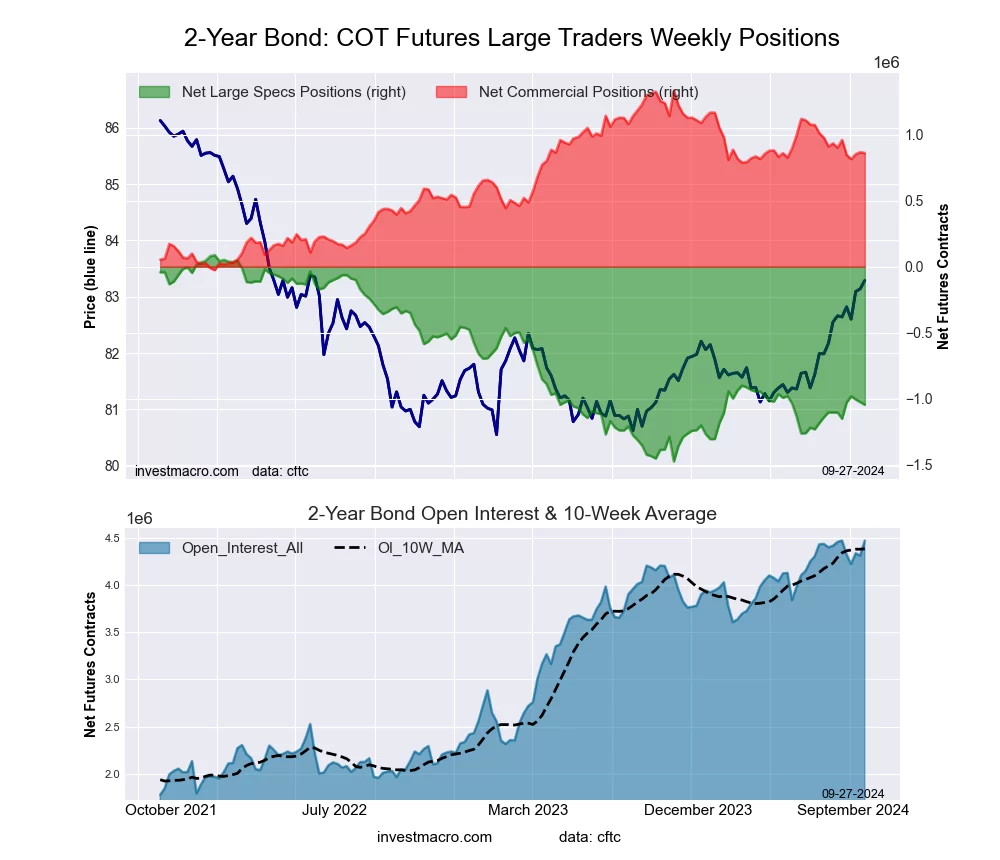 The 2-Year Treasury Note large speculator standing this week recorded a net position of -1,046,560 contracts in the data reported through Tuesday. This was a weekly lowering of -20,140 contracts from the previous week which had a total of -1,026,420 net contracts.
This week’s current strength score (the trader positioning range over the past three years, measured from 0 to 100) shows the speculators are currently Bearish with a score of 27.5 percent. The commercials are Bullish with a score of 65.1 percent and the small traders (not shown in chart) are Bullish-Extreme with a score of 94.7 percent.
Price Trend-Following Model: Strong Uptrend
Our weekly trend-following model classifies the current market price position as: Strong Uptrend.
| 2-Year Treasury Note Statistics | SPECULATORS | COMMERCIALS | SMALL TRADERS |
| – Percent of Open Interest Longs: | 16.3 | 75.5 | 6.5 |
| – Percent of Open Interest Shorts: | 39.7 | 56.2 | 2.3 |
| – Net Position: | -1,046,560 | 860,274 | 186,286 |
| – Gross Longs: | 730,128 | 3,375,823 | 288,592 |
| – Gross Shorts: | 1,776,688 | 2,515,549 | 102,306 |
| – Long to Short Ratio: | 0.4 to 1 | 1.3 to 1 | 2.8 to 1 |
| NET POSITION TREND: | |||
| – Strength Index Score (3 Year Range Pct): | 27.5 | 65.1 | 94.7 |
| – Strength Index Reading (3 Year Range): | Bearish | Bullish | Bullish-Extreme |
| NET POSITION MOVEMENT INDEX: | |||
| – 6-Week Change in Strength Index: | 3.7 | -3.0 | -5.3 |
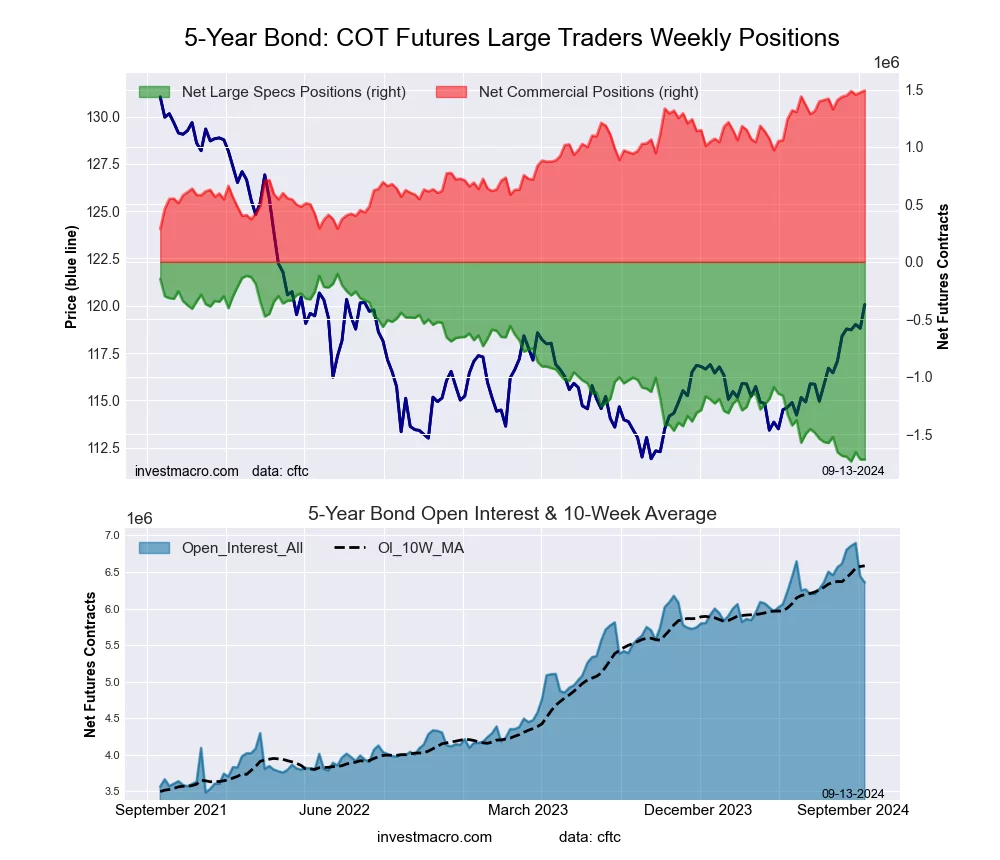
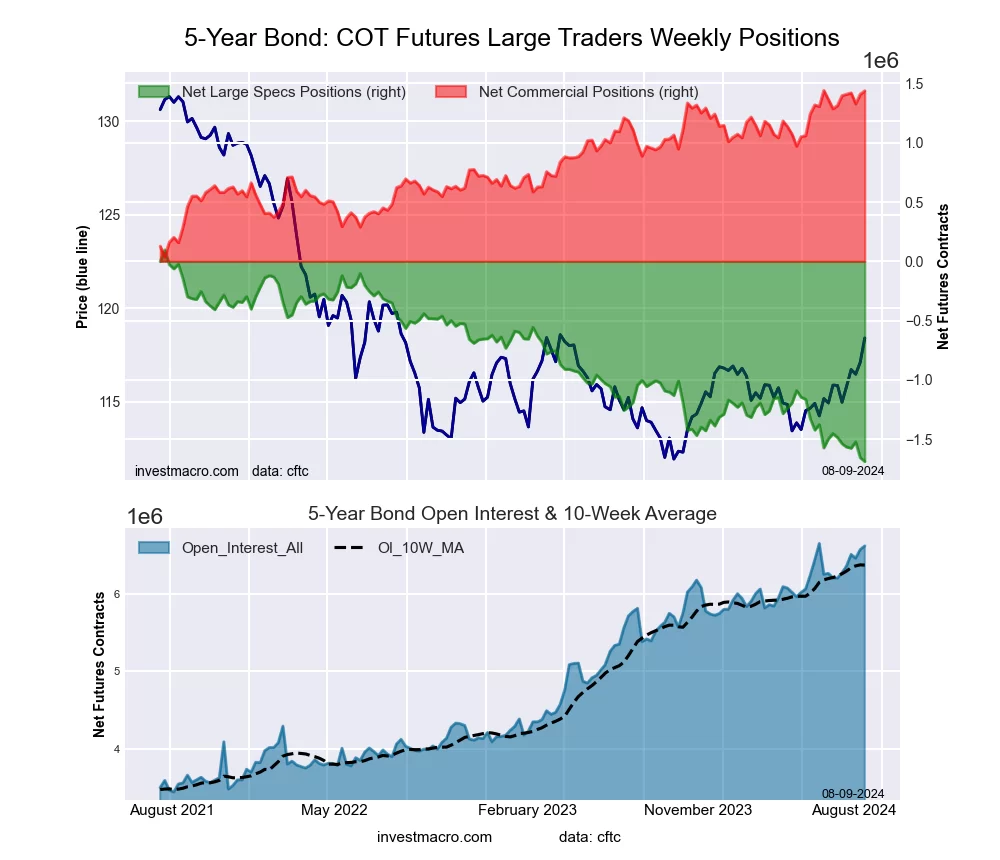
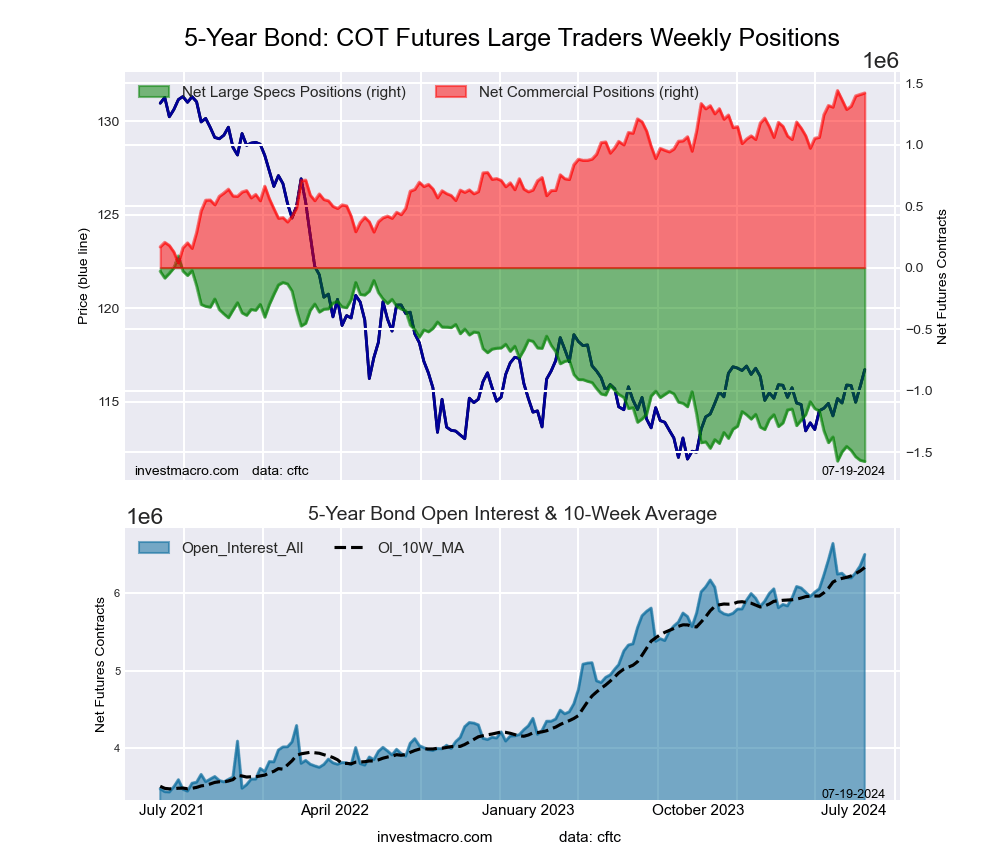
5-Year Treasury Note Futures:
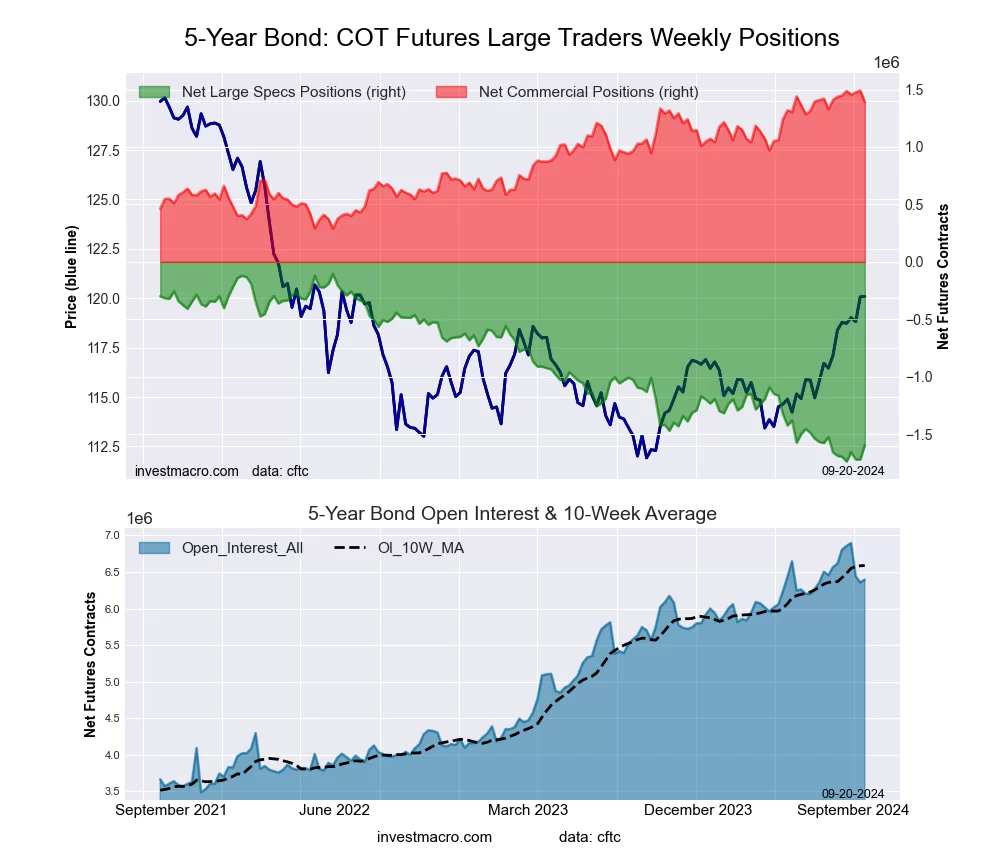
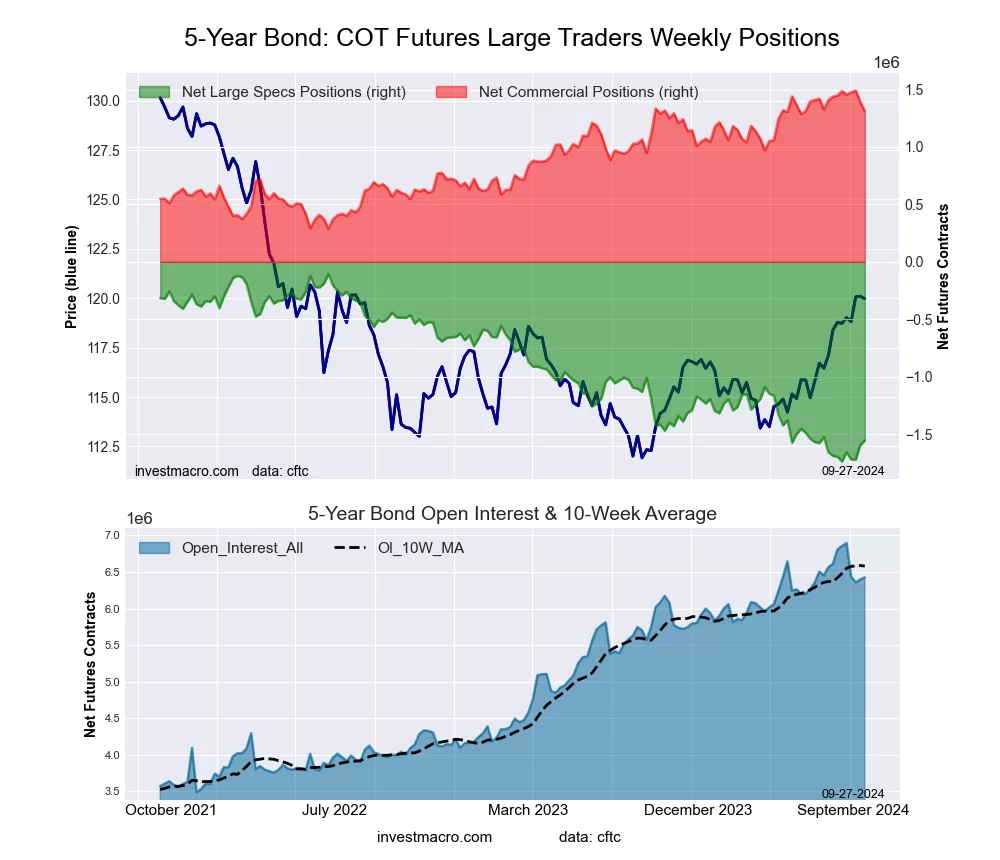 The 5-Year Treasury Note large speculator standing this week recorded a net position of -1,554,432 contracts in the data reported through Tuesday. This was a weekly lift of 39,428 contracts from the previous week which had a total of -1,593,860 net contracts.
This week’s current strength score (the trader positioning range over the past three years, measured from 0 to 100) shows the speculators are currently Bearish-Extreme with a score of 11.2 percent. The commercials are Bullish-Extreme with a score of 85.0 percent and the small traders (not shown in chart) are Bullish-Extreme with a score of 98.6 percent.
Price Trend-Following Model: Uptrend
Our weekly trend-following model classifies the current market price position as: Uptrend.
| 5-Year Treasury Note Statistics | SPECULATORS | COMMERCIALS | SMALL TRADERS |
| – Percent of Open Interest Longs: | 9.1 | 82.4 | 7.4 |
| – Percent of Open Interest Shorts: | 33.3 | 62.0 | 3.6 |
| – Net Position: | -1,554,432 | 1,311,411 | 243,021 |
| – Gross Longs: | 587,823 | 5,292,601 | 477,254 |
| – Gross Shorts: | 2,142,255 | 3,981,190 | 234,233 |
| – Long to Short Ratio: | 0.3 to 1 | 1.3 to 1 | 2.0 to 1 |
| NET POSITION TREND: | |||
| – Strength Index Score (3 Year Range Pct): | 11.2 | 85.0 | 98.6 |
| – Strength Index Reading (3 Year Range): | Bearish-Extreme | Bullish-Extreme | Bullish-Extreme |
| NET POSITION MOVEMENT INDEX: | |||
| – 6-Week Change in Strength Index: | 8.6 | -11.4 | -0.8 |
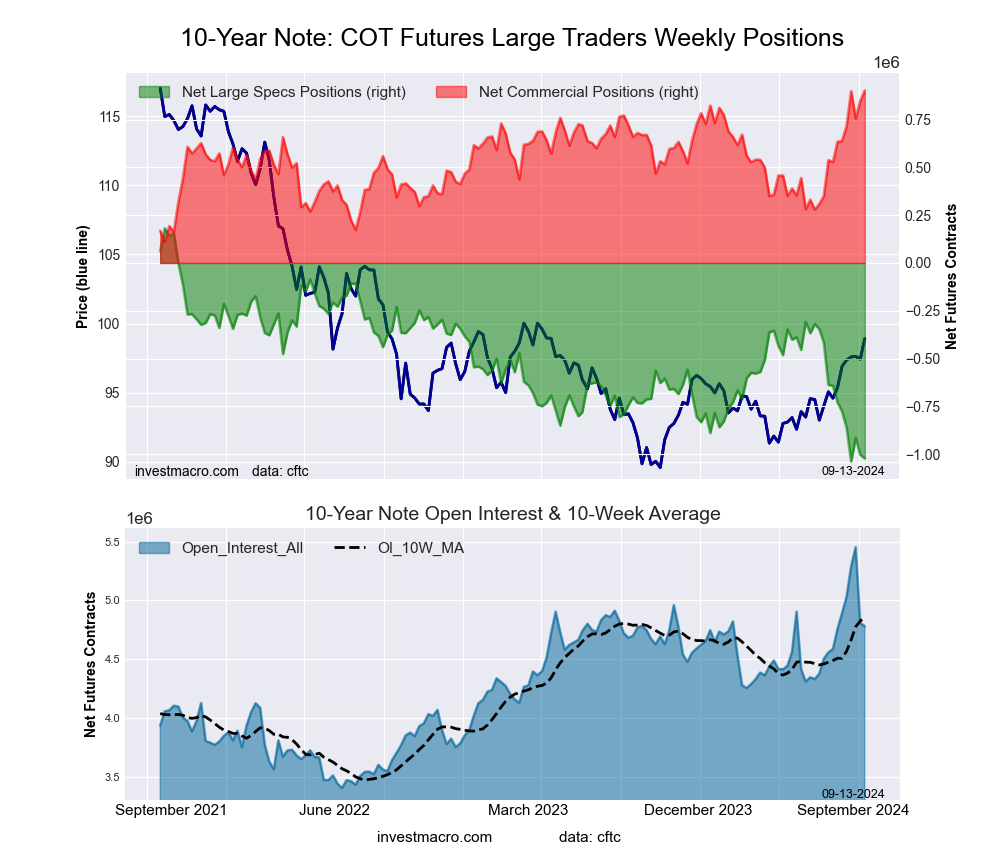
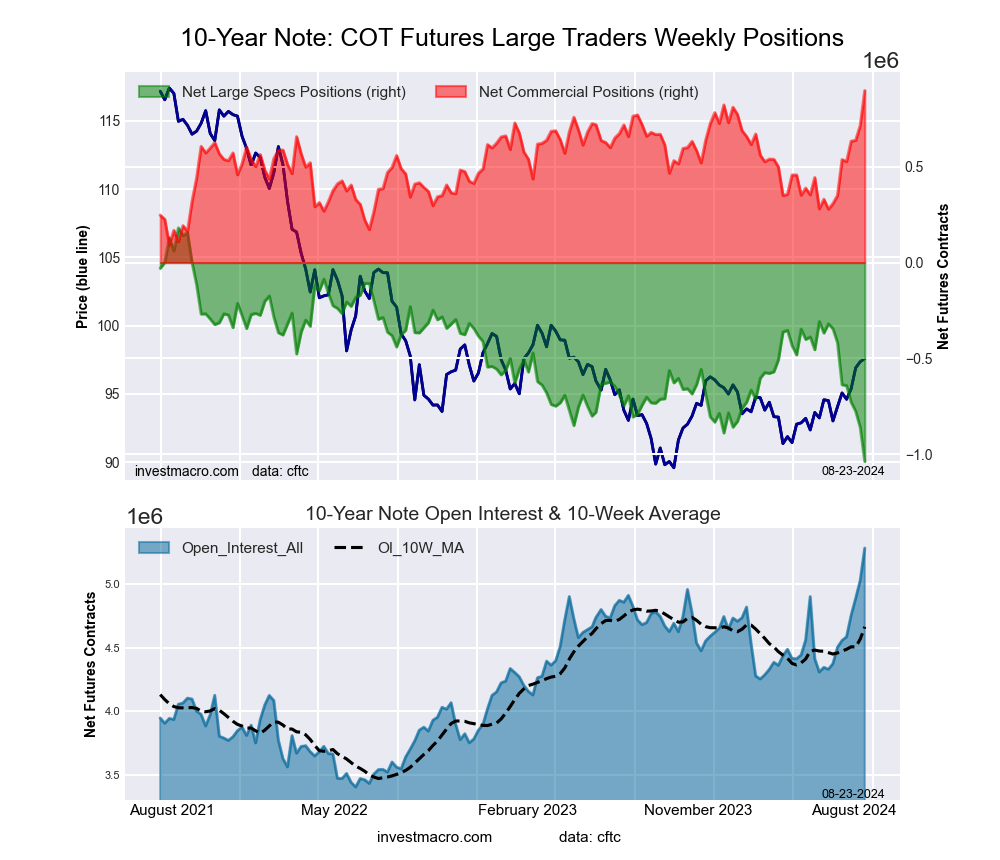
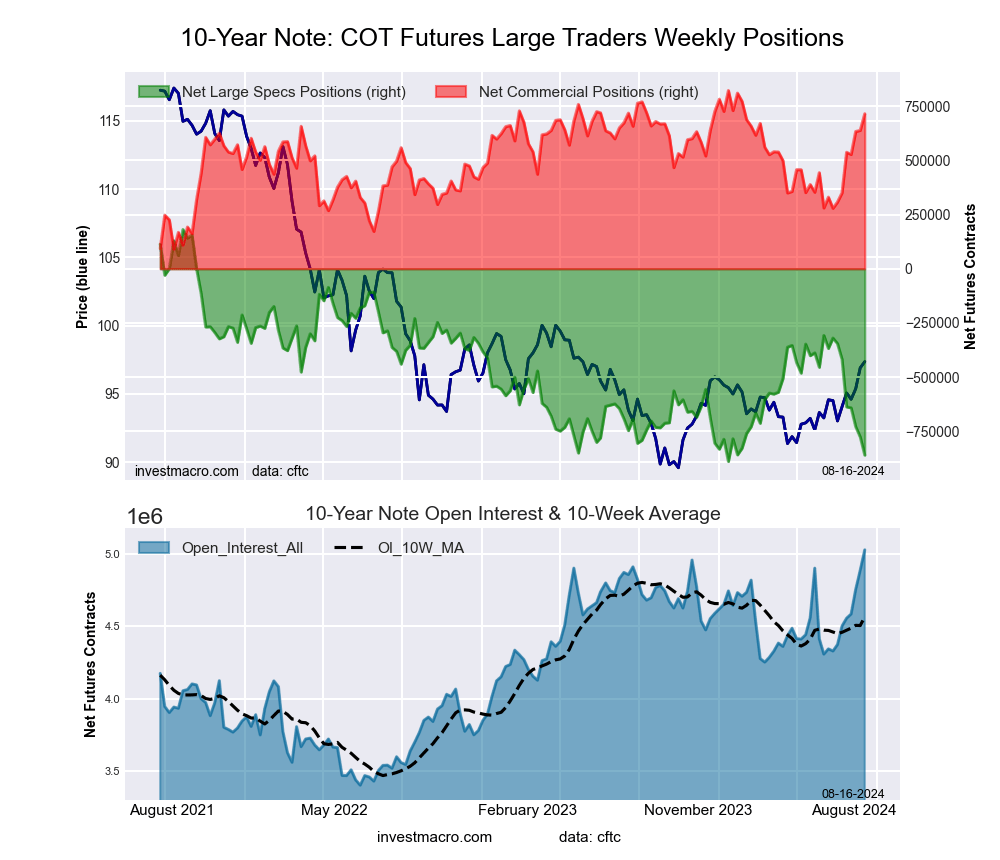
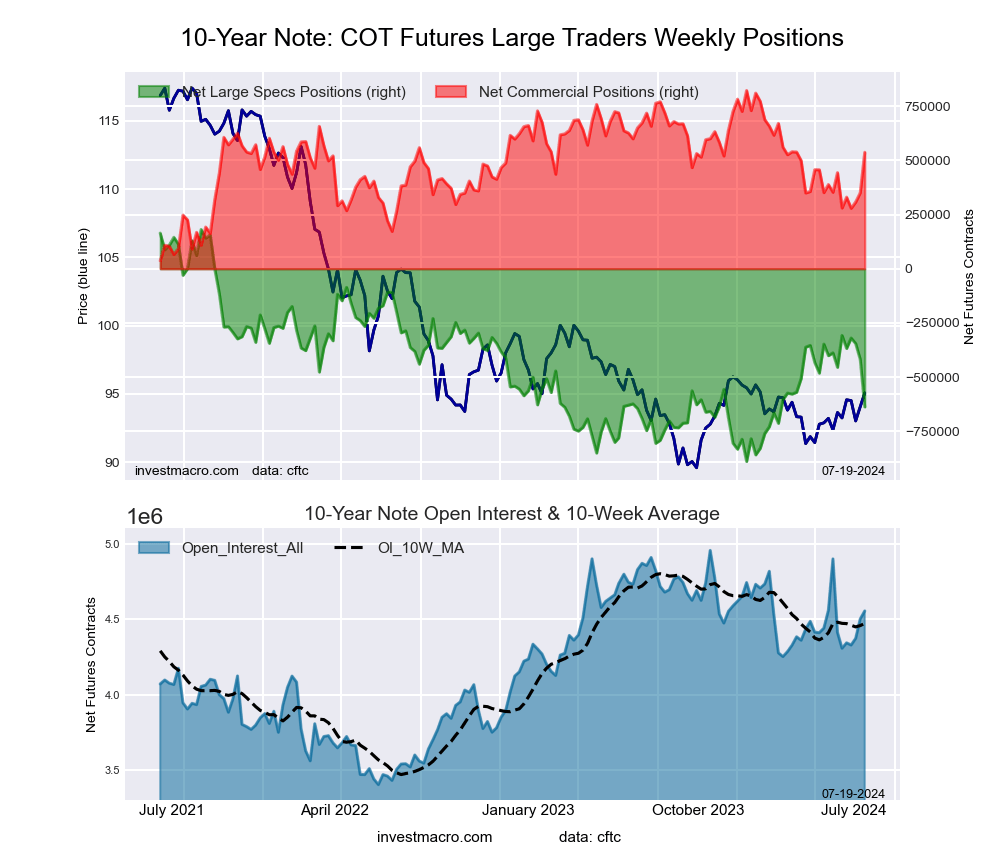
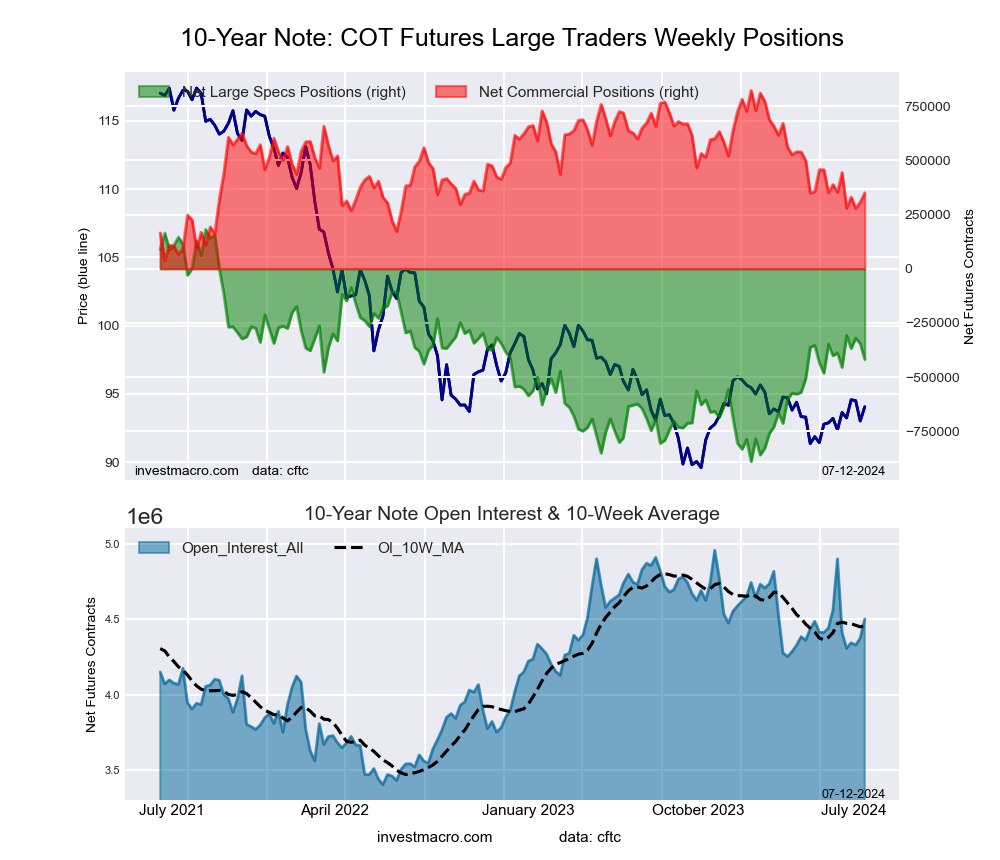
10-Year Treasury Note Futures:
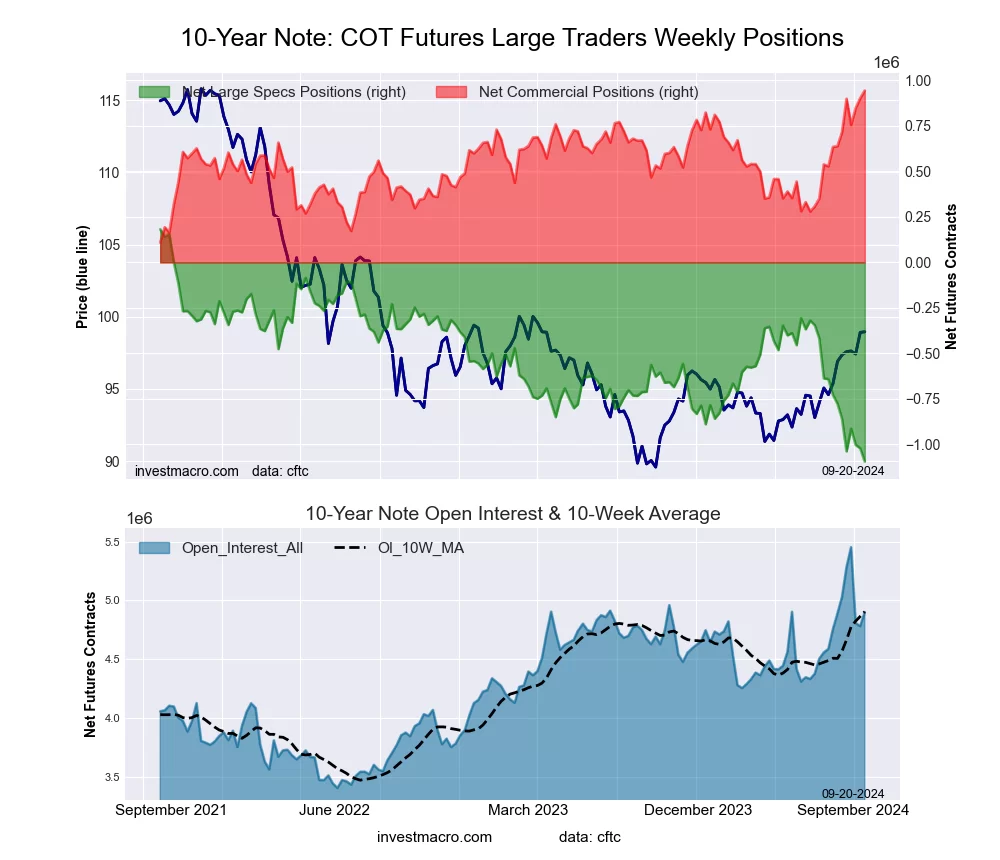
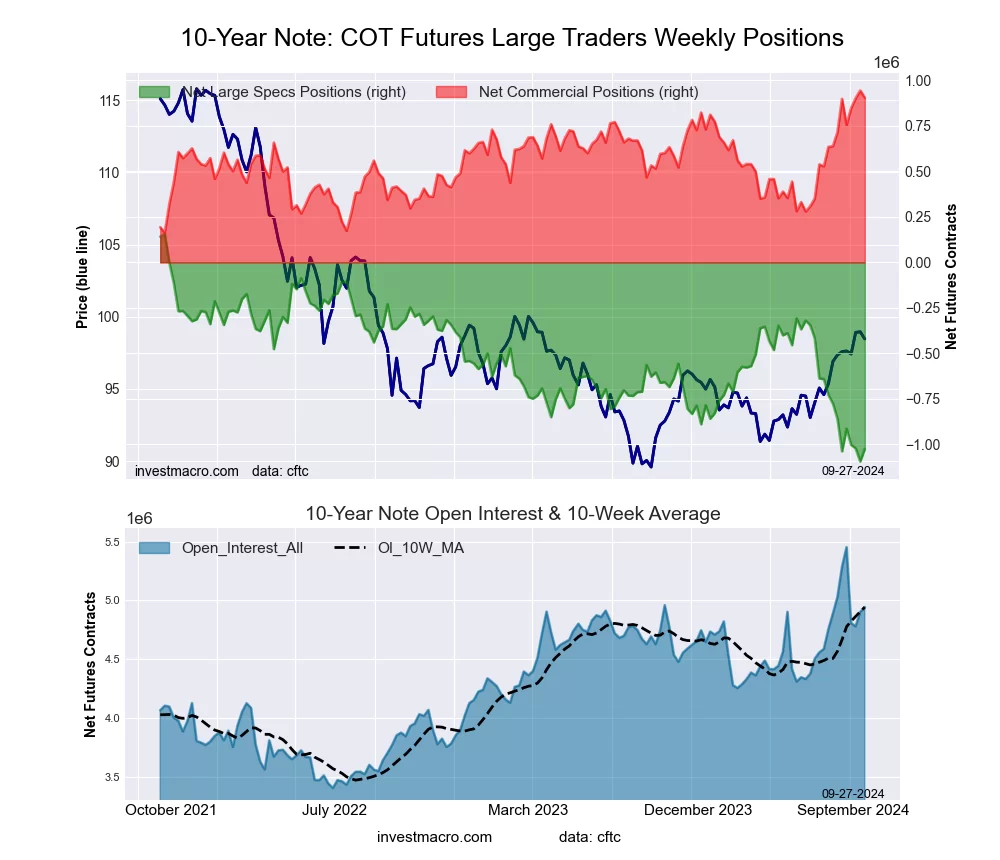 The 10-Year Treasury Note large speculator standing this week recorded a net position of -1,025,278 contracts in the data reported through Tuesday. This was a weekly increase of 68,748 contracts from the previous week which had a total of -1,094,026 net contracts.
This week’s current strength score (the trader positioning range over the past three years, measured from 0 to 100) shows the speculators are currently Bearish-Extreme with a score of 5.5 percent. The commercials are Bullish-Extreme with a score of 95.0 percent and the small traders (not shown in chart) are Bullish-Extreme with a score of 92.2 percent.
Price Trend-Following Model: Uptrend
Our weekly trend-following model classifies the current market price position as: Uptrend.
| 10-Year Treasury Note Statistics | SPECULATORS | COMMERCIALS | SMALL TRADERS |
| – Percent of Open Interest Longs: | 9.5 | 79.4 | 9.6 |
| – Percent of Open Interest Shorts: | 30.2 | 61.1 | 7.2 |
| – Net Position: | -1,025,278 | 904,645 | 120,633 |
| – Gross Longs: | 467,828 | 3,925,429 | 476,178 |
| – Gross Shorts: | 1,493,106 | 3,020,784 | 355,545 |
| – Long to Short Ratio: | 0.3 to 1 | 1.3 to 1 | 1.3 to 1 |
| NET POSITION TREND: | |||
| – Strength Index Score (3 Year Range Pct): | 5.5 | 95.0 | 92.2 |
| – Strength Index Reading (3 Year Range): | Bearish-Extreme | Bullish-Extreme | Bullish-Extreme |
| NET POSITION MOVEMENT INDEX: | |||
| – 6-Week Change in Strength Index: | -13.2 | 24.2 | -4.9 |
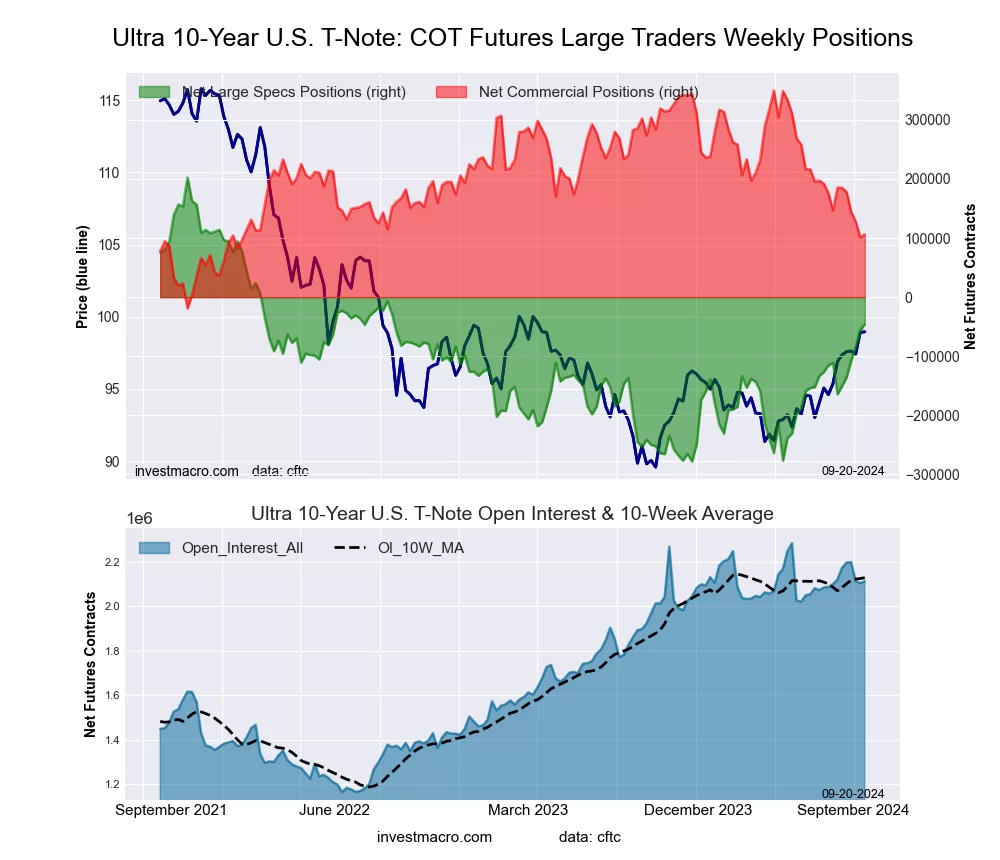
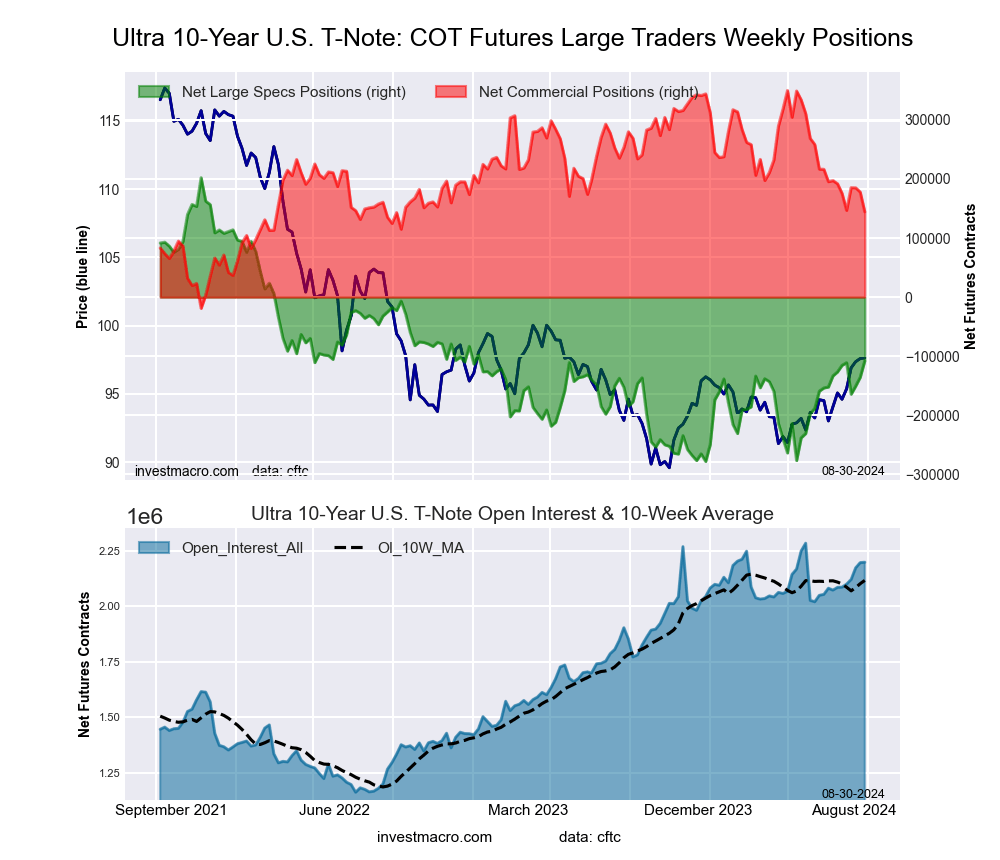
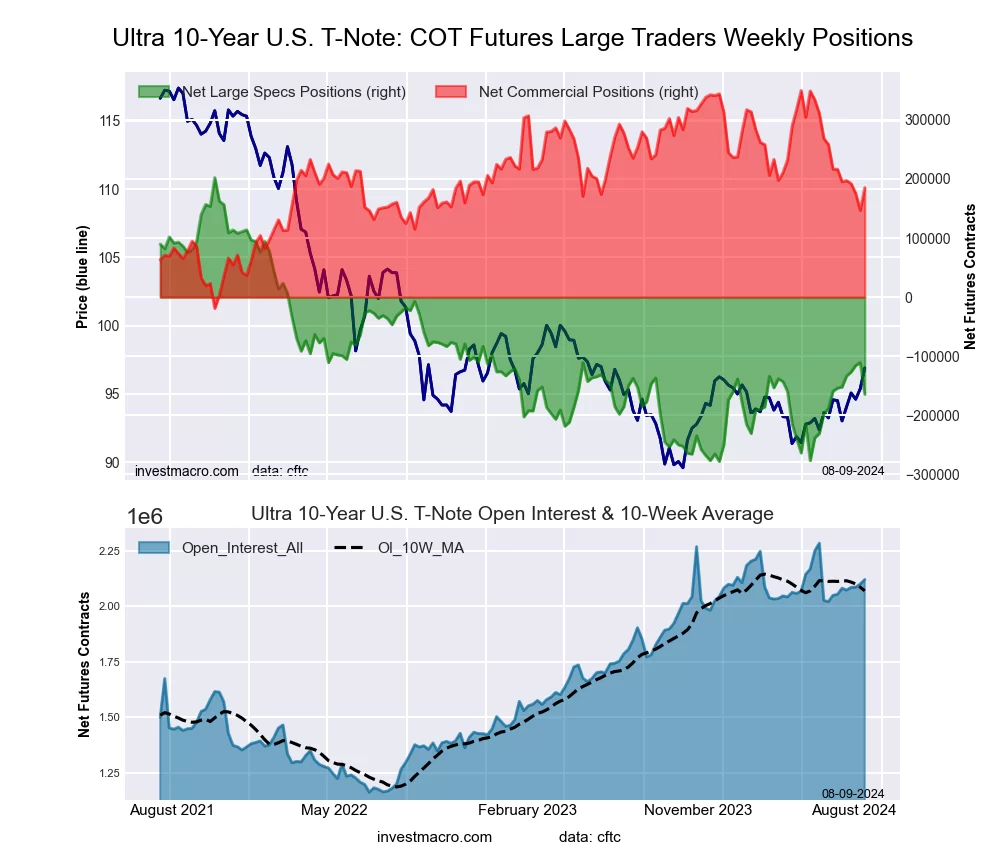
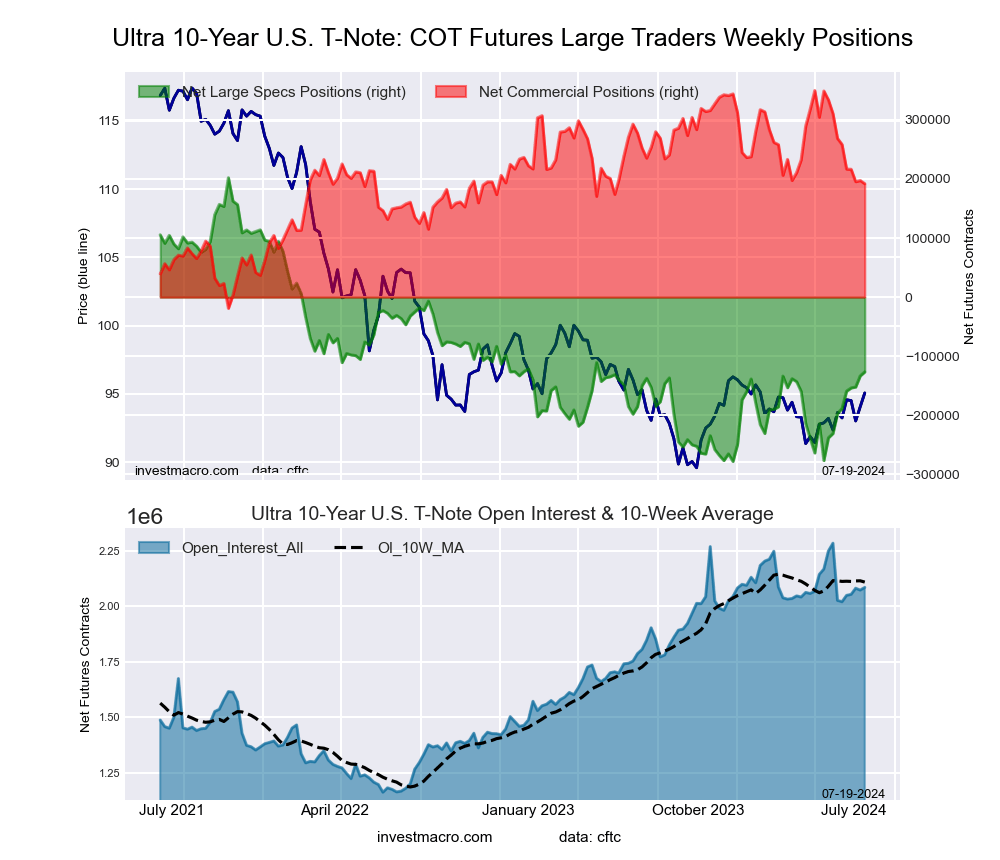
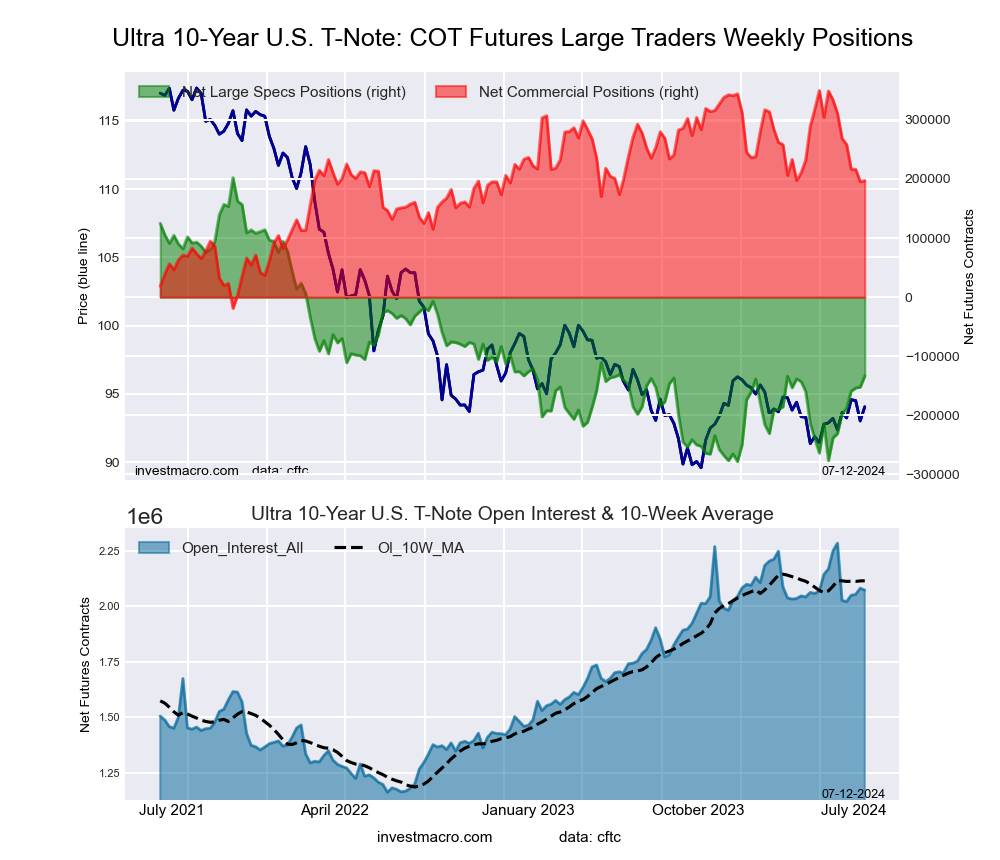
Ultra 10-Year Notes Futures:
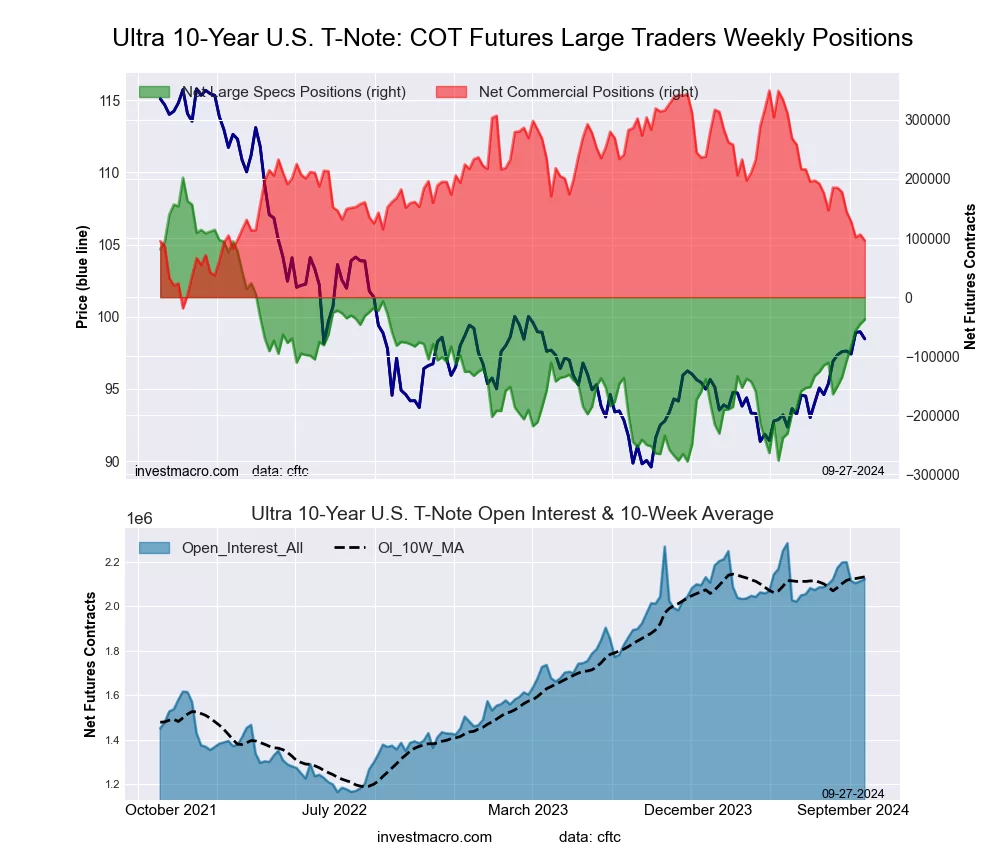 The Ultra 10-Year Notes large speculator standing this week recorded a net position of -37,679 contracts in the data reported through Tuesday. This was a weekly boost of 7,961 contracts from the previous week which had a total of -45,640 net contracts.
This week’s current strength score (the trader positioning range over the past three years, measured from 0 to 100) shows the speculators are currently Bullish with a score of 50.1 percent. The commercials are Bearish with a score of 31.1 percent and the small traders (not shown in chart) are Bullish with a score of 78.3 percent.
Price Trend-Following Model: Weak Uptrend
Our weekly trend-following model classifies the current market price position as: Weak Uptrend. The current action for the model is considered to be: Hold – Maintain Long Position.
| Ultra 10-Year Notes Statistics | SPECULATORS | COMMERCIALS | SMALL TRADERS |
| – Percent of Open Interest Longs: | 15.7 | 73.1 | 10.6 |
| – Percent of Open Interest Shorts: | 17.5 | 68.6 | 13.3 |
| – Net Position: | -37,679 | 95,760 | -58,081 |
| – Gross Longs: | 333,430 | 1,551,322 | 224,447 |
| – Gross Shorts: | 371,109 | 1,455,562 | 282,528 |
| – Long to Short Ratio: | 0.9 to 1 | 1.1 to 1 | 0.8 to 1 |
| NET POSITION TREND: | |||
| – Strength Index Score (3 Year Range Pct): | 50.1 | 31.1 | 78.3 |
| – Strength Index Reading (3 Year Range): | Bullish | Bearish | Bullish |
| NET POSITION MOVEMENT INDEX: | |||
| – 6-Week Change in Strength Index: | 23.5 | -24.2 | -13.9 |
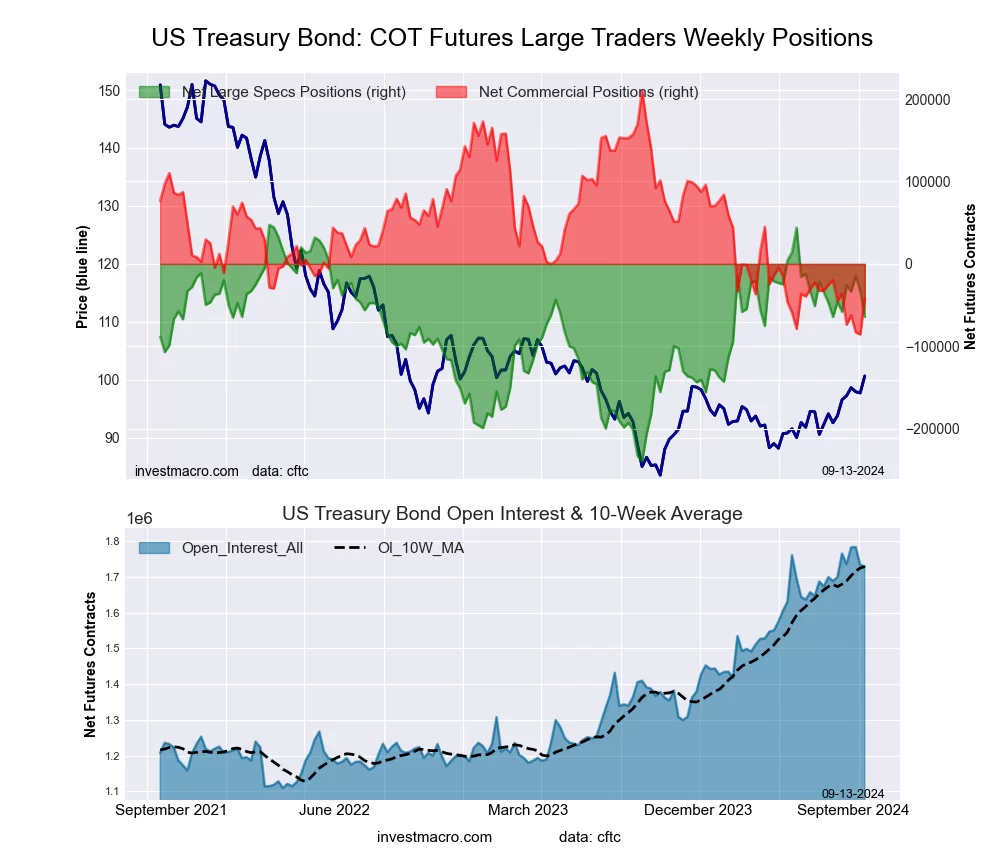
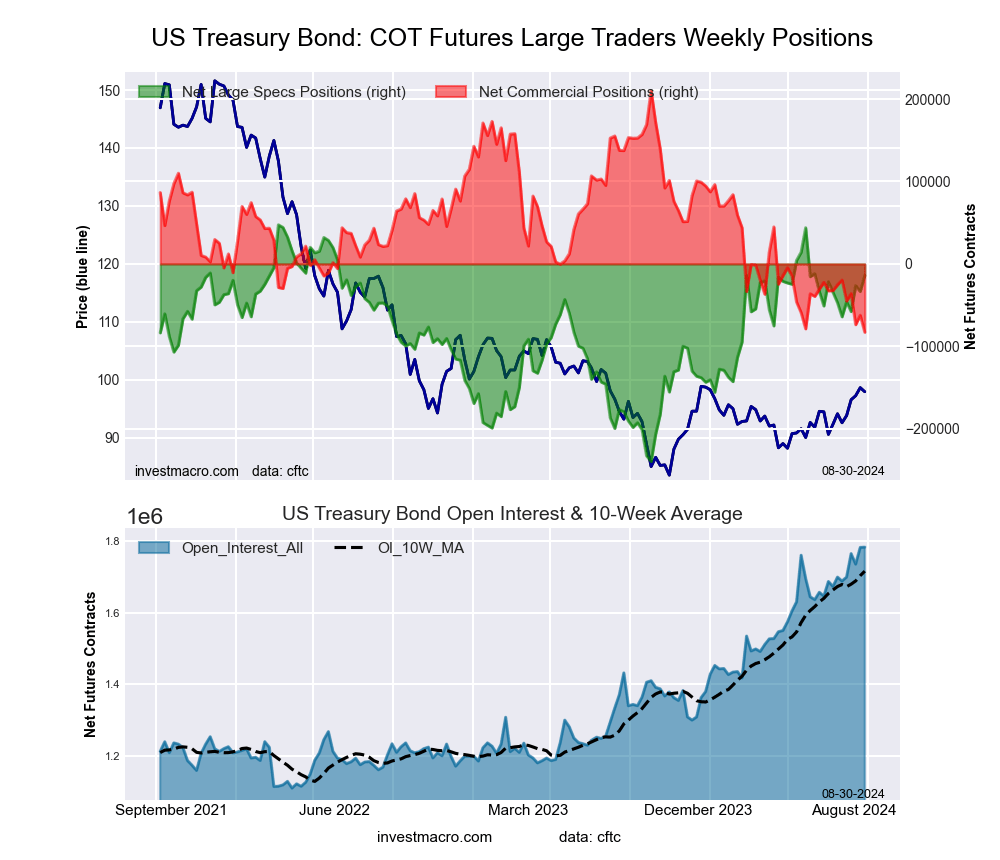
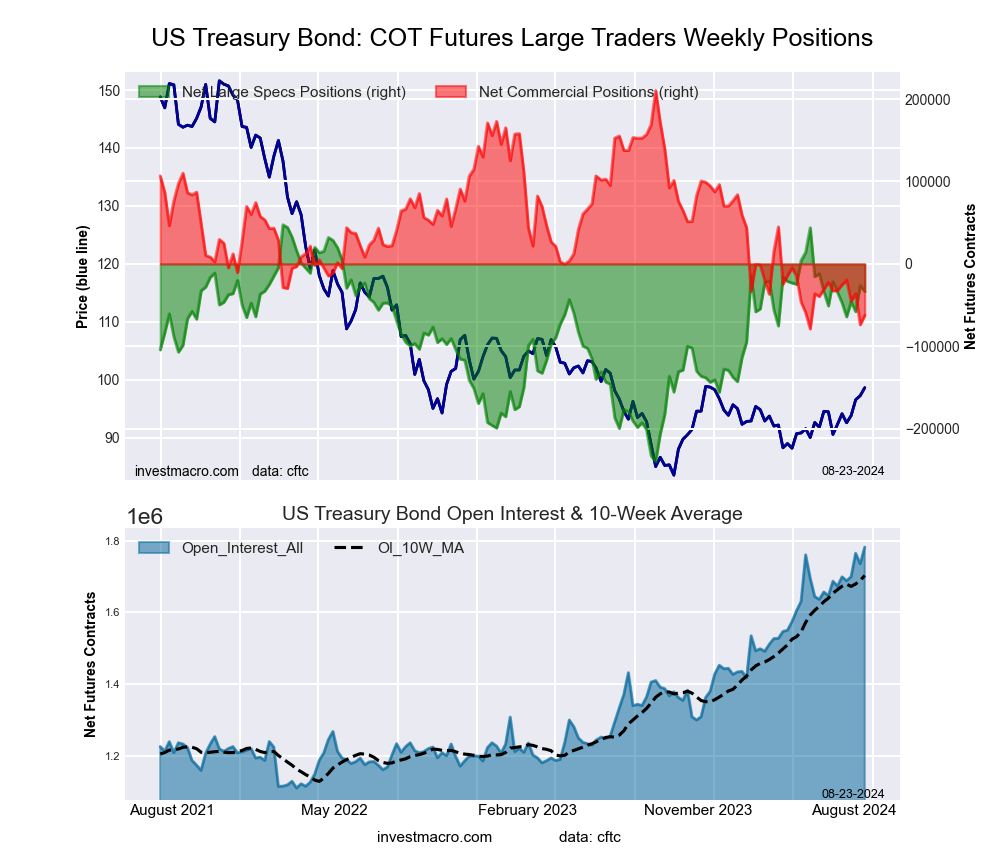
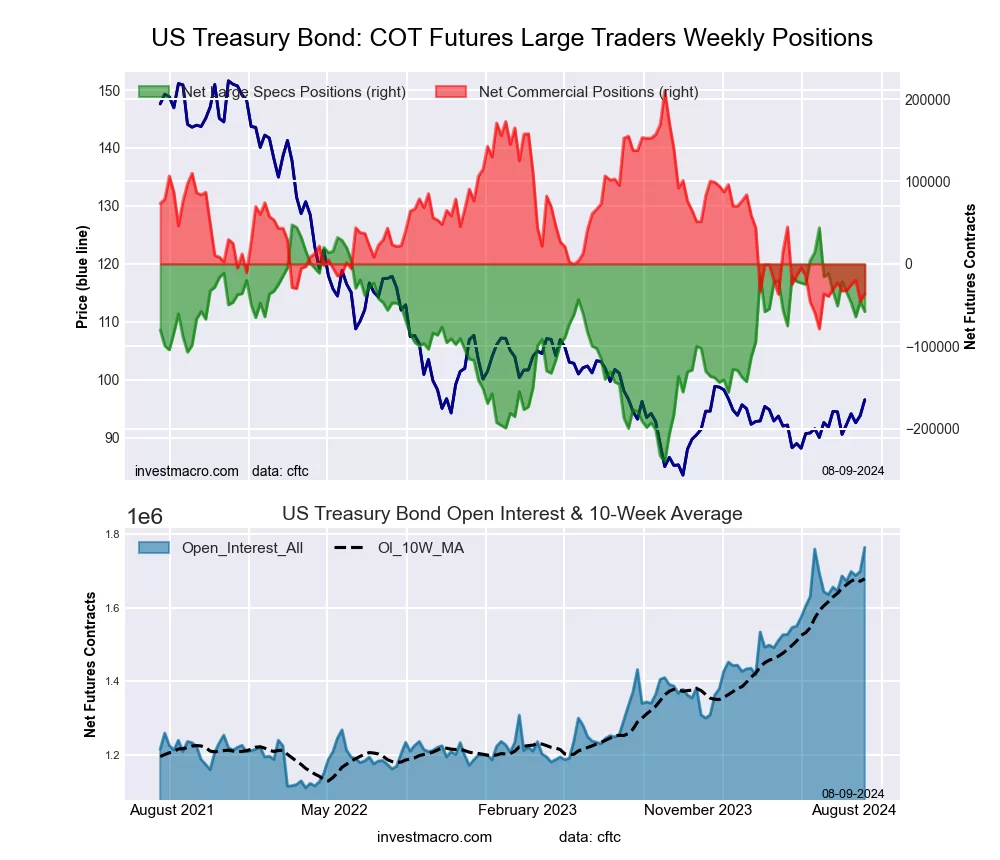
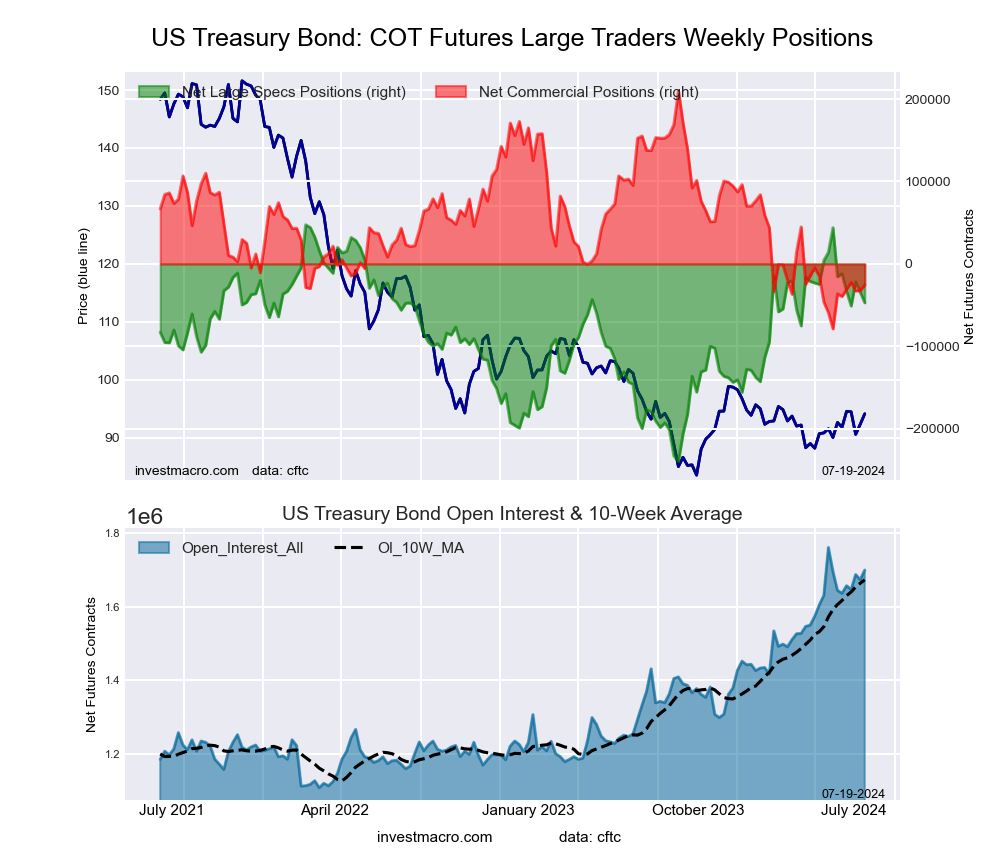
US Treasury Bonds Futures:
 The US Treasury Bonds large speculator standing this week recorded a net position of -152,582 contracts in the data reported through Tuesday. This was a weekly reduction of -42,871 contracts from the previous week which had a total of -109,711 net contracts.
This week’s current strength score (the trader positioning range over the past three years, measured from 0 to 100) shows the speculators are currently Bearish with a score of 30.3 percent. The commercials are Bearish with a score of 42.4 percent and the small traders (not shown in chart) are Bullish-Extreme with a score of 96.0 percent.
Price Trend-Following Model: Uptrend
Our weekly trend-following model classifies the current market price position as: Uptrend.
| US Treasury Bonds Statistics | SPECULATORS | COMMERCIALS | SMALL TRADERS |
| – Percent of Open Interest Longs: | 20.1 | 65.1 | 14.3 |
| – Percent of Open Interest Shorts: | 28.8 | 62.9 | 7.9 |
| – Net Position: | -152,582 | 39,846 | 112,736 |
| – Gross Longs: | 353,820 | 1,143,670 | 251,077 |
| – Gross Shorts: | 506,402 | 1,103,824 | 138,341 |
| – Long to Short Ratio: | 0.7 to 1 | 1.0 to 1 | 1.8 to 1 |
| NET POSITION TREND: | |||
| – Strength Index Score (3 Year Range Pct): | 30.3 | 42.4 | 96.0 |
| – Strength Index Reading (3 Year Range): | Bearish | Bearish | Bullish-Extreme |
| NET POSITION MOVEMENT INDEX: | |||
| – 6-Week Change in Strength Index: | -44.0 | 38.4 | 8.6 |
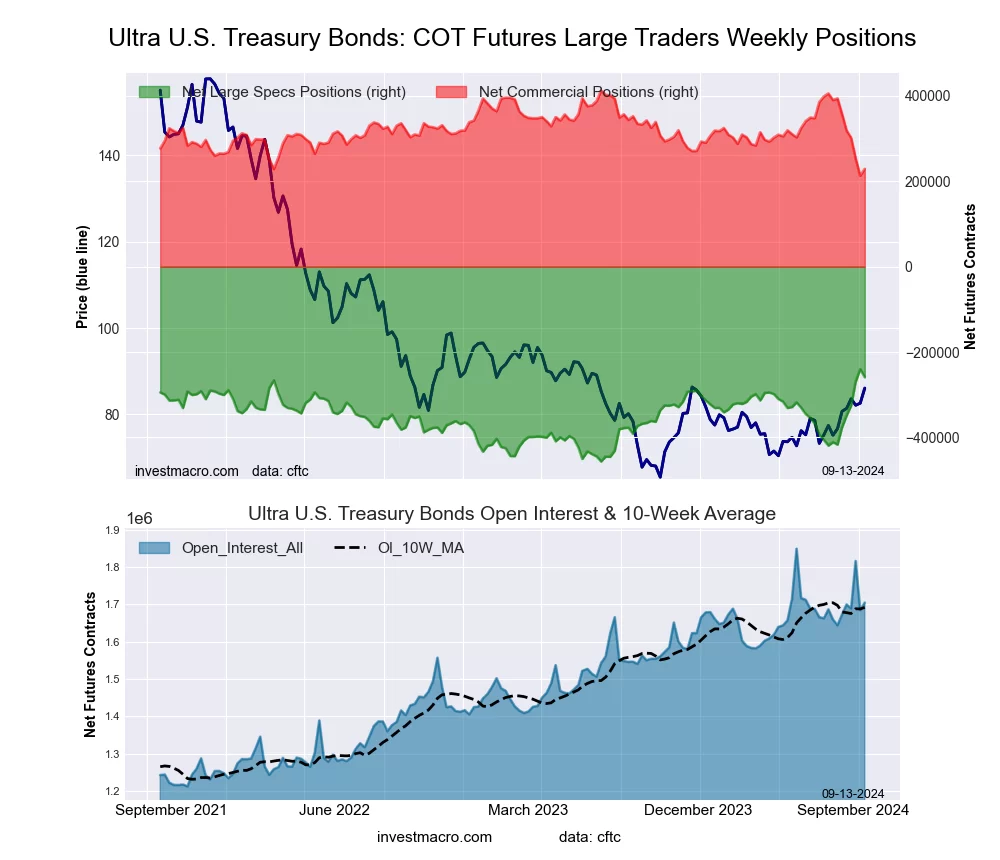
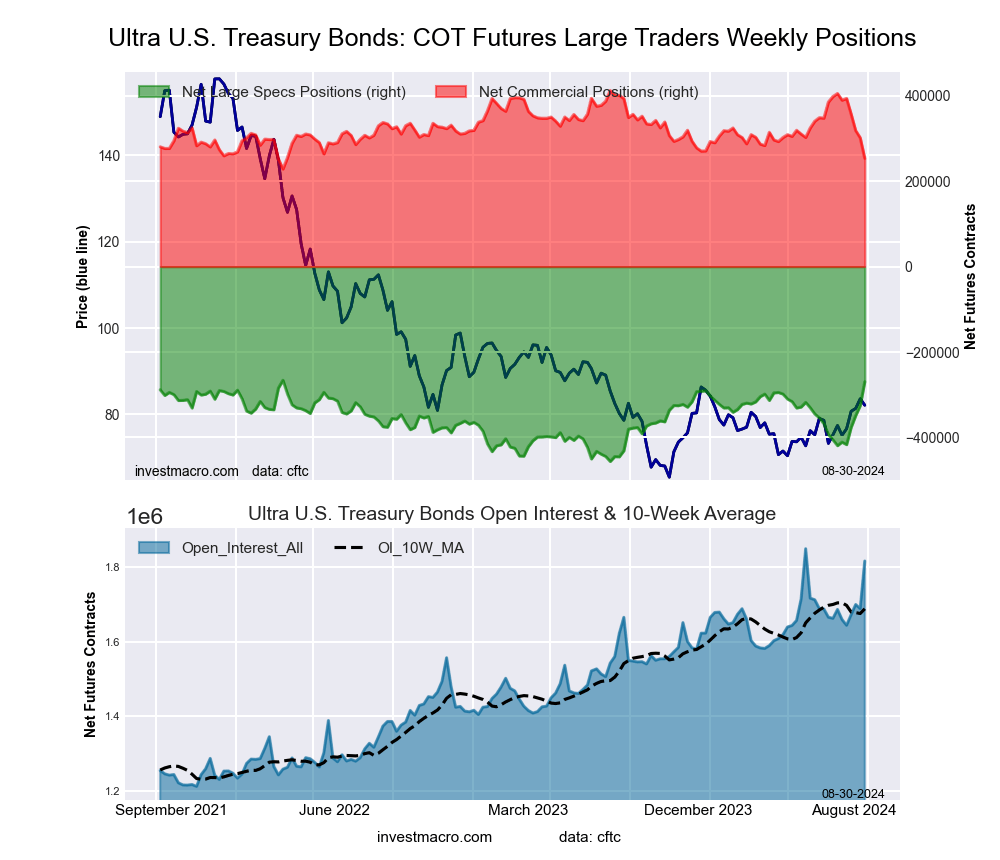
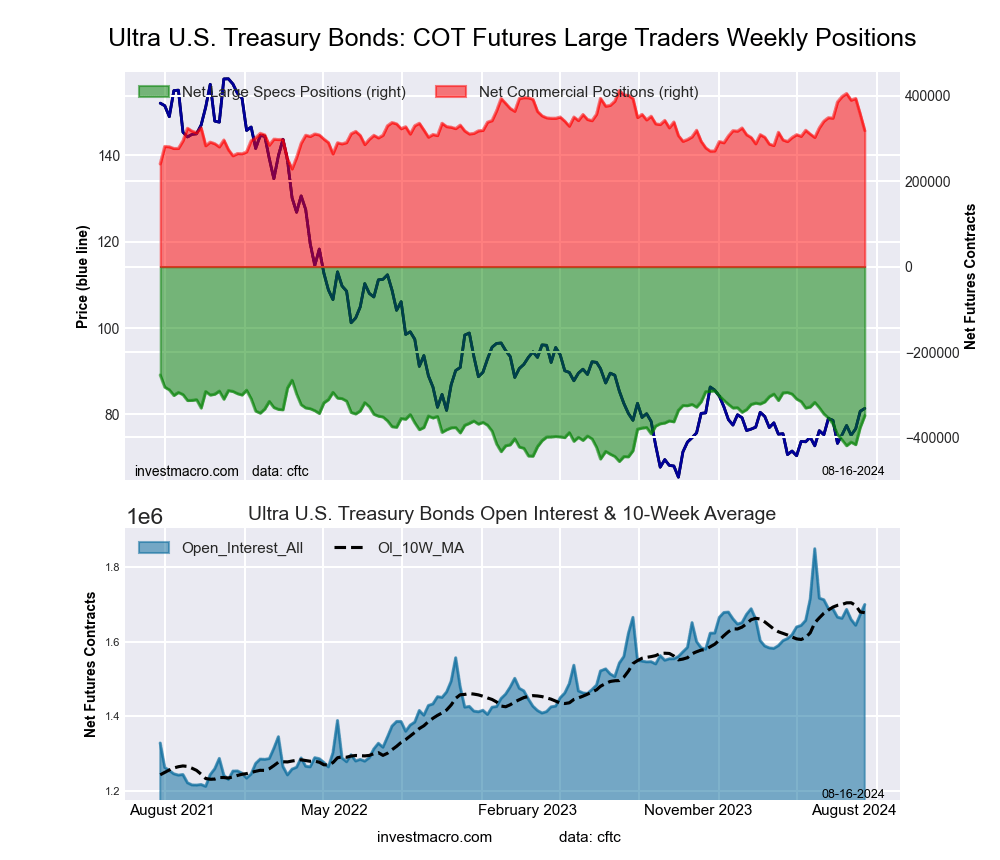
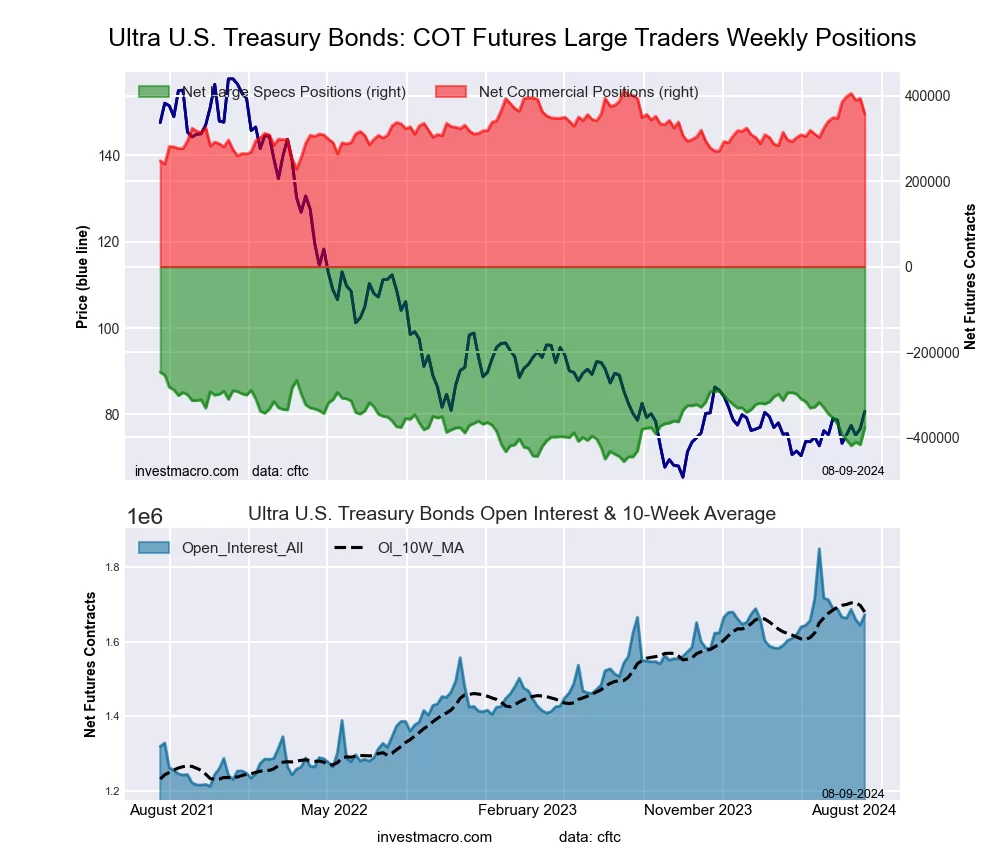
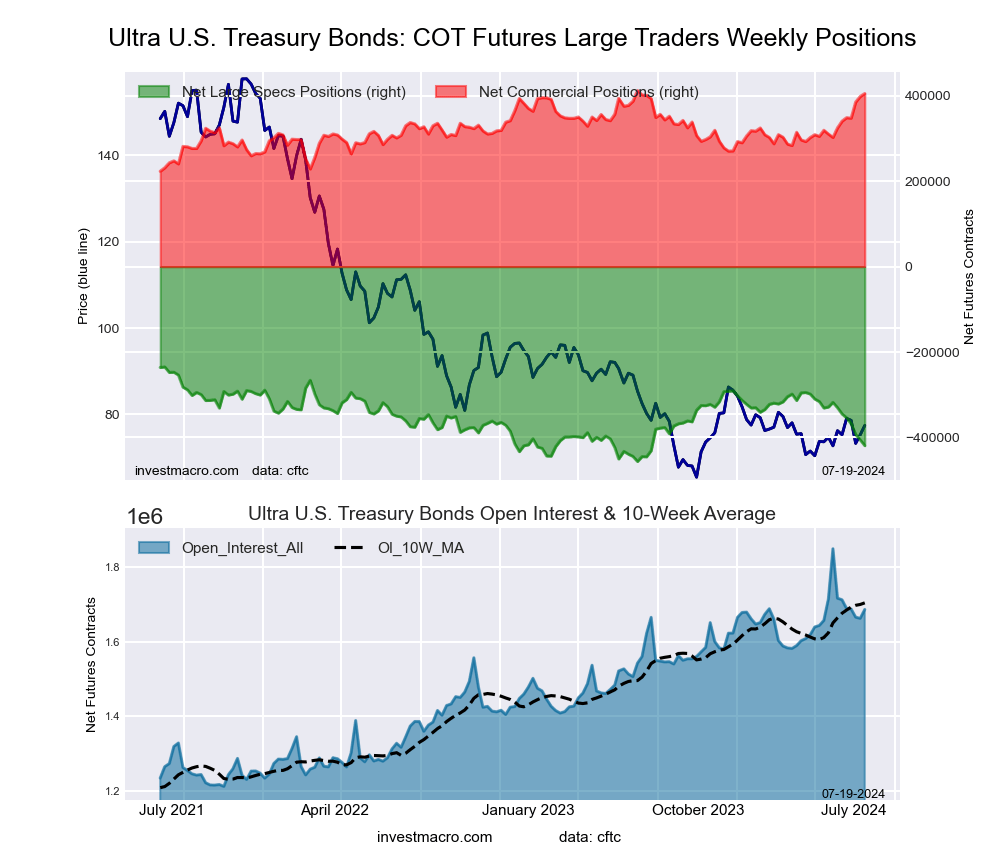
Ultra US Treasury Bonds Futures:
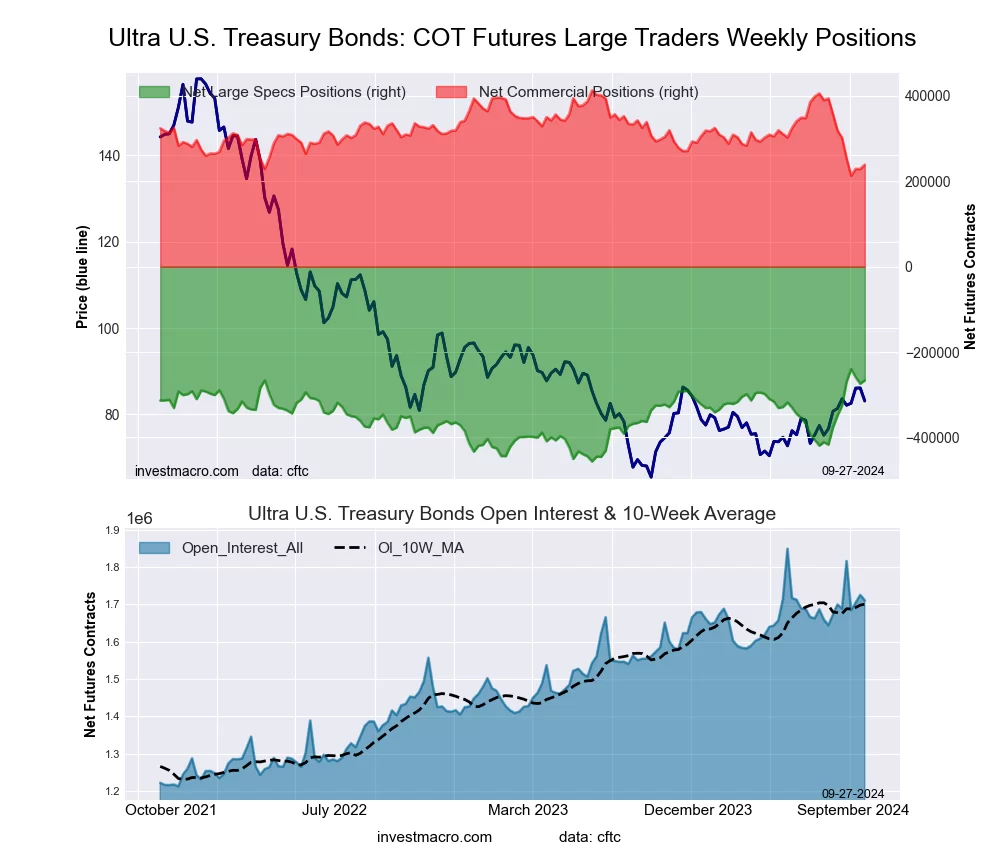 The Ultra US Treasury Bonds large speculator standing this week recorded a net position of -266,379 contracts in the data reported through Tuesday. This was a weekly advance of 7,924 contracts from the previous week which had a total of -274,303 net contracts.
This week’s current strength score (the trader positioning range over the past three years, measured from 0 to 100) shows the speculators are currently Bullish-Extreme with a score of 87.9 percent. The commercials are Bearish-Extreme with a score of 13.1 percent and the small traders (not shown in chart) are Bearish with a score of 49.3 percent.
Price Trend-Following Model: Uptrend
Our weekly trend-following model classifies the current market price position as: Uptrend.
| Ultra US Treasury Bonds Statistics | SPECULATORS | COMMERCIALS | SMALL TRADERS |
| – Percent of Open Interest Longs: | 10.4 | 78.2 | 10.9 |
| – Percent of Open Interest Shorts: | 26.0 | 64.2 | 9.3 |
| – Net Position: | -266,379 | 238,947 | 27,432 |
| – Gross Longs: | 178,425 | 1,337,926 | 186,442 |
| – Gross Shorts: | 444,804 | 1,098,979 | 159,010 |
| – Long to Short Ratio: | 0.4 to 1 | 1.2 to 1 | 1.2 to 1 |
| NET POSITION TREND: | |||
| – Strength Index Score (3 Year Range Pct): | 87.9 | 13.1 | 49.3 |
| – Strength Index Reading (3 Year Range): | Bullish-Extreme | Bearish-Extreme | Bearish |
| NET POSITION MOVEMENT INDEX: | |||
| – 6-Week Change in Strength Index: | 38.3 | -40.0 | -3.7 |
Article By InvestMacro – Receive our weekly COT Newsletter