By CountingPips.com COT Home | Data Tables | Data Downloads | Newsletter
Here are the latest charts and statistics for the Commitment of Traders (COT) data published by the Commodities Futures Trading Commission (CFTC).
The latest COT data is updated through Tuesday July 20 2021 and shows a quick view of how large traders (for-profit speculators and commercial entities) were positioned in the futures markets.
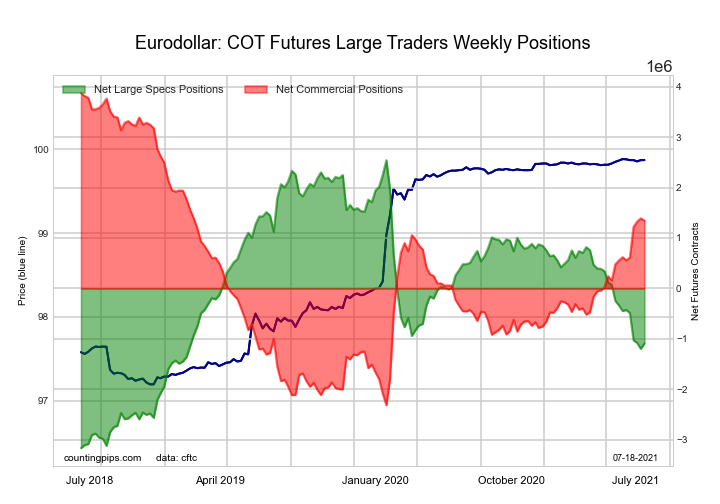
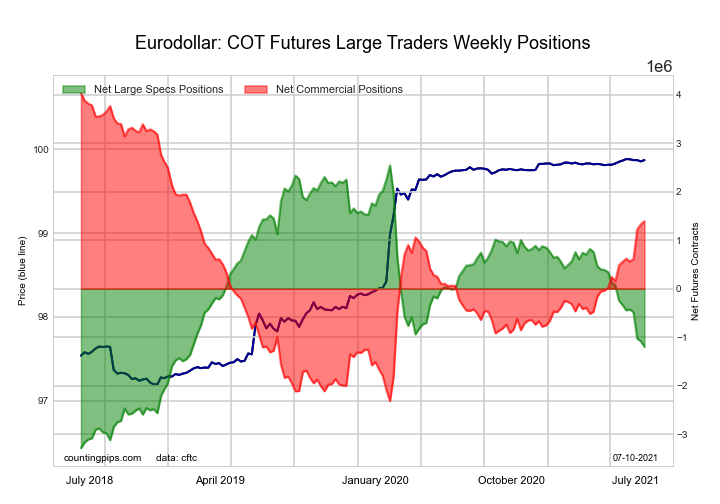
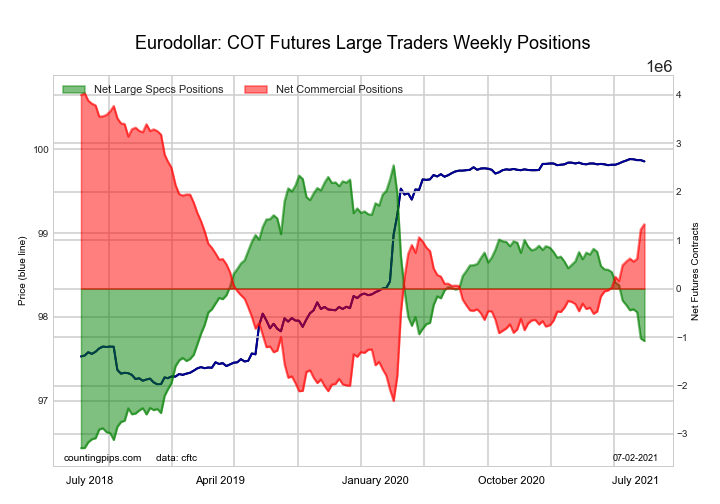
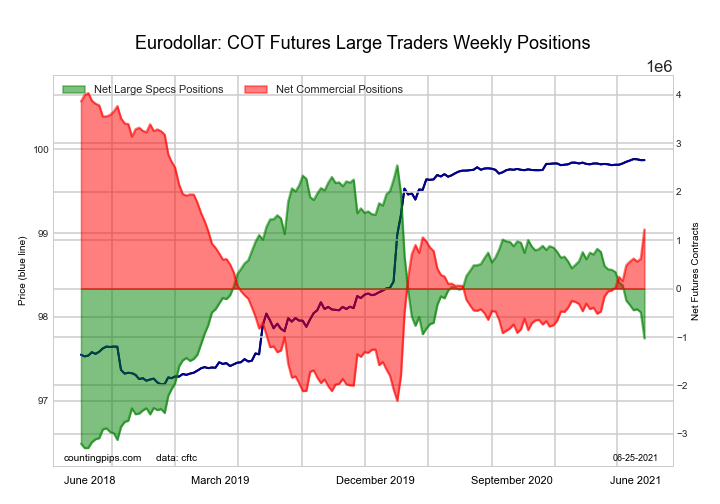
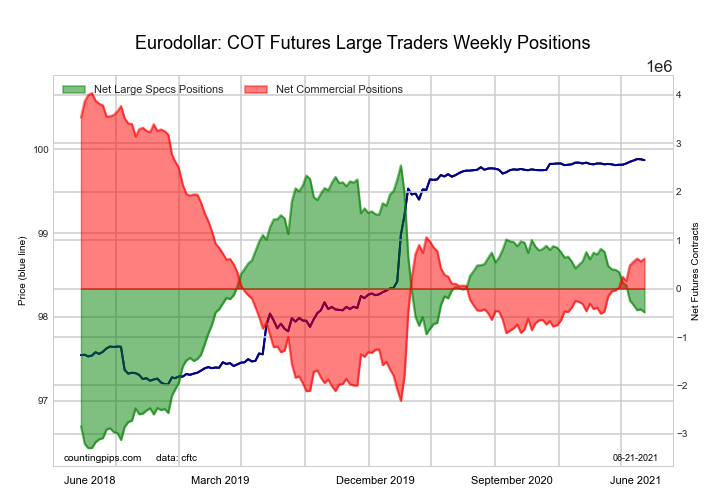
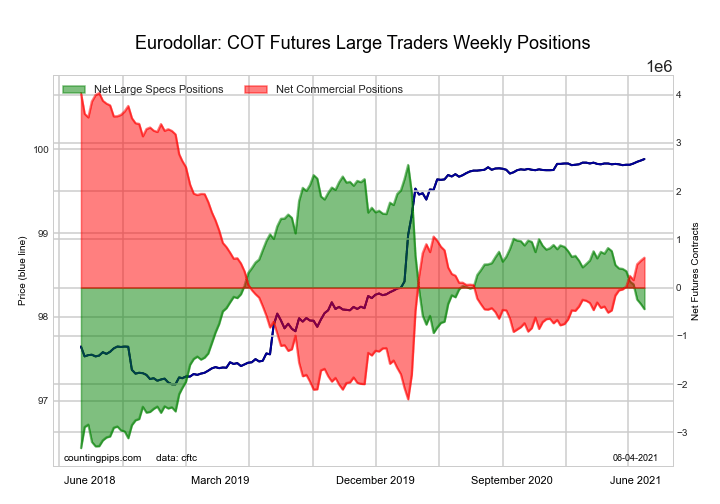
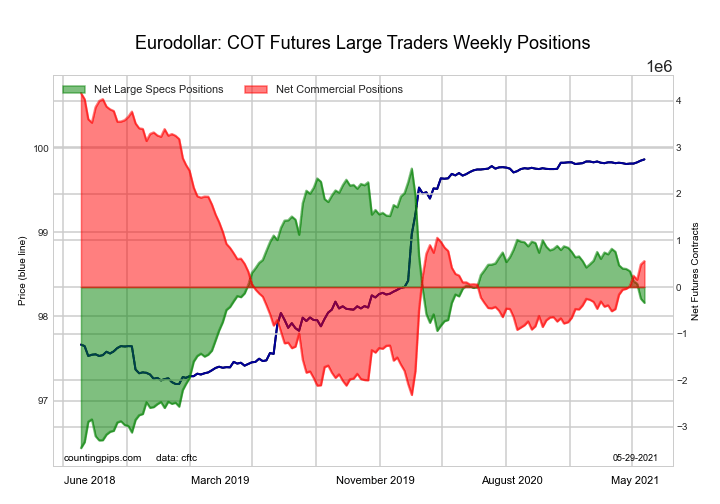
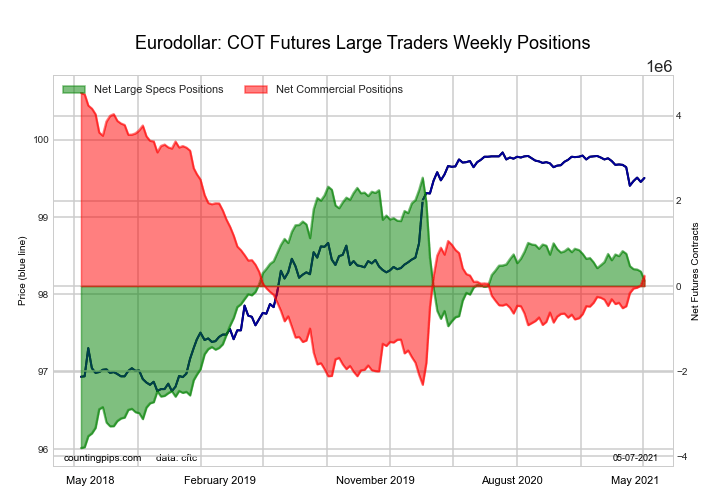
3-Month Eurodollars Futures:
 The 3-Month Eurodollars large speculator standing this week equaled a net position of -744,935 contracts in the data reported through Tuesday. This was a weekly gain of 347,265 contracts from the previous week which had a total of -1,092,200 net contracts.
This week’s current strength score (the trader positioning range over the past three years, measured from 0 to 100) shows the speculators are currently Bearish with a score of 42.0 percent. The commercials are Bullish with a score of 53.2 percent and the small traders (not shown in chart) are Bullish with a score of 76.9 percent.
| 3-Month Eurodollars Statistics | SPECULATORS | COMMERCIALS | SMALL TRADERS |
| – Percent of Open Interest Longs: | 15.3 | 59.6 | 4.9 |
| – Percent of Open Interest Shorts: | 21.6 | 51.7 | 6.6 |
| – Net Position: | -744,935 | 943,911 | -198,976 |
| – Gross Longs: | 1,824,925 | 7,096,492 | 586,975 |
| – Gross Shorts: | 2,569,860 | 6,152,581 | 785,951 |
| – Long to Short Ratio: | 0.7 to 1 | 1.2 to 1 | 0.7 to 1 |
| NET POSITION TREND: | |||
| – COT Index Score (3 Year Range Pct): | 42.0 | 53.2 | 76.9 |
| – COT Index Reading (3 Year Range): | Bearish | Bullish | Bullish |
| NET POSITION MOVEMENT INDEX: | |||
| – 6-Week Change in Strength Index: | -5.6 | 6.3 | -8.7 |
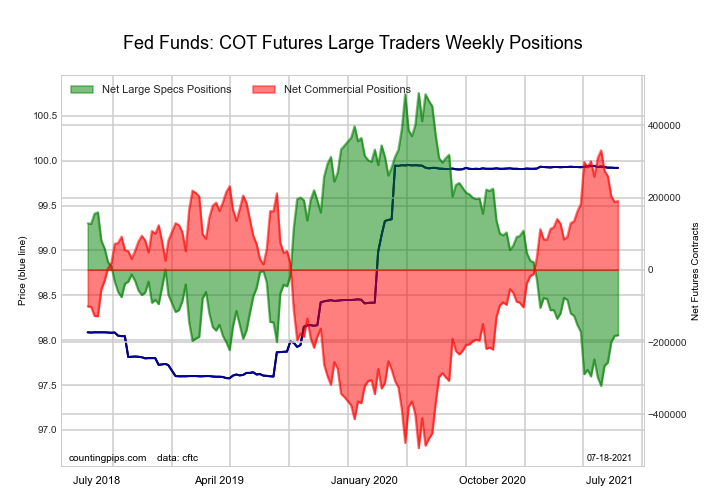
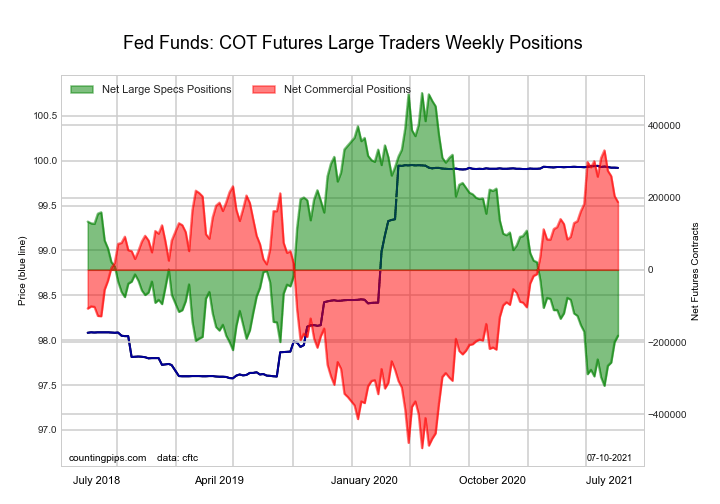
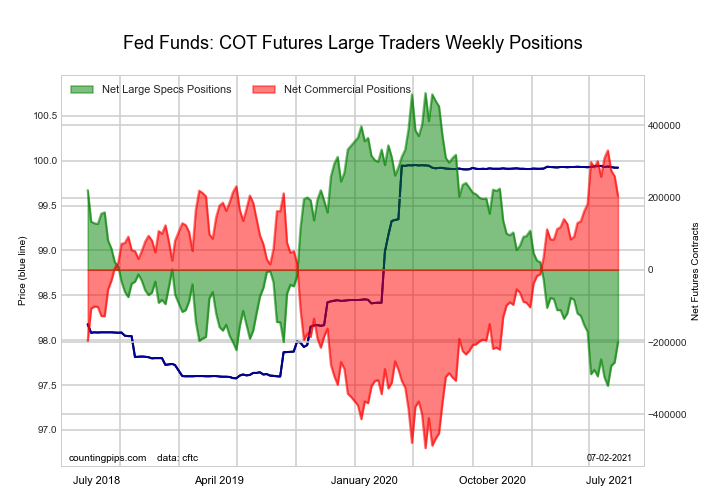
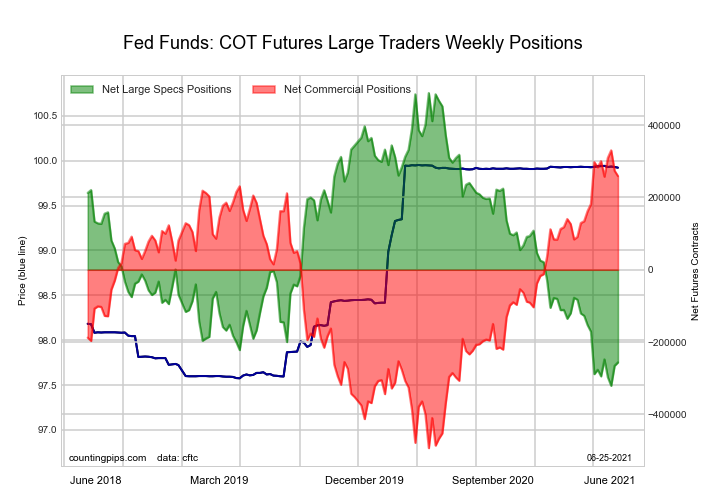
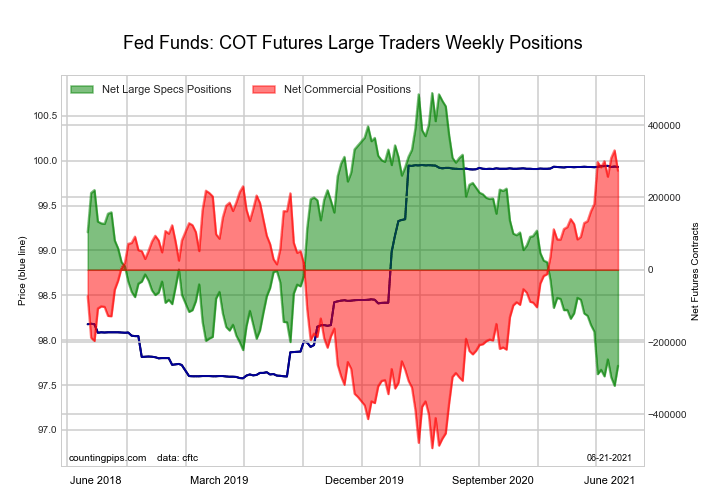
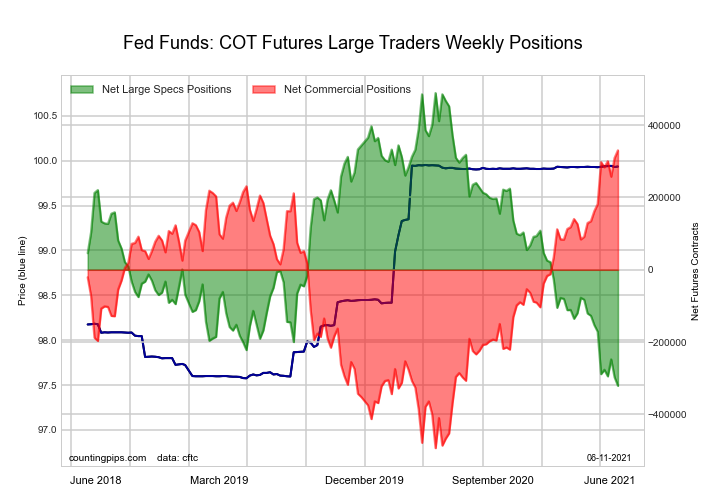
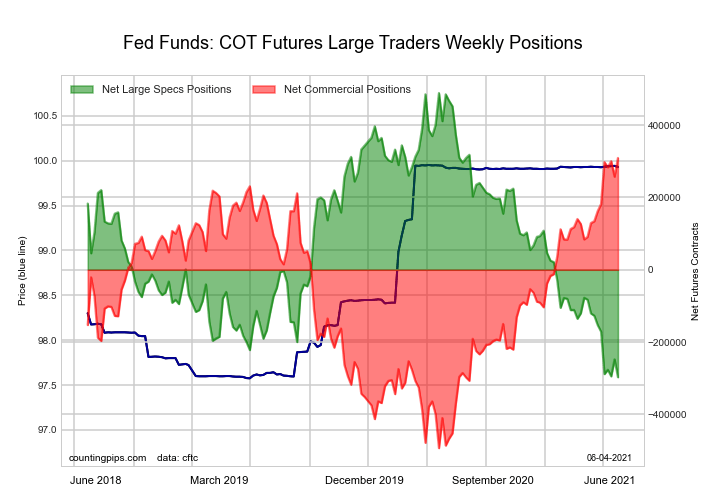
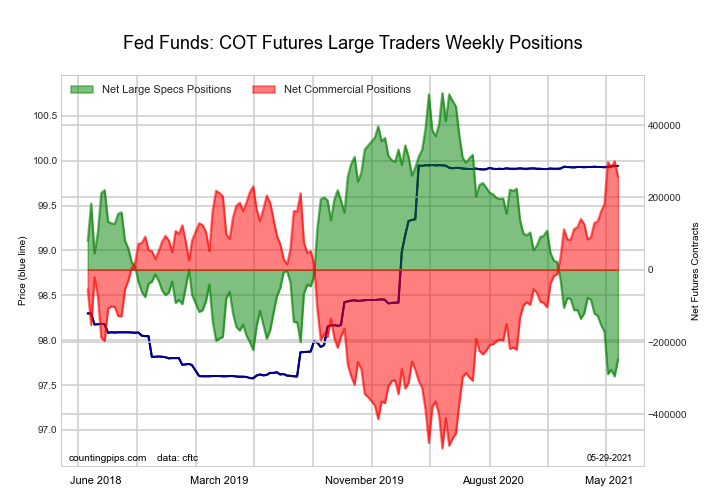
30-Day Federal Funds Futures:
 The 30-Day Federal Funds large speculator standing this week equaled a net position of -185,934 contracts in the data reported through Tuesday. This was a weekly decline of -4,942 contracts from the previous week which had a total of -180,992 net contracts.
This week’s current strength score (the trader positioning range over the past three years, measured from 0 to 100) shows the speculators are currently Bearish-Extreme with a score of 16.7 percent. The commercials are Bullish-Extreme with a score of 83.8 percent and the small traders (not shown in chart) are Bullish with a score of 51.0 percent.
| 30-Day Federal Funds Statistics | SPECULATORS | COMMERCIALS | SMALL TRADERS |
| – Percent of Open Interest Longs: | 4.5 | 75.1 | 1.9 |
| – Percent of Open Interest Shorts: | 21.3 | 57.3 | 2.9 |
| – Net Position: | -185,934 | 196,951 | -11,017 |
| – Gross Longs: | 49,351 | 829,988 | 20,586 |
| – Gross Shorts: | 235,285 | 633,037 | 31,603 |
| – Long to Short Ratio: | 0.2 to 1 | 1.3 to 1 | 0.7 to 1 |
| NET POSITION TREND: | |||
| – COT Index Score (3 Year Range Pct): | 16.7 | 83.8 | 51.0 |
| – COT Index Reading (3 Year Range): | Bearish-Extreme | Bullish-Extreme | Bullish |
| NET POSITION MOVEMENT INDEX: | |||
| – 6-Week Change in Strength Index: | 16.7 | -16.2 | -2.6 |
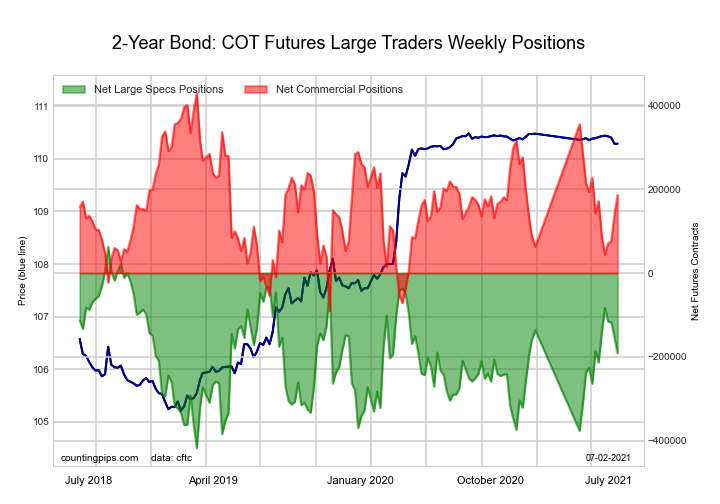
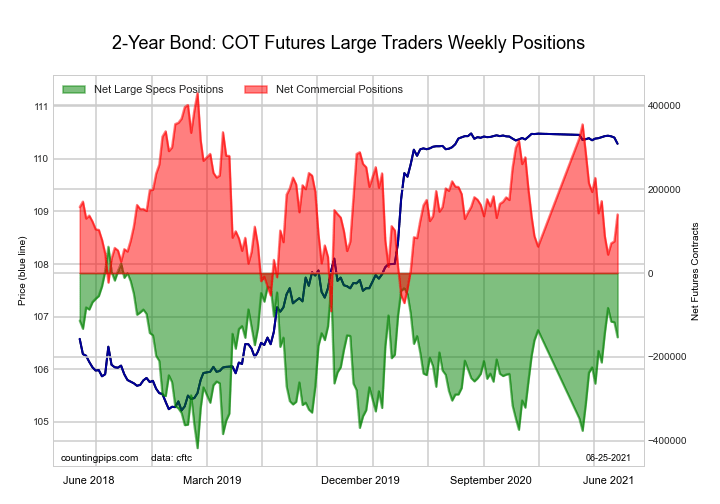
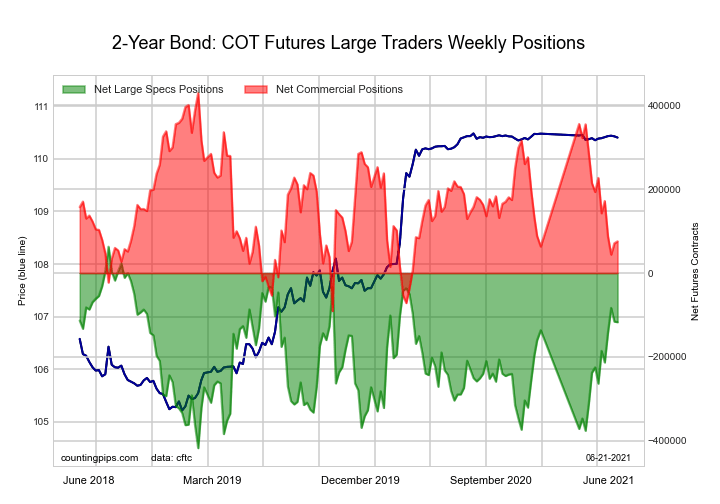
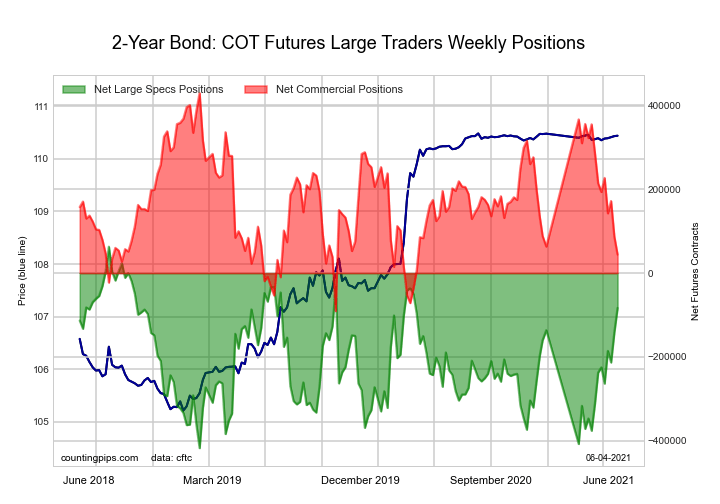
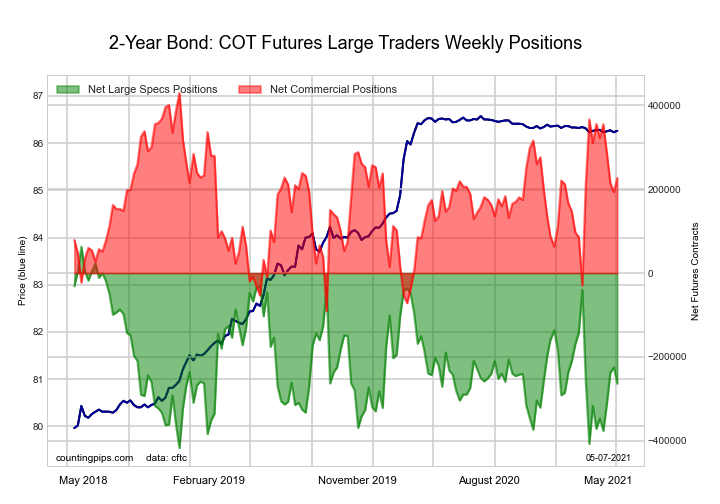
2-Year Treasury Note Futures:
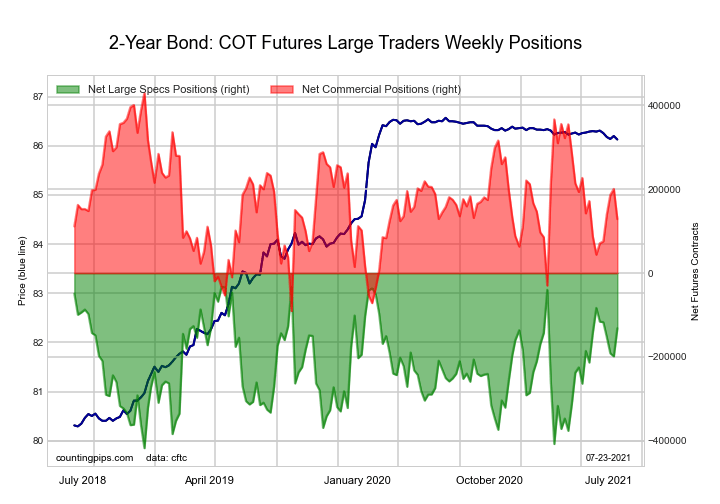 The 2-Year Treasury Note large speculator standing this week equaled a net position of -58,083 contracts in the data reported through Tuesday. This was a weekly advance of 73,357 contracts from the previous week which had a total of -131,440 net contracts.
This week’s current strength score (the trader positioning range over the past three years, measured from 0 to 100) shows the speculators are currently Bullish-Extreme with a score of 93.4 percent. The commercials are Bearish with a score of 26.4 percent and the small traders (not shown in chart) are Bearish with a score of 40.8 percent.
| 2-Year Treasury Note Statistics | SPECULATORS | COMMERCIALS | SMALL TRADERS |
| – Percent of Open Interest Longs: | 19.8 | 70.7 | 7.2 |
| – Percent of Open Interest Shorts: | 22.7 | 68.4 | 6.6 |
| – Net Position: | -58,083 | 46,804 | 11,279 |
| – Gross Longs: | 398,045 | 1,423,229 | 144,401 |
| – Gross Shorts: | 456,128 | 1,376,425 | 133,122 |
| – Long to Short Ratio: | 0.9 to 1 | 1.0 to 1 | 1.1 to 1 |
| NET POSITION TREND: | |||
| – COT Index Score (3 Year Range Pct): | 93.4 | 26.4 | 40.8 |
| – COT Index Reading (3 Year Range): | Bullish-Extreme | Bearish | Bearish |
| NET POSITION MOVEMENT INDEX: | |||
| – 6-Week Change in Strength Index: | 14.9 | -4.7 | -17.5 |
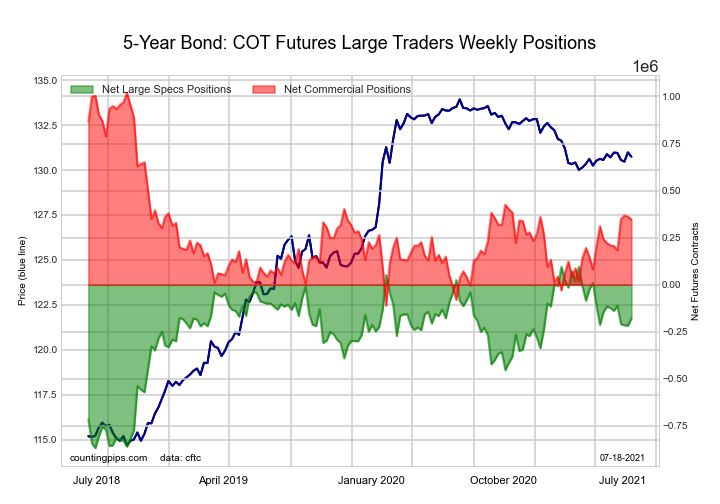
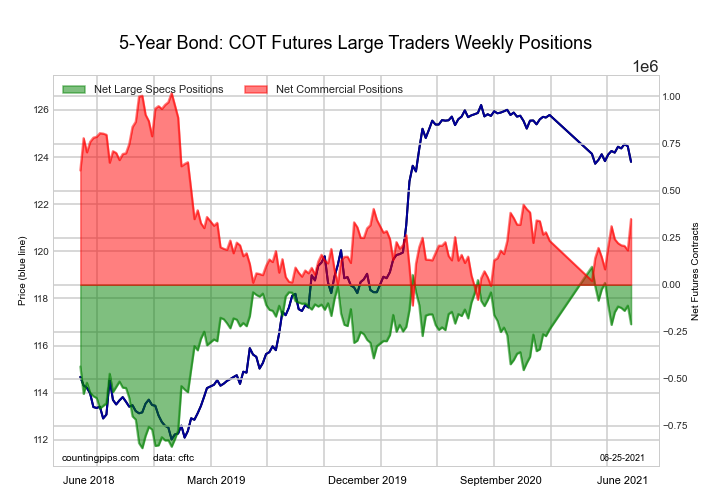
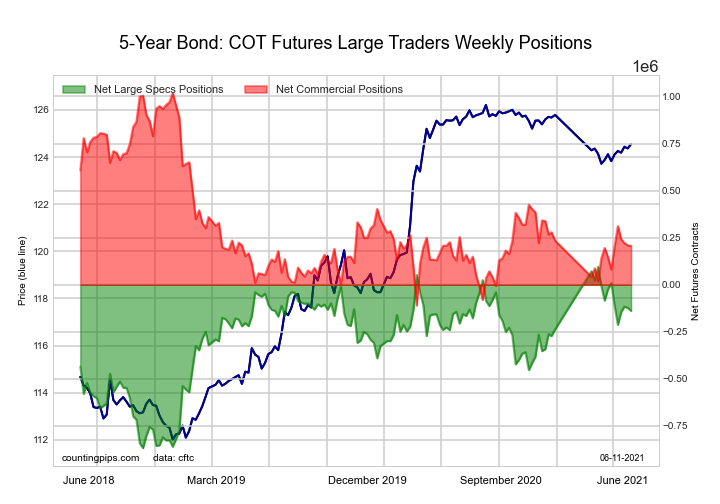
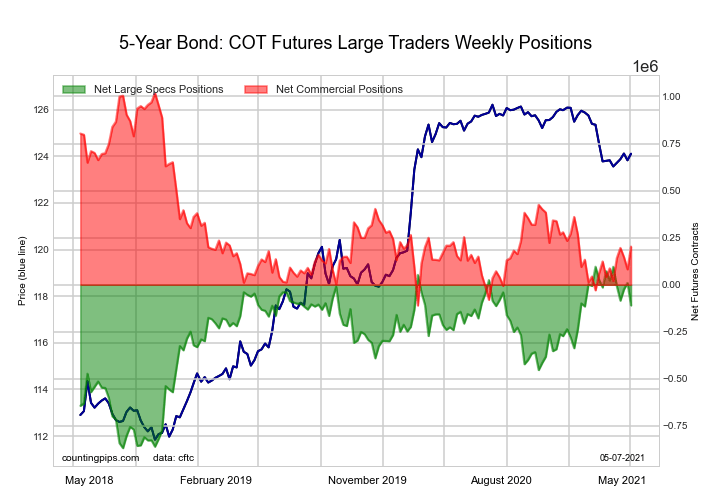
5-Year Treasury Note Futures:
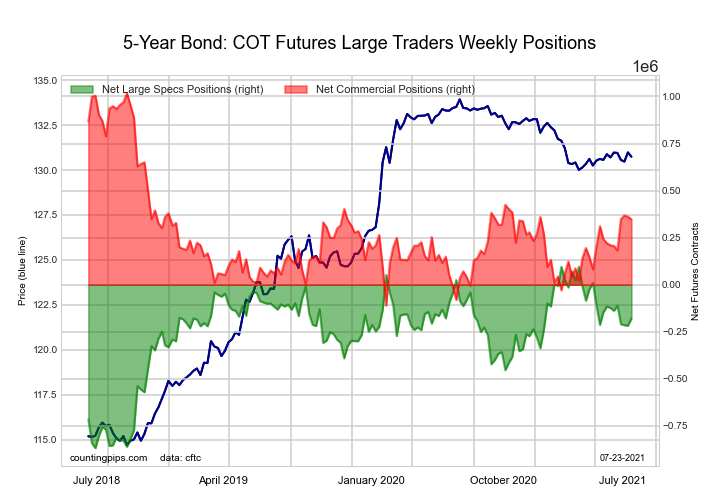 The 5-Year Treasury Note large speculator standing this week equaled a net position of -69,034 contracts in the data reported through Tuesday. This was a weekly boost of 109,042 contracts from the previous week which had a total of -178,076 net contracts.
This week’s current strength score (the trader positioning range over the past three years, measured from 0 to 100) shows the speculators are currently Bullish-Extreme with a score of 82.9 percent. The commercials are Bearish with a score of 30.2 percent and the small traders (not shown in chart) are Bearish-Extreme with a score of 2.8 percent.
| 5-Year Treasury Note Statistics | SPECULATORS | COMMERCIALS | SMALL TRADERS |
| – Percent of Open Interest Longs: | 13.3 | 76.6 | 8.3 |
| – Percent of Open Interest Shorts: | 15.3 | 69.9 | 12.9 |
| – Net Position: | -69,034 | 231,174 | -162,140 |
| – Gross Longs: | 461,339 | 2,661,235 | 287,503 |
| – Gross Shorts: | 530,373 | 2,430,061 | 449,643 |
| – Long to Short Ratio: | 0.9 to 1 | 1.1 to 1 | 0.6 to 1 |
| NET POSITION TREND: | |||
| – COT Index Score (3 Year Range Pct): | 82.9 | 30.2 | 2.8 |
| – COT Index Reading (3 Year Range): | Bullish-Extreme | Bearish | Bearish-Extreme |
| NET POSITION MOVEMENT INDEX: | |||
| – 6-Week Change in Strength Index: | 7.2 | 2.2 | -39.5 |
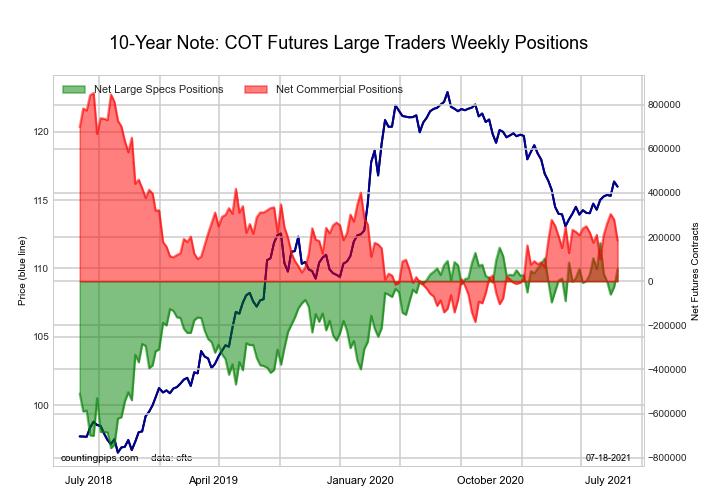
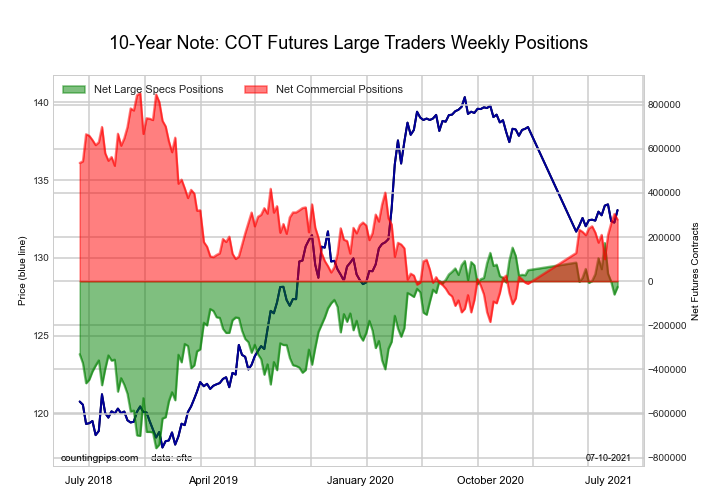
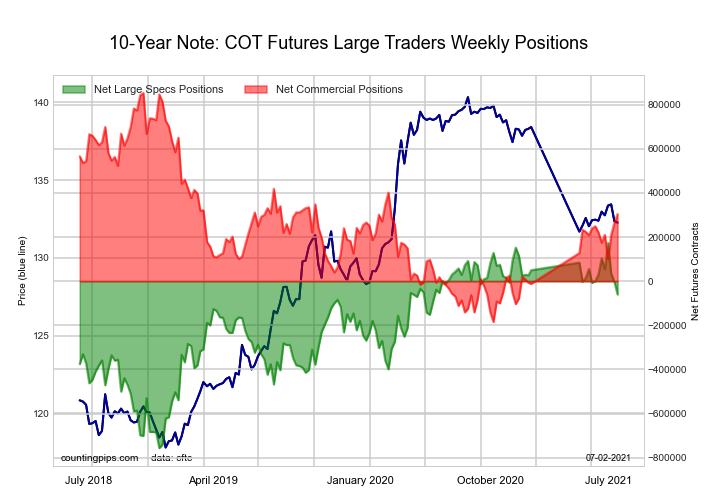
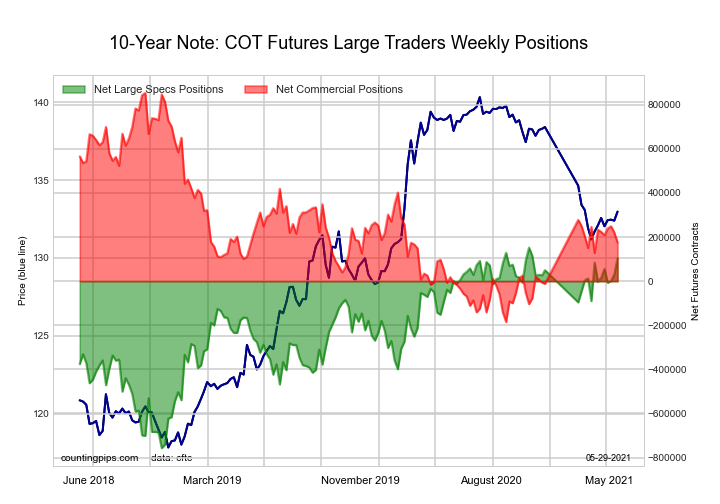
10-Year Treasury Note Futures:
 The 10-Year Treasury Note large speculator standing this week equaled a net position of 88,926 contracts in the data reported through Tuesday. This was a weekly increase of 32,939 contracts from the previous week which had a total of 55,987 net contracts.
This week’s current strength score (the trader positioning range over the past three years, measured from 0 to 100) shows the speculators are currently Bullish-Extreme with a score of 90.9 percent. The commercials are Bearish with a score of 33.7 percent and the small traders (not shown in chart) are Bearish-Extreme with a score of 6.9 percent.
| 10-Year Treasury Note Statistics | SPECULATORS | COMMERCIALS | SMALL TRADERS |
| – Percent of Open Interest Longs: | 23.2 | 67.0 | 8.0 |
| – Percent of Open Interest Shorts: | 21.0 | 63.0 | 14.1 |
| – Net Position: | 88,926 | 164,936 | -253,862 |
| – Gross Longs: | 962,134 | 2,779,195 | 332,995 |
| – Gross Shorts: | 873,208 | 2,614,259 | 586,857 |
| – Long to Short Ratio: | 1.1 to 1 | 1.1 to 1 | 0.6 to 1 |
| NET POSITION TREND: | |||
| – COT Index Score (3 Year Range Pct): | 90.9 | 33.7 | 6.9 |
| – COT Index Reading (3 Year Range): | Bullish-Extreme | Bearish | Bearish-Extreme |
| NET POSITION MOVEMENT INDEX: | |||
| – 6-Week Change in Strength Index: | -9.1 | 6.2 | 5.3 |
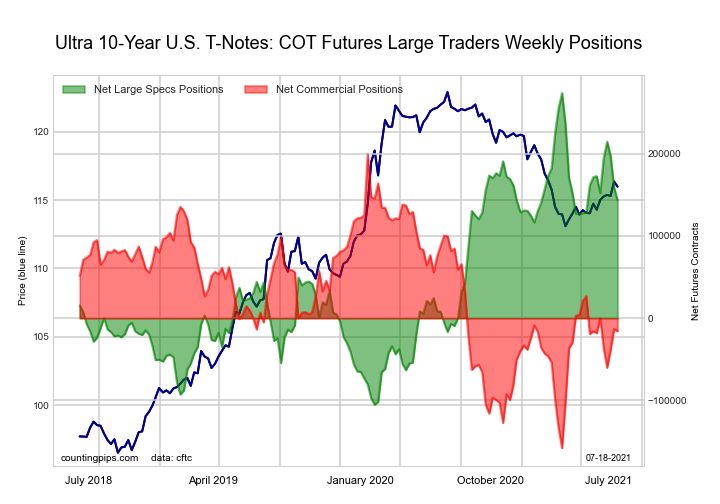
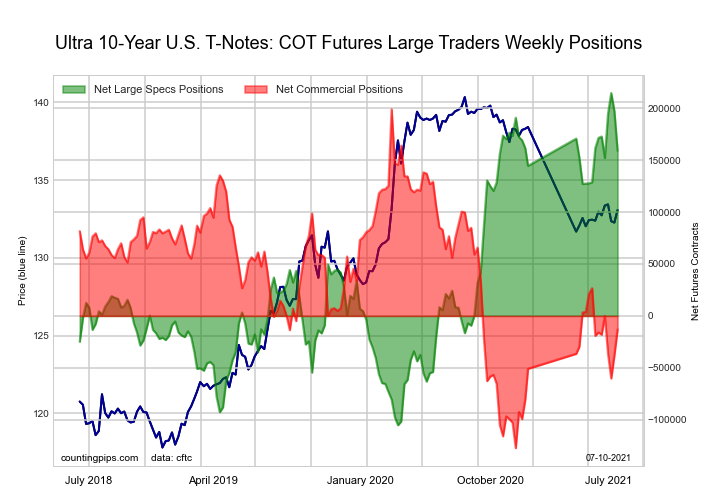
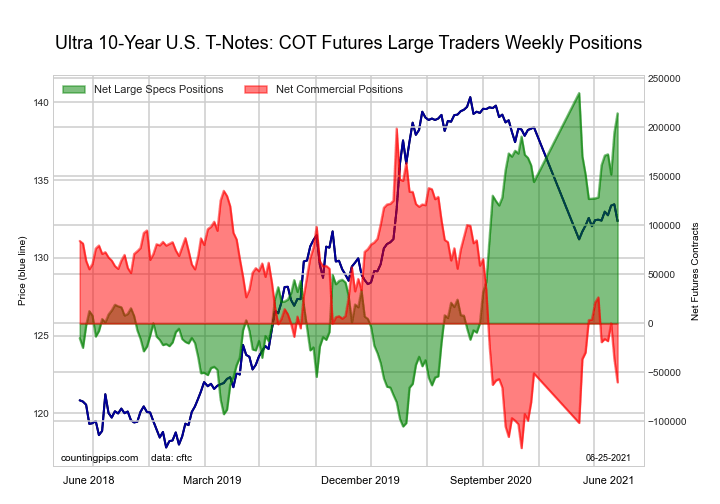
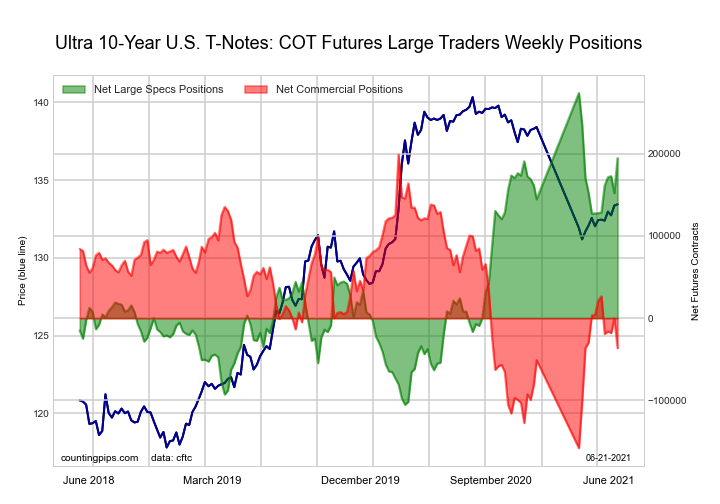
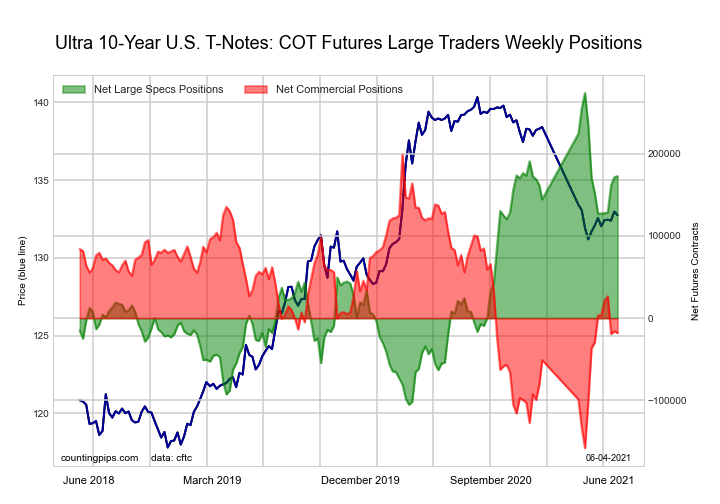
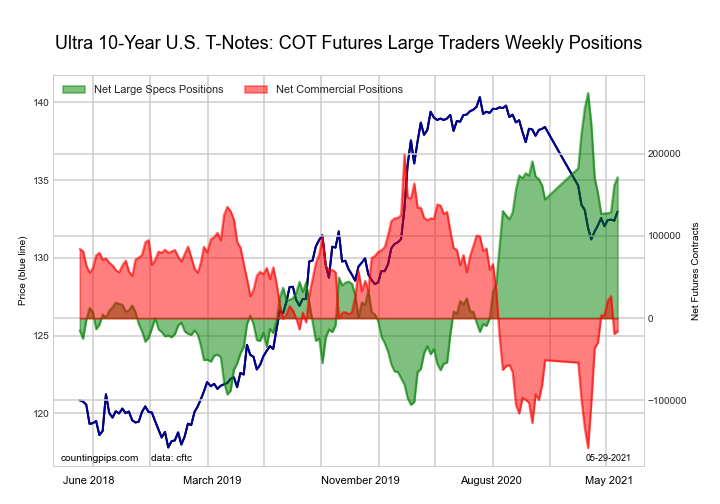
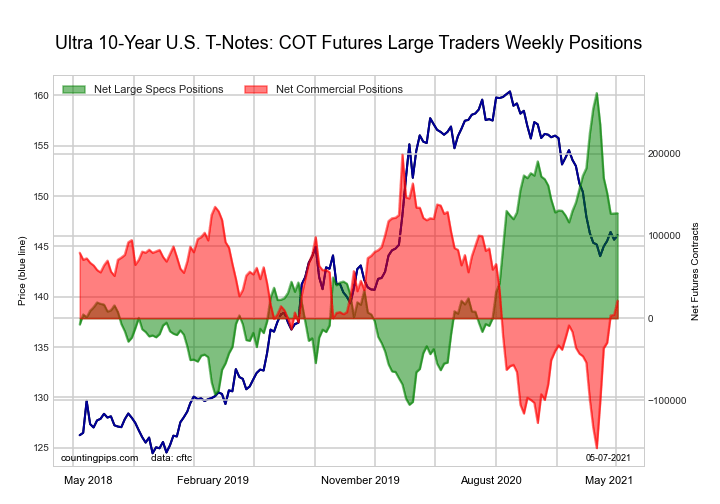
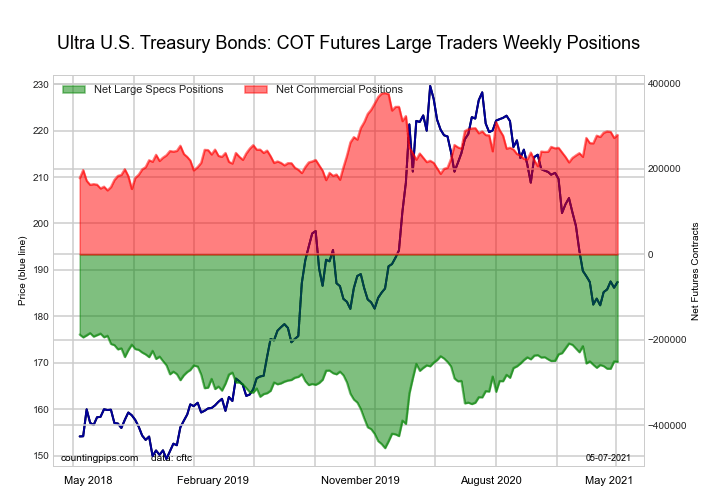
Ultra 10-Year Notes Futures:
 The Ultra 10-Year Notes large speculator standing this week equaled a net position of 124,814 contracts in the data reported through Tuesday. This was a weekly fall of -18,282 contracts from the previous week which had a total of 143,096 net contracts.
This week’s current strength score (the trader positioning range over the past three years, measured from 0 to 100) shows the speculators are currently Bullish with a score of 60.7 percent. The commercials are Bearish with a score of 49.4 percent and the small traders (not shown in chart) are Bearish-Extreme with a score of 11.8 percent.
| Ultra 10-Year Notes Statistics | SPECULATORS | COMMERCIALS | SMALL TRADERS |
| – Percent of Open Interest Longs: | 15.5 | 76.0 | 8.3 |
| – Percent of Open Interest Shorts: | 7.2 | 74.8 | 17.8 |
| – Net Position: | 124,814 | 18,412 | -143,226 |
| – Gross Longs: | 233,116 | 1,145,047 | 124,342 |
| – Gross Shorts: | 108,302 | 1,126,635 | 267,568 |
| – Long to Short Ratio: | 2.2 to 1 | 1.0 to 1 | 0.5 to 1 |
| NET POSITION TREND: | |||
| – COT Index Score (3 Year Range Pct): | 60.7 | 49.4 | 11.8 |
| – COT Index Reading (3 Year Range): | Bullish | Bearish | Bearish-Extreme |
| NET POSITION MOVEMENT INDEX: | |||
| – 6-Week Change in Strength Index: | -7.2 | 5.2 | 6.6 |
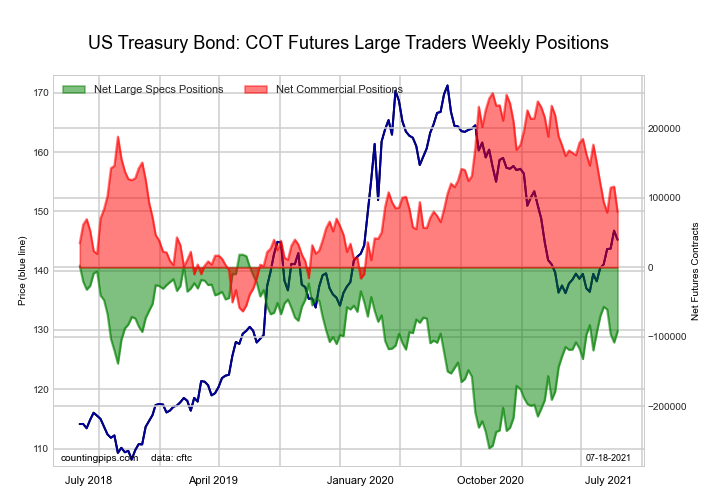
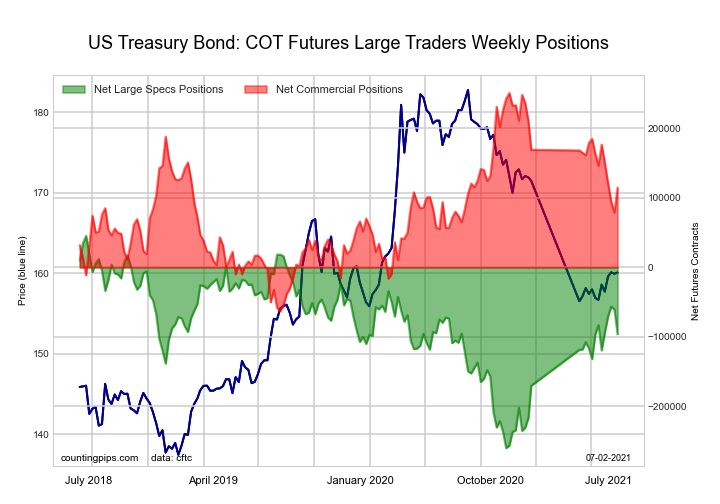
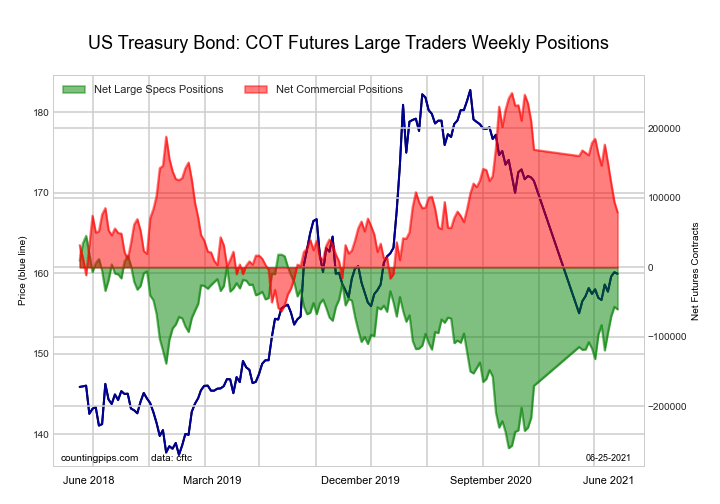
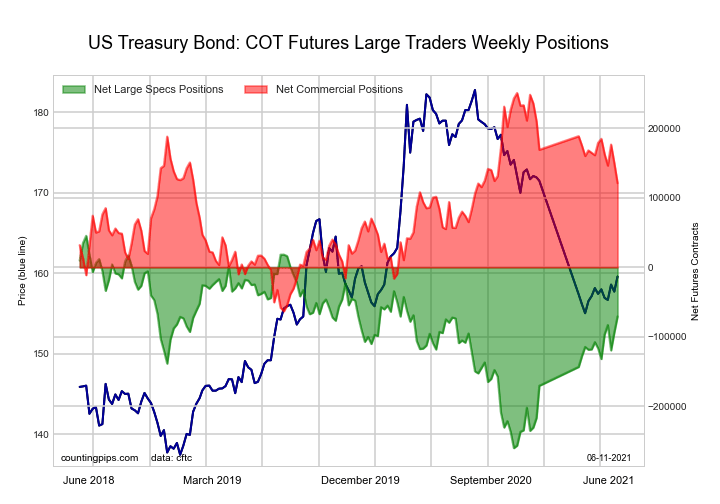
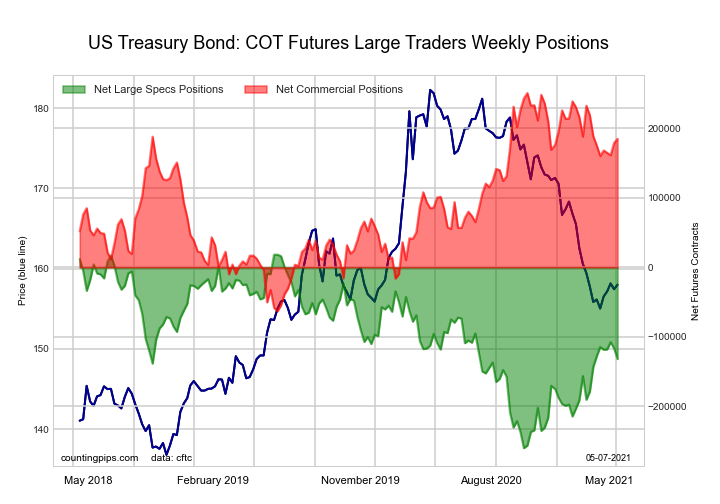
US Treasury Bonds Futures:
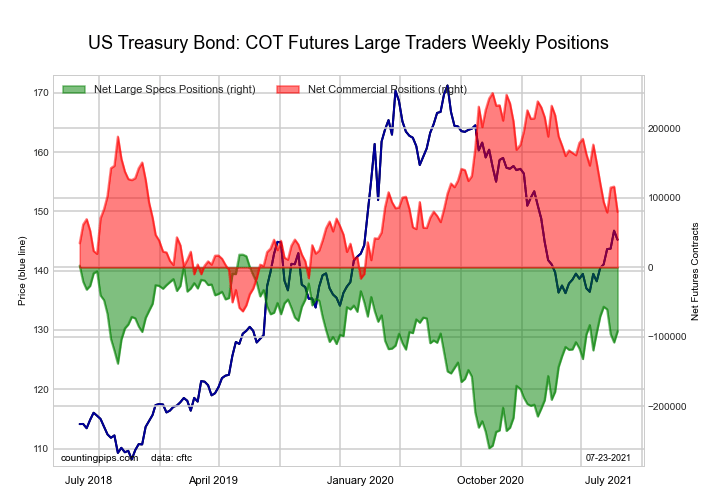 The US Treasury Bonds large speculator standing this week equaled a net position of -100,608 contracts in the data reported through Tuesday. This was a weekly decrease of -8,698 contracts from the previous week which had a total of -91,910 net contracts.
This week’s current strength score (the trader positioning range over the past three years, measured from 0 to 100) shows the speculators are currently Bullish with a score of 57.3 percent. The commercials are Bearish with a score of 48.8 percent and the small traders (not shown in chart) are Bullish with a score of 60.9 percent.
| US Treasury Bonds Statistics | SPECULATORS | COMMERCIALS | SMALL TRADERS |
| – Percent of Open Interest Longs: | 10.4 | 72.3 | 15.3 |
| – Percent of Open Interest Shorts: | 18.7 | 64.9 | 14.4 |
| – Net Position: | -100,608 | 90,135 | 10,473 |
| – Gross Longs: | 126,216 | 876,137 | 185,434 |
| – Gross Shorts: | 226,824 | 786,002 | 174,961 |
| – Long to Short Ratio: | 0.6 to 1 | 1.1 to 1 | 1.1 to 1 |
| NET POSITION TREND: | |||
| – COT Index Score (3 Year Range Pct): | 57.3 | 48.8 | 60.9 |
| – COT Index Reading (3 Year Range): | Bullish | Bearish | Bullish |
| NET POSITION MOVEMENT INDEX: | |||
| – 6-Week Change in Strength Index: | -10.8 | -9.9 | 48.4 |
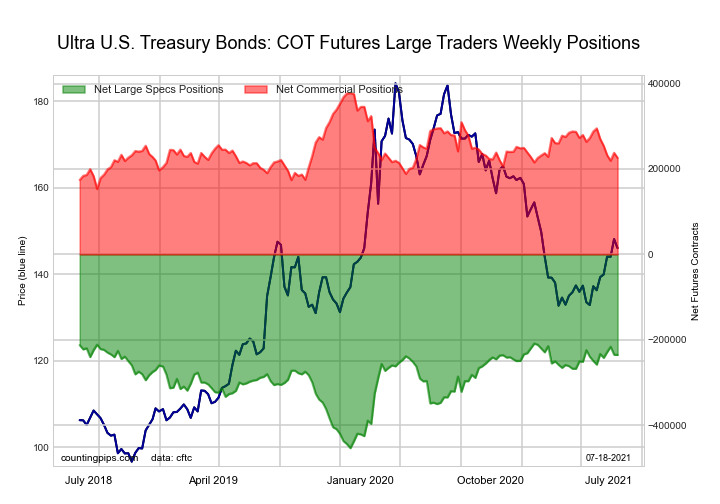
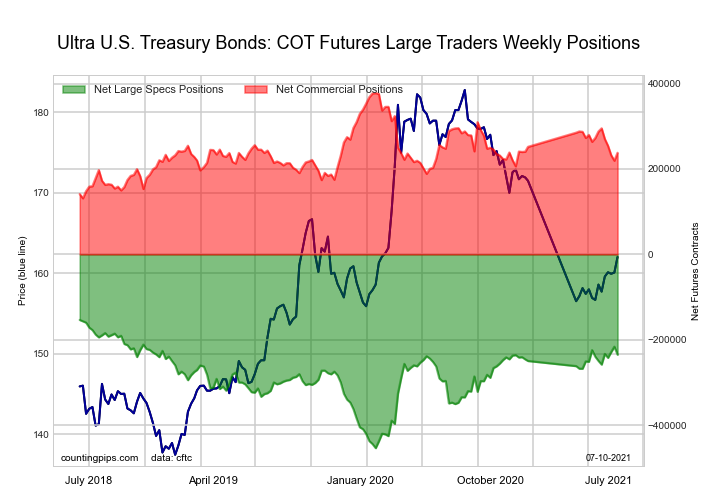
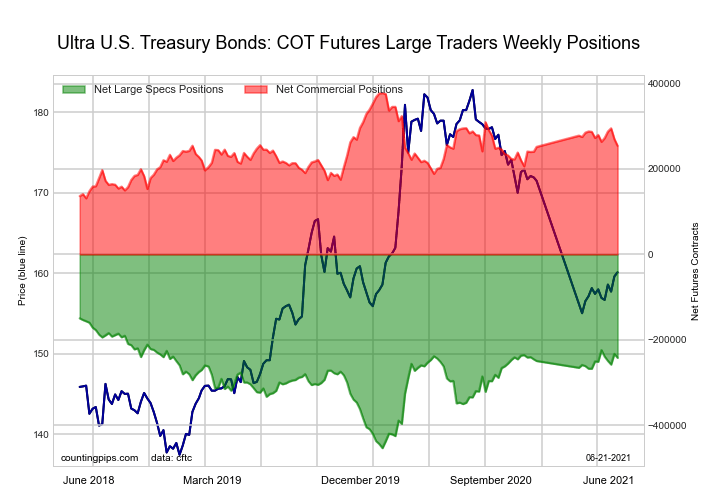
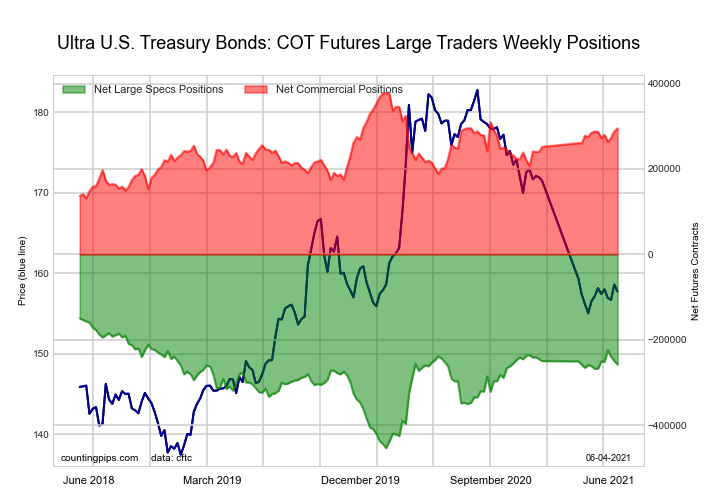
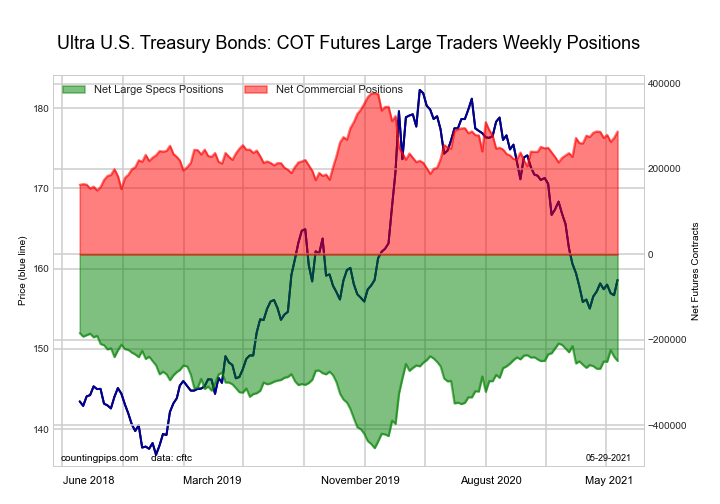
Ultra US Treasury Bonds Futures:
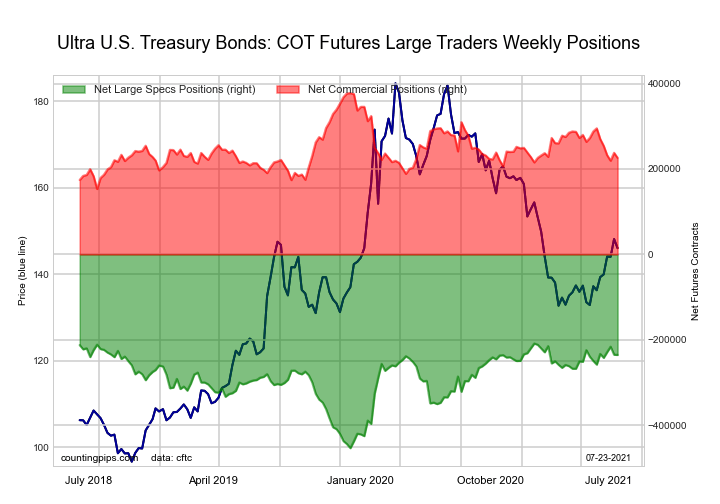 The Ultra US Treasury Bonds large speculator standing this week equaled a net position of -226,637 contracts in the data reported through Tuesday. This was a weekly advance of 8,996 contracts from the previous week which had a total of -235,633 net contracts.
This week’s current strength score (the trader positioning range over the past three years, measured from 0 to 100) shows the speculators are currently Bullish-Extreme with a score of 92.8 percent. The commercials are Bearish with a score of 27.2 percent and the small traders (not shown in chart) are Bearish with a score of 37.2 percent.
| Ultra US Treasury Bonds Statistics | SPECULATORS | COMMERCIALS | SMALL TRADERS |
| – Percent of Open Interest Longs: | 9.7 | 77.8 | 12.2 |
| – Percent of Open Interest Shorts: | 28.2 | 60.3 | 11.2 |
| – Net Position: | -226,637 | 214,235 | 12,402 |
| – Gross Longs: | 118,272 | 952,621 | 149,678 |
| – Gross Shorts: | 344,909 | 738,386 | 137,276 |
| – Long to Short Ratio: | 0.3 to 1 | 1.3 to 1 | 1.1 to 1 |
| NET POSITION TREND: | |||
| – COT Index Score (3 Year Range Pct): | 92.8 | 27.2 | 37.2 |
| – COT Index Reading (3 Year Range): | Bullish-Extreme | Bearish | Bearish |
| NET POSITION MOVEMENT INDEX: | |||
| – 6-Week Change in Strength Index: | 2.7 | -25.0 | 35.5 |
Article By CountingPips.com – Receive our weekly COT Reports by Email
*COT Report: The COT data, released weekly to the public each Friday, is updated through the most recent Tuesday (data is 3 days old) and shows a quick view of how large speculators or non-commercials (for-profit traders) were positioned in the futures markets.
The CFTC categorizes trader positions according to commercial hedgers (traders who use futures contracts for hedging as part of the business), non-commercials (large traders who speculate to realize trading profits) and nonreportable traders (usually small traders/speculators).
Find CFTC criteria here: (http://www.cftc.gov/MarketReports/CommitmentsofTraders/ExplanatoryNotes/index.htm).