
By CountingPips.com COT Home | Data Tables | Data Downloads | Newsletter
Here are the latest charts and statistics for the Commitment of Traders (COT) data published by the Commodities Futures Trading Commission (CFTC).
The latest COT data is updated through Tuesday April 27 2021 and shows a quick view of how large traders (for-profit speculators and commercial entities) were positioned in the futures markets.
30-Day Federal Funds Futures:

The 30-Day Federal Funds large speculator standing this week totaled a net position of -171,044 contracts in the data reported through Tuesday. This was a weekly reduction of -18,152 contracts from the previous week which had a total of -152,892 net contracts.
This week’s current strength score (the trader positioning range over the past three years, measured from 0 to 100) shows the speculators are currently Bearish-Extreme with a score of 7.2 percent. The commercials are Bullish-Extreme with a score of 93.2 percent and the small traders (not shown in chart) are Bullish with a score of 51.2 percent.
| 30-Day Federal Funds Statistics | SPECULATORS | COMMERCIALS | SMALL TRADERS |
| – Percent of Open Interest Longs: | 7.2 | 72.2 | 1.9 |
| – Percent of Open Interest Shorts: | 23.3 | 55.0 | 2.9 |
| – Net Position: | -171,044 | 181,942 | -10,898 |
| – Gross Longs: | 75,851 | 764,115 | 19,965 |
| – Gross Shorts: | 246,895 | 582,173 | 30,863 |
| – Long to Short Ratio: | 0.3 to 1 | 1.3 to 1 | 0.6 to 1 |
| NET POSITION TREND: | |||
| – COT Index Score (3 Year Range Pct): | 7.2 | 93.2 | 51.2 |
| – COT Index Reading (3 Year Range): | Bearish-Extreme | Bullish-Extreme | Bullish |
| NET POSITION MOVEMENT INDEX: | |||
| – 6-Week Change in Strength Index: | -7.1 | 7.6 | -7.9 |
Free Reports:
 Sign Up for Our Stock Market Newsletter – Get updated on News, Charts & Rankings of Public Companies when you join our Stocks Newsletter
 Get our Weekly Commitment of Traders Reports - See where the biggest traders (Hedge Funds and Commercial Hedgers) are positioned in the futures markets on a weekly basis.
2-Year Treasury Note Futures:
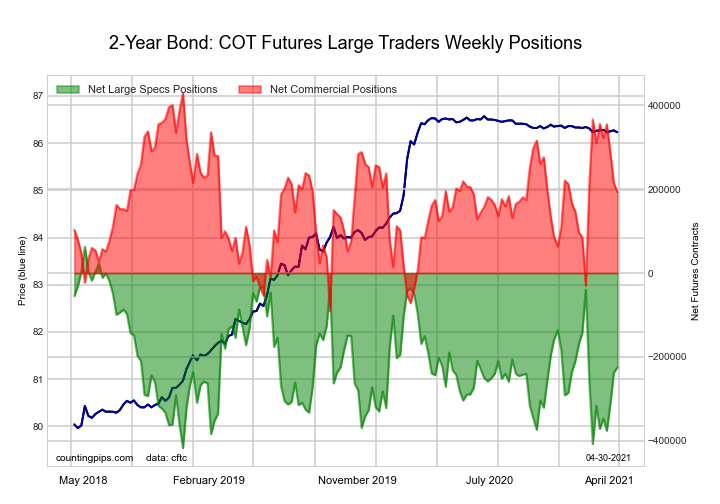
The 2-Year Treasury Note large speculator standing this week totaled a net position of -224,732 contracts in the data reported through Tuesday. This was a weekly gain of 12,698 contracts from the previous week which had a total of -237,430 net contracts.
This week’s current strength score (the trader positioning range over the past three years, measured from 0 to 100) shows the speculators are currently Bearish with a score of 40.1 percent. The commercials are Bullish with a score of 54.6 percent and the small traders (not shown in chart) are Bullish with a score of 51.3 percent.
| 2-Year Treasury Note Statistics | SPECULATORS | COMMERCIALS | SMALL TRADERS |
| – Percent of Open Interest Longs: | 17.8 | 75.0 | 6.2 |
| – Percent of Open Interest Shorts: | 27.6 | 66.5 | 4.9 |
| – Net Position: | -224,732 | 193,539 | 31,193 |
| – Gross Longs: | 407,822 | 1,720,277 | 142,515 |
| – Gross Shorts: | 632,554 | 1,526,738 | 111,322 |
| – Long to Short Ratio: | 0.6 to 1 | 1.1 to 1 | 1.3 to 1 |
| NET POSITION TREND: | |||
| – COT Index Score (3 Year Range Pct): | 40.1 | 54.6 | 51.3 |
| – COT Index Reading (3 Year Range): | Bearish | Bullish | Bullish |
| NET POSITION MOVEMENT INDEX: | |||
| – 6-Week Change in Strength Index: | 19.1 | -22.4 | 13.0 |
5-Year Treasury Note Futures:
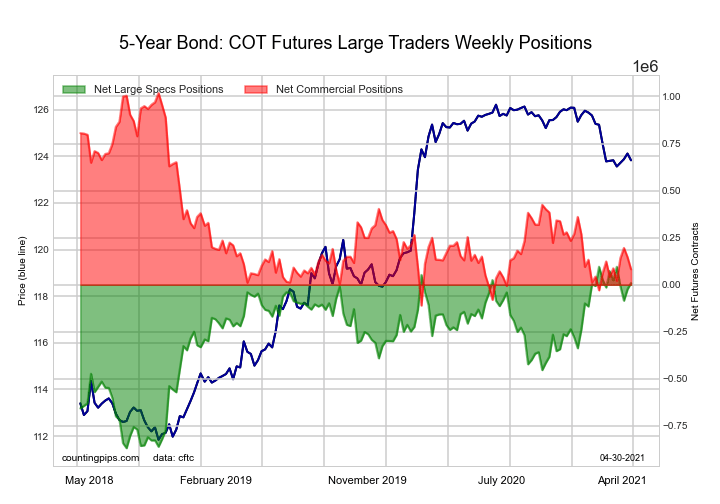
The 5-Year Treasury Note large speculator standing this week totaled a net position of 9,534 contracts in the data reported through Tuesday. This was a weekly rise of 33,783 contracts from the previous week which had a total of -24,249 net contracts.
This week’s current strength score (the trader positioning range over the past three years, measured from 0 to 100) shows the speculators are currently Bullish-Extreme with a score of 91.1 percent. The commercials are Bearish-Extreme with a score of 17.0 percent and the small traders (not shown in chart) are Bearish with a score of 34.3 percent.
| 5-Year Treasury Note Statistics | SPECULATORS | COMMERCIALS | SMALL TRADERS |
| – Percent of Open Interest Longs: | 11.6 | 77.3 | 8.5 |
| – Percent of Open Interest Shorts: | 11.4 | 74.8 | 11.3 |
| – Net Position: | 9,534 | 82,004 | -91,538 |
| – Gross Longs: | 392,216 | 2,603,900 | 287,669 |
| – Gross Shorts: | 382,682 | 2,521,896 | 379,207 |
| – Long to Short Ratio: | 1.0 to 1 | 1.0 to 1 | 0.8 to 1 |
| NET POSITION TREND: | |||
| – COT Index Score (3 Year Range Pct): | 91.1 | 17.0 | 34.3 |
| – COT Index Reading (3 Year Range): | Bullish-Extreme | Bearish-Extreme | Bearish |
| NET POSITION MOVEMENT INDEX: | |||
| – 6-Week Change in Strength Index: | -6.5 | 3.6 | 8.9 |
10-Year Treasury Note Futures:
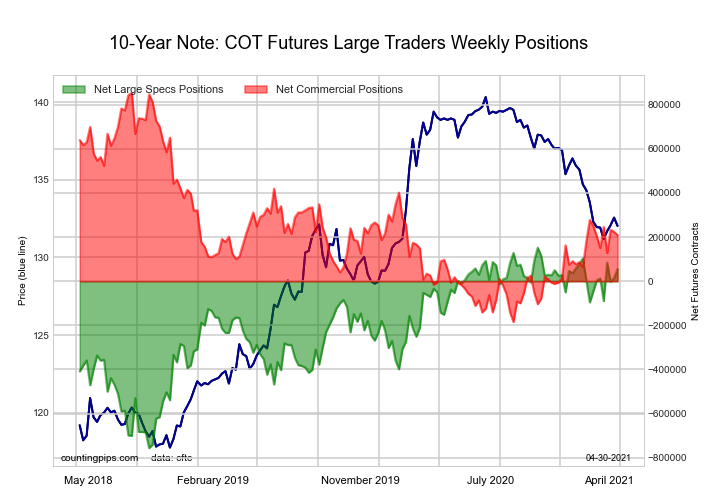
The 10-Year Treasury Note large speculator standing this week totaled a net position of 55,759 contracts in the data reported through Tuesday. This was a weekly advance of 40,152 contracts from the previous week which had a total of 15,607 net contracts.
This week’s current strength score (the trader positioning range over the past three years, measured from 0 to 100) shows the speculators are currently Bullish-Extreme with a score of 89.4 percent. The commercials are Bearish with a score of 37.9 percent and the small traders (not shown in chart) are Bearish-Extreme with a score of 1.9 percent.
| 10-Year Treasury Note Statistics | SPECULATORS | COMMERCIALS | SMALL TRADERS |
| – Percent of Open Interest Longs: | 17.9 | 72.0 | 7.6 |
| – Percent of Open Interest Shorts: | 16.5 | 66.7 | 14.2 |
| – Net Position: | 55,759 | 208,930 | -264,689 |
| – Gross Longs: | 714,330 | 2,874,584 | 304,533 |
| – Gross Shorts: | 658,571 | 2,665,654 | 569,222 |
| – Long to Short Ratio: | 1.1 to 1 | 1.1 to 1 | 0.5 to 1 |
| NET POSITION TREND: | |||
| – COT Index Score (3 Year Range Pct): | 89.4 | 37.9 | 1.9 |
| – COT Index Reading (3 Year Range): | Bullish-Extreme | Bearish | Bearish-Extreme |
| NET POSITION MOVEMENT INDEX: | |||
| – 6-Week Change in Strength Index: | 5.7 | 0.5 | -15.5 |
Ultra 10-Year Notes Futures:
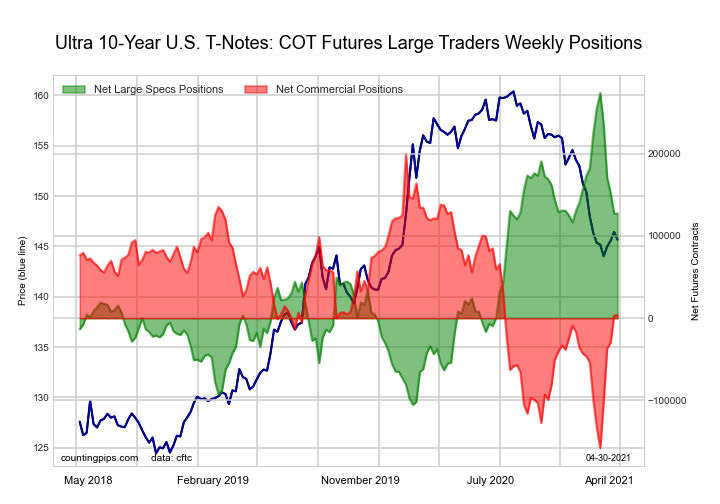
The Ultra 10-Year Notes large speculator standing this week totaled a net position of 127,365 contracts in the data reported through Tuesday. This was a weekly increase of 342 contracts from the previous week which had a total of 127,023 net contracts.
This week’s current strength score (the trader positioning range over the past three years, measured from 0 to 100) shows the speculators are currently Bullish with a score of 61.4 percent. The commercials are Bearish with a score of 45.4 percent and the small traders (not shown in chart) are Bearish-Extreme with a score of 2.7 percent.
| Ultra 10-Year Notes Statistics | SPECULATORS | COMMERCIALS | SMALL TRADERS |
| – Percent of Open Interest Longs: | 19.7 | 71.4 | 8.3 |
| – Percent of Open Interest Shorts: | 11.0 | 71.1 | 17.2 |
| – Net Position: | 127,365 | 3,907 | -131,272 |
| – Gross Longs: | 287,587 | 1,044,185 | 121,074 |
| – Gross Shorts: | 160,222 | 1,040,278 | 252,346 |
| – Long to Short Ratio: | 1.8 to 1 | 1.0 to 1 | 0.5 to 1 |
| NET POSITION TREND: | |||
| – COT Index Score (3 Year Range Pct): | 61.4 | 45.4 | 2.7 |
| – COT Index Reading (3 Year Range): | Bullish | Bearish | Bearish-Extreme |
| NET POSITION MOVEMENT INDEX: | |||
| – 6-Week Change in Strength Index: | -33.7 | 38.4 | -8.5 |
US Treasury Bonds Futures:
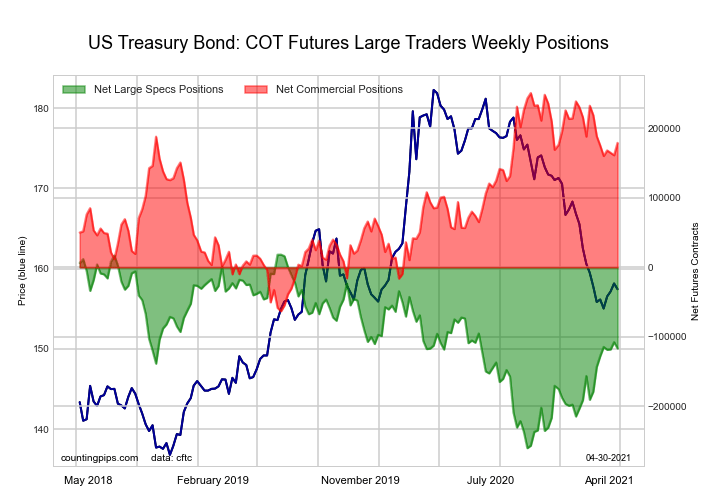
The US Treasury Bonds large speculator standing this week totaled a net position of -116,617 contracts in the data reported through Tuesday. This was a weekly reduction of -9,033 contracts from the previous week which had a total of -107,584 net contracts.
This week’s current strength score (the trader positioning range over the past three years, measured from 0 to 100) shows the speculators are currently Bullish with a score of 51.5 percent. The commercials are Bullish with a score of 77.2 percent and the small traders (not shown in chart) are Bearish-Extreme with a score of 6.5 percent.
| US Treasury Bonds Statistics | SPECULATORS | COMMERCIALS | SMALL TRADERS |
| – Percent of Open Interest Longs: | 6.3 | 79.1 | 12.4 |
| – Percent of Open Interest Shorts: | 16.1 | 64.0 | 17.7 |
| – Net Position: | -116,617 | 179,036 | -62,419 |
| – Gross Longs: | 74,380 | 938,645 | 147,292 |
| – Gross Shorts: | 190,997 | 759,609 | 209,711 |
| – Long to Short Ratio: | 0.4 to 1 | 1.2 to 1 | 0.7 to 1 |
| NET POSITION TREND: | |||
| – COT Index Score (3 Year Range Pct): | 51.5 | 77.2 | 6.5 |
| – COT Index Reading (3 Year Range): | Bullish | Bullish | Bearish-Extreme |
| NET POSITION MOVEMENT INDEX: | |||
| – 6-Week Change in Strength Index: | 9.6 | -3.0 | -13.1 |
Ultra US Treasury Bonds Futures:
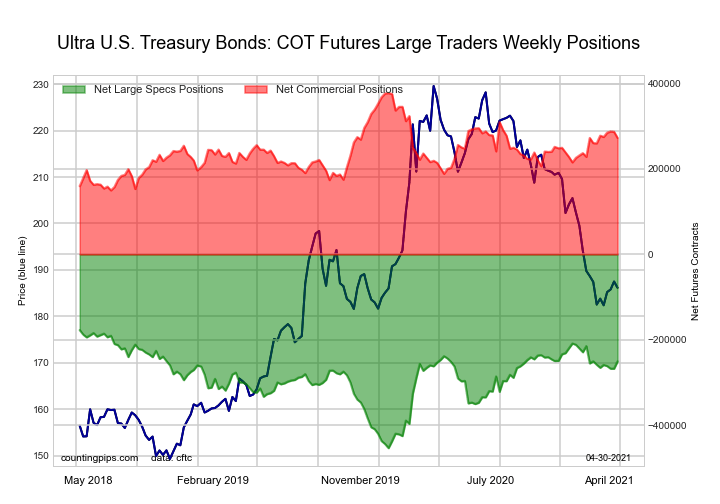
The Ultra US Treasury Bonds large speculator standing this week totaled a net position of -250,828 contracts in the data reported through Tuesday. This was a weekly advance of 17,019 contracts from the previous week which had a total of -267,847 net contracts.
This week’s current strength score (the trader positioning range over the past three years, measured from 0 to 100) shows the speculators are currently Bullish with a score of 73.5 percent. The commercials are Bullish with a score of 53.9 percent and the small traders (not shown in chart) are Bearish-Extreme with a score of 1.0 percent.
| Ultra US Treasury Bonds Statistics | SPECULATORS | COMMERCIALS | SMALL TRADERS |
| – Percent of Open Interest Longs: | 5.6 | 82.3 | 11.6 |
| – Percent of Open Interest Shorts: | 27.7 | 58.3 | 13.6 |
| – Net Position: | -250,828 | 272,787 | -21,959 |
| – Gross Longs: | 63,602 | 934,224 | 132,115 |
| – Gross Shorts: | 314,430 | 661,437 | 154,074 |
| – Long to Short Ratio: | 0.2 to 1 | 1.4 to 1 | 0.9 to 1 |
| NET POSITION TREND: | |||
| – COT Index Score (3 Year Range Pct): | 73.5 | 53.9 | 1.0 |
| – COT Index Reading (3 Year Range): | Bullish | Bullish | Bearish-Extreme |
| NET POSITION MOVEMENT INDEX: | |||
| – 6-Week Change in Strength Index: | 2.8 | 5.5 | -16.6 |
3-Month Eurodollars Futures:
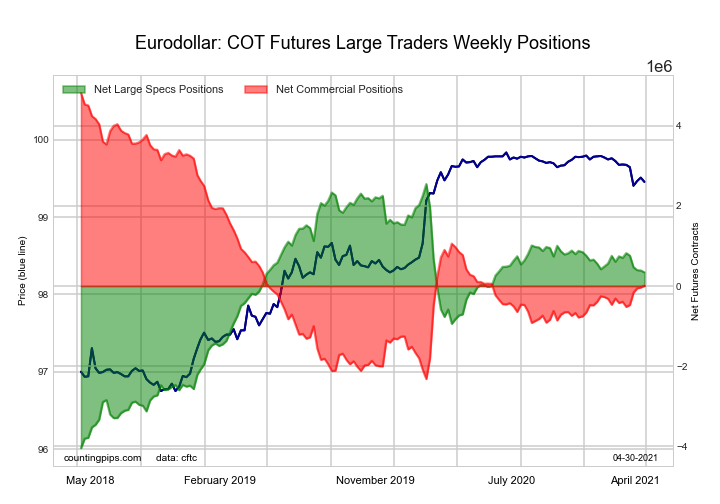
The 3-Month Eurodollars large speculator standing this week totaled a net position of 342,221 contracts in the data reported through Tuesday. This was a weekly lowering of -45,743 contracts from the previous week which had a total of 387,964 net contracts.
This week’s current strength score (the trader positioning range over the past three years, measured from 0 to 100) shows the speculators are currently Bullish with a score of 66.6 percent. The commercials are Bearish with a score of 32.8 percent and the small traders (not shown in chart) are Bullish with a score of 56.1 percent.
| 3-Month Eurodollars Statistics | SPECULATORS | COMMERCIALS | SMALL TRADERS |
| – Percent of Open Interest Longs: | 20.7 | 50.1 | 5.1 |
| – Percent of Open Interest Shorts: | 17.8 | 49.9 | 8.2 |
| – Net Position: | 342,221 | 18,273 | -360,494 |
| – Gross Longs: | 2,404,580 | 5,819,867 | 592,736 |
| – Gross Shorts: | 2,062,359 | 5,801,594 | 953,230 |
| – Long to Short Ratio: | 1.2 to 1 | 1.0 to 1 | 0.6 to 1 |
| NET POSITION TREND: | |||
| – COT Index Score (3 Year Range Pct): | 66.6 | 32.8 | 56.1 |
| – COT Index Reading (3 Year Range): | Bullish | Bearish | Bullish |
| NET POSITION MOVEMENT INDEX: | |||
| – 6-Week Change in Strength Index: | -5.5 | 5.8 | -6.3 |
Article By CountingPips.com – Receive our weekly COT Reports by Email
*COT Report: The COT data, released weekly to the public each Friday, is updated through the most recent Tuesday (data is 3 days old) and shows a quick view of how large speculators or non-commercials (for-profit traders) were positioned in the futures markets.
The CFTC categorizes trader positions according to commercial hedgers (traders who use futures contracts for hedging as part of the business), non-commercials (large traders who speculate to realize trading profits) and nonreportable traders (usually small traders/speculators).
Find CFTC criteria here: (http://www.cftc.gov/MarketReports/CommitmentsofTraders/ExplanatoryNotes/index.htm).

- The US introduces new import tariffs for 60 countries. Brent crude surpasses $100 per barrel Jul 24, 2026
- USD/JPY Breaks Records: Nothing Slows the Yen’s Decline Jul 24, 2026
- Oil prices reached a 6‑week high. The AUD strengthened on the back of a strong labor‑market report Jul 23, 2026
- EUR/USD Recovers as Dollar Weakens Jul 23, 2026
- Bitcoin rose to $66,000. The New Zealand dollar continues to strengthen Jul 22, 2026
- Inflationary pressure is easing in Canada. In New Zealand, on the contrary, inflation is rising Jul 21, 2026
- GBP/USD Falls After Cabinet Changes Jul 21, 2026
- Geopolitical and macroeconomic conditions continue to pressure market sentiment Jul 20, 2026
- USD/JPY Poised to Continue Gains as Expensive Oil and Lack of Support Weigh on Yen Jul 20, 2026
- COT Metals Charts: Weekly Speculator Bets led by Copper & Steel Jul 18, 2026