
By InvestMacro
Here are the latest charts and statistics for the Commitment of Traders (COT) data published by the Commodities Futures Trading Commission (CFTC).
The latest COT data is updated through Tuesday March 3rd and shows a quick view of how large traders (for-profit speculators and commercial entities) were positioned in the futures markets.
Weekly Speculator Changes led by Silver, Gold & Platinum
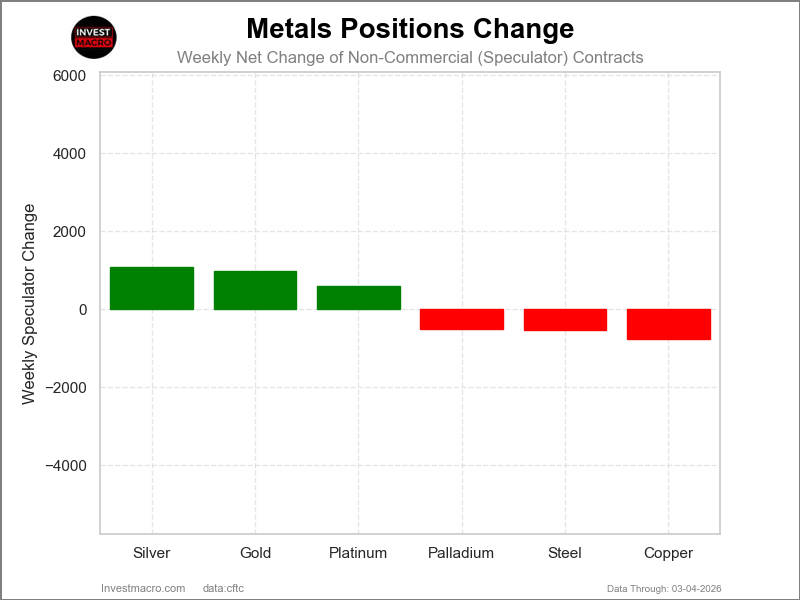
The COT metals markets speculator bets were mixed this week as three out of the six metals markets we cover had higher positioning while the other three markets had lower speculator contracts.
Leading the gains for the metals was Silver (1,078 contracts) with Gold (968 contracts) and Platinum (592 contracts) also showing modestly positive weeks.
The markets with declines in speculator bets for the week were Copper (-759 contracts), Steel (-526 contracts) and with Palladium (-503 contracts) also registering lower bets on the week.
Free Reports:
 Get our Weekly Commitment of Traders Reports - See where the biggest traders (Hedge Funds and Commercial Hedgers) are positioned in the futures markets on a weekly basis.
 Sign Up for Our Stock Market Newsletter – Get updated on News, Charts & Rankings of Public Companies when you join our Stocks Newsletter
Steel leads Metal Markets price performance this week
Steel had the highest five-day price change for the Metals Markets this week with a 2.67% gain. Gold was lower by -2.09% and Copper was down by -3.34% over the past five days. Palladium saw a sharp decline by -8.78% and was followed by Platinum which saw a -9.85% drop. The biggest decliner on the week was Silver with a -10.23% shortfall.
The cool-off in the Metals Markets can be seen over the past thirty days returns with only Steel (17.72%) and Gold (4.81%) having higher price returns over the past thirty days while Copper (-0.08%), Palladium( -19.67%), Platinum (-23.28%), and Silver (-12.84%) all have now moved into negative territory over the past thirty days.
Over the past ninety days, all six of our Metal Markets are up by at least 12% with Copper being the lowest gainer with a 12.79% gain over the past ninety days while Silver still leads with a 72.63% rise over the past ninety days. Steel (43.06%), Platinum (33.63%), Gold (25.43%) and Palladium (16.12%) are still seeing strong returns over the past 90-days as well.
Metals Data:
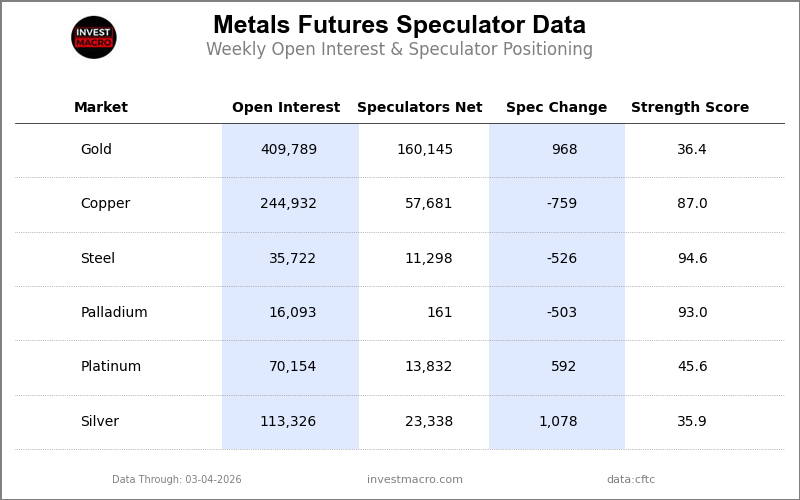
Legend: Weekly Speculators Change | Speculators Current Net Position | Speculators Strength Score compared to last 3-Years (0-100 range)
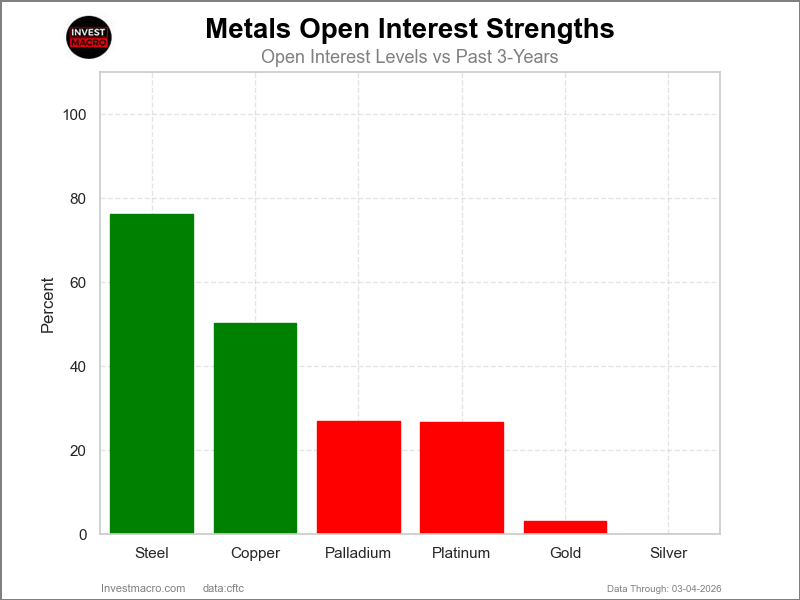
Strength Scores led by Steel, Palladium & Copper
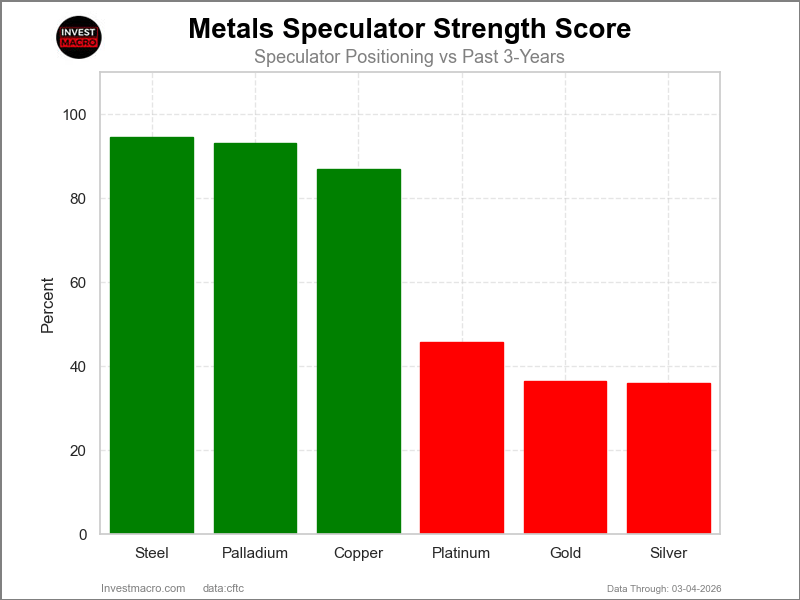
COT Strength Scores (a normalized measure of Speculator positions over a 3-Year range, from 0 to 100 where above 80 is Extreme-Bullish and below 20 is Extreme-Bearish) showed that Steel (95 percent) and Palladium (93 percent) lead the metals markets this week. Copper (87 percent) comes in as the next highest in the weekly strength scores.
On the downside, Silver (36 percent) and Gold (36 percent) come in at the lowest strength levels currently followed by Platinum (46 percent).
Strength Statistics:
Gold (36.4 percent) vs Gold previous week (36.0 percent)
Silver (35.9 percent) vs Silver previous week (34.3 percent)
Copper (87.0 percent) vs Copper previous week (87.7 percent)
Platinum (45.6 percent) vs Platinum previous week (44.1 percent)
Palladium (93.0 percent) vs Palladium previous week (96.3 percent)
Steel (94.6 percent) vs Steel previous week (97.3 percent)
Copper tops the 6-Week Strength Trends
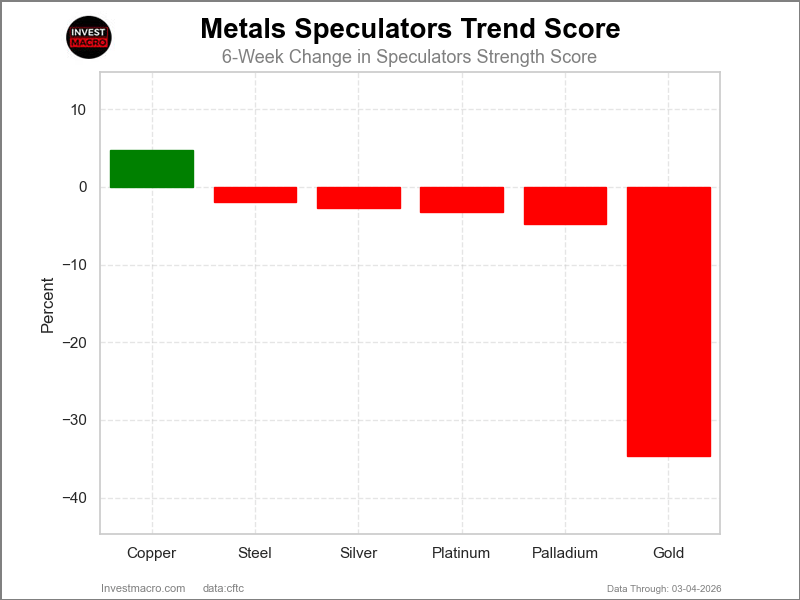
COT Strength Score Trends (or move index, calculates the 6-week changes in strength scores) showed that Copper (5 percent) leads the past six weeks trends for metals.
Gold (-35 percent) leads the downside trend scores currently with Palladium (-5 percent) as the next market with lower trend scores.
Move Statistics:
Gold (-34.7 percent) vs Gold previous week (-37.7 percent)
Silver (-2.7 percent) vs Silver previous week (-14.3 percent)
Copper (4.8 percent) vs Copper previous week (4.7 percent)
Platinum (-3.2 percent) vs Platinum previous week (-10.9 percent)
Palladium (-4.8 percent) vs Palladium previous week (-3.7 percent)
Steel (-1.9 percent) vs Steel previous week (4.2 percent)
Individual Markets:
Gold Comex Futures:
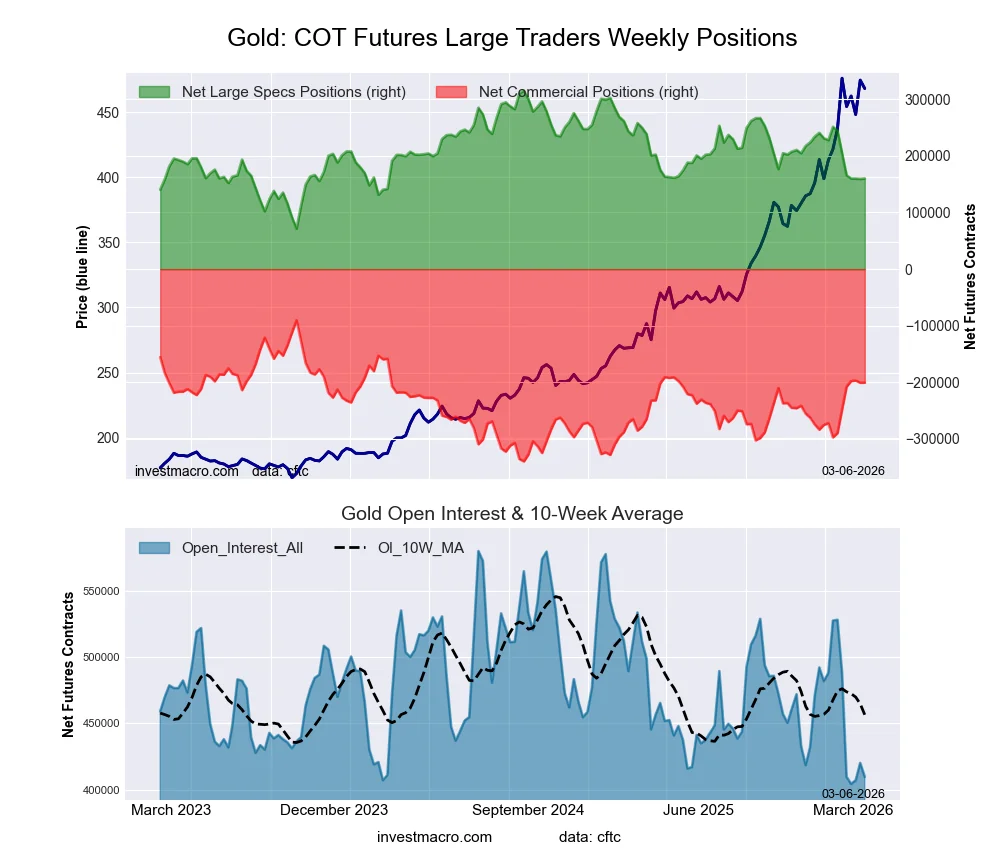 The Gold Comex Futures large speculator standing this week totaled a net position of 160,145 contracts in the data reported through Tuesday. This was a weekly boost of 968 contracts from the previous week which had a total of 159,177 net contracts.
This week’s current strength score (the trader positioning range over the past three years, measured from 0 to 100) shows the speculators are currently Bearish with a score of 36.4 percent. The commercials are Bullish with a score of 55.8 percent and the small traders (not shown in chart) are Bullish-Extreme with a score of 84.1 percent.
Price Trend-Following Model: Uptrend
Our weekly trend-following model classifies the current market price position as: Uptrend.
| Gold Futures Statistics | SPECULATORS | COMMERCIALS | SMALL TRADERS |
| – Percent of Open Interest Longs: | 52.2 | 20.7 | 13.5 |
| – Percent of Open Interest Shorts: | 13.1 | 69.6 | 3.6 |
| – Net Position: | 160,145 | -200,583 | 40,438 |
| – Gross Longs: | 213,752 | 84,834 | 55,126 |
| – Gross Shorts: | 53,607 | 285,417 | 14,688 |
| – Long to Short Ratio: | 4.0 to 1 | 0.3 to 1 | 3.8 to 1 |
| NET POSITION TREND: | |||
| – Strength Index Score (3 Year Range Pct): | 36.4 | 55.8 | 84.1 |
| – Strength Index Reading (3 Year Range): | Bearish | Bullish | Bullish-Extreme |
| NET POSITION MOVEMENT INDEX: | |||
| – 6-Week Change in Strength Index: | -34.7 | 35.7 | -13.1 |
Silver Comex Futures:
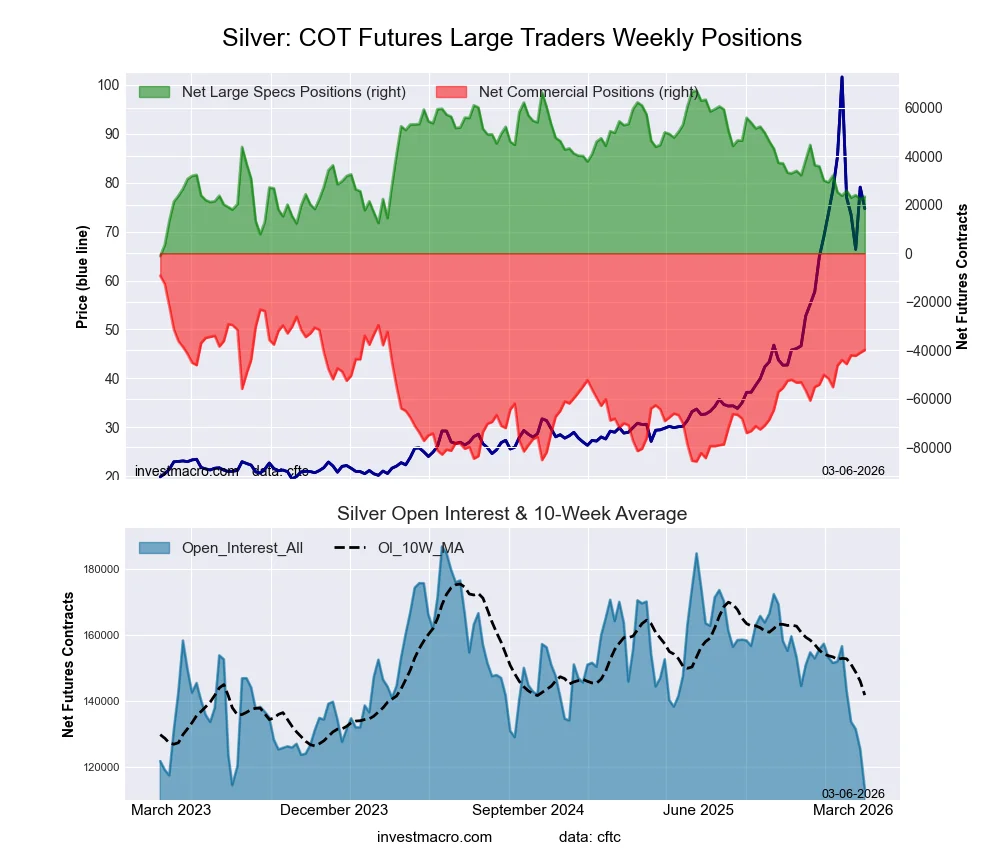 The Silver Comex Futures large speculator standing this week totaled a net position of 23,338 contracts in the data reported through Tuesday. This was a weekly increase of 1,078 contracts from the previous week which had a total of 22,260 net contracts.
This week’s current strength score (the trader positioning range over the past three years, measured from 0 to 100) shows the speculators are currently Bearish with a score of 35.9 percent. The commercials are Bullish with a score of 59.9 percent and the small traders (not shown in chart) are Bearish with a score of 44.6 percent.
Price Trend-Following Model: Uptrend
Our weekly trend-following model classifies the current market price position as: Uptrend.
| Silver Futures Statistics | SPECULATORS | COMMERCIALS | SMALL TRADERS |
| – Percent of Open Interest Longs: | 30.2 | 27.3 | 23.0 |
| – Percent of Open Interest Shorts: | 9.6 | 62.5 | 8.3 |
| – Net Position: | 23,338 | -39,966 | 16,628 |
| – Gross Longs: | 34,226 | 30,893 | 26,079 |
| – Gross Shorts: | 10,888 | 70,859 | 9,451 |
| – Long to Short Ratio: | 3.1 to 1 | 0.4 to 1 | 2.8 to 1 |
| NET POSITION TREND: | |||
| – Strength Index Score (3 Year Range Pct): | 35.9 | 59.9 | 44.6 |
| – Strength Index Reading (3 Year Range): | Bearish | Bullish | Bearish |
| NET POSITION MOVEMENT INDEX: | |||
| – 6-Week Change in Strength Index: | -2.7 | 8.4 | -25.0 |
Copper Grade #1 Futures:
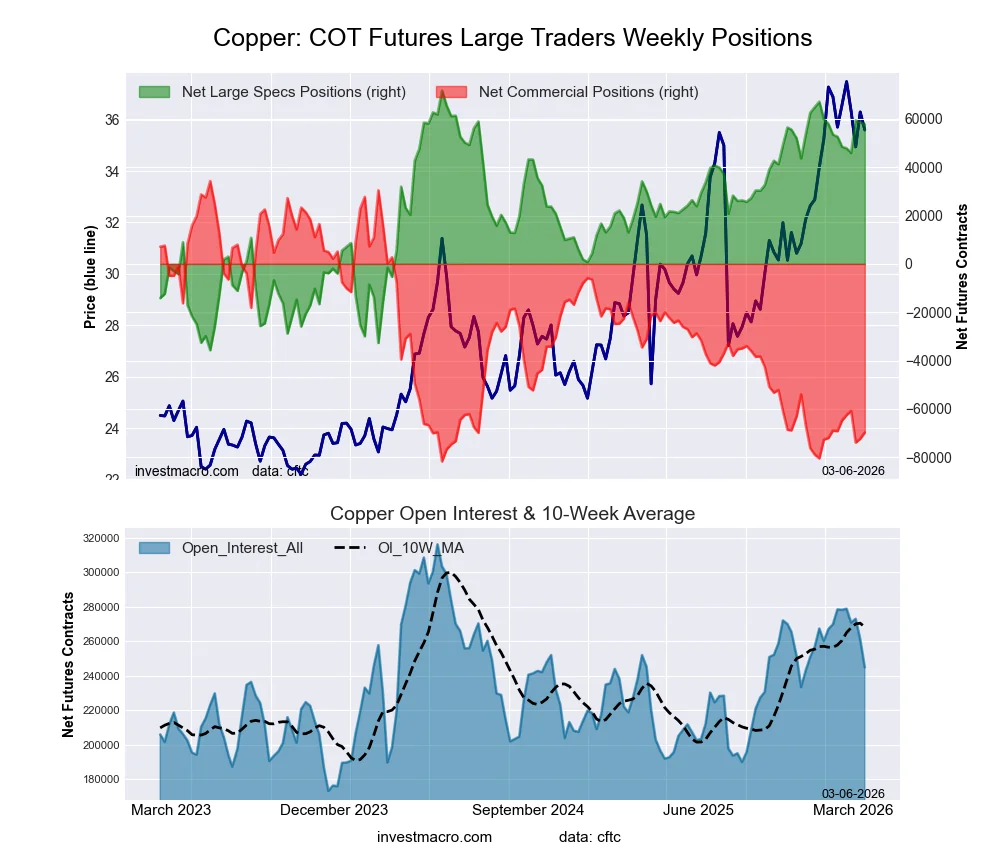 The Copper Grade #1 Futures large speculator standing this week totaled a net position of 57,681 contracts in the data reported through Tuesday. This was a weekly reduction of -759 contracts from the previous week which had a total of 58,440 net contracts.
This week’s current strength score (the trader positioning range over the past three years, measured from 0 to 100) shows the speculators are currently Bullish-Extreme with a score of 87.0 percent. The commercials are Bearish-Extreme with a score of 10.3 percent and the small traders (not shown in chart) are Bullish with a score of 76.6 percent.
Price Trend-Following Model: Uptrend
Our weekly trend-following model classifies the current market price position as: Uptrend.
| Copper Futures Statistics | SPECULATORS | COMMERCIALS | SMALL TRADERS |
| – Percent of Open Interest Longs: | 36.4 | 34.9 | 8.4 |
| – Percent of Open Interest Shorts: | 12.8 | 63.4 | 3.4 |
| – Net Position: | 57,681 | -69,744 | 12,063 |
| – Gross Longs: | 89,103 | 85,481 | 20,481 |
| – Gross Shorts: | 31,422 | 155,225 | 8,418 |
| – Long to Short Ratio: | 2.8 to 1 | 0.6 to 1 | 2.4 to 1 |
| NET POSITION TREND: | |||
| – Strength Index Score (3 Year Range Pct): | 87.0 | 10.3 | 76.6 |
| – Strength Index Reading (3 Year Range): | Bullish-Extreme | Bearish-Extreme | Bullish |
| NET POSITION MOVEMENT INDEX: | |||
| – 6-Week Change in Strength Index: | 4.8 | -0.5 | -23.4 |
Platinum Futures:
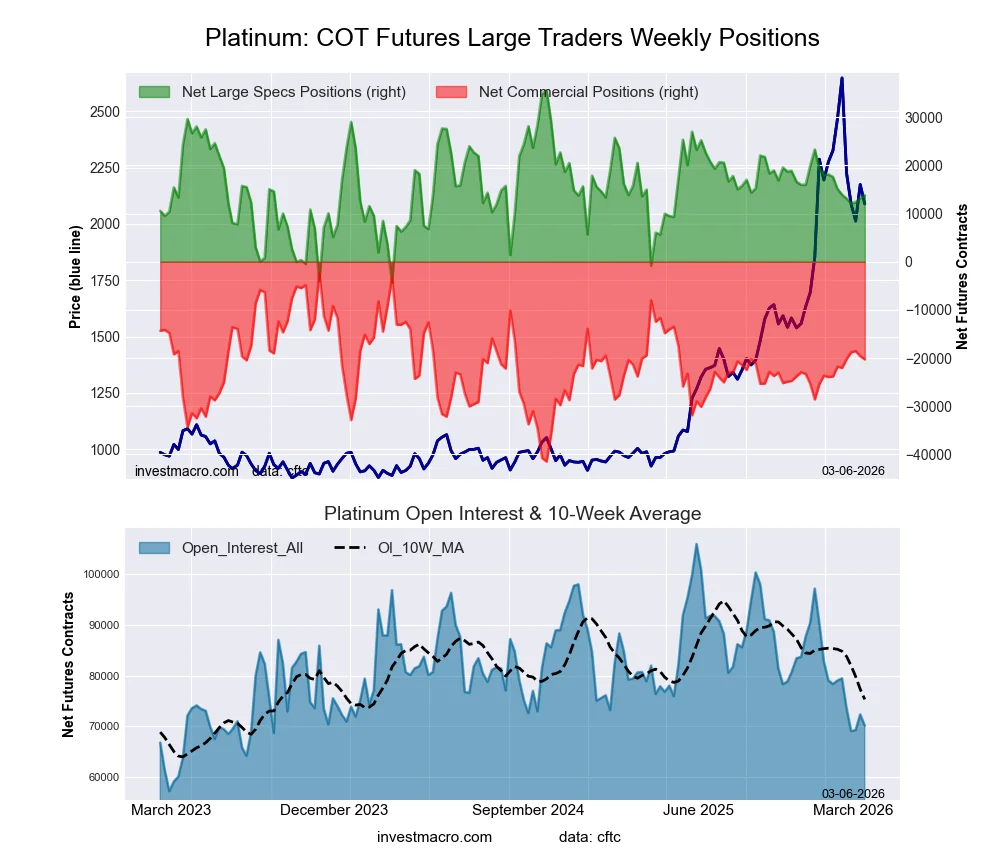 The Platinum Futures large speculator standing this week totaled a net position of 13,832 contracts in the data reported through Tuesday. This was a weekly advance of 592 contracts from the previous week which had a total of 13,240 net contracts.
This week’s current strength score (the trader positioning range over the past three years, measured from 0 to 100) shows the speculators are currently Bearish with a score of 45.6 percent. The commercials are Bullish with a score of 54.2 percent and the small traders (not shown in chart) are Bullish with a score of 72.7 percent.
Price Trend-Following Model: Uptrend
Our weekly trend-following model classifies the current market price position as: Uptrend.
| Platinum Futures Statistics | SPECULATORS | COMMERCIALS | SMALL TRADERS |
| – Percent of Open Interest Longs: | 45.0 | 29.2 | 13.2 |
| – Percent of Open Interest Shorts: | 25.3 | 58.0 | 4.0 |
| – Net Position: | 13,832 | -20,270 | 6,438 |
| – Gross Longs: | 31,579 | 20,451 | 9,257 |
| – Gross Shorts: | 17,747 | 40,721 | 2,819 |
| – Long to Short Ratio: | 1.8 to 1 | 0.5 to 1 | 3.3 to 1 |
| NET POSITION TREND: | |||
| – Strength Index Score (3 Year Range Pct): | 45.6 | 54.2 | 72.7 |
| – Strength Index Reading (3 Year Range): | Bearish | Bullish | Bullish |
| NET POSITION MOVEMENT INDEX: | |||
| – 6-Week Change in Strength Index: | -3.2 | 3.9 | -2.5 |
Palladium Futures:
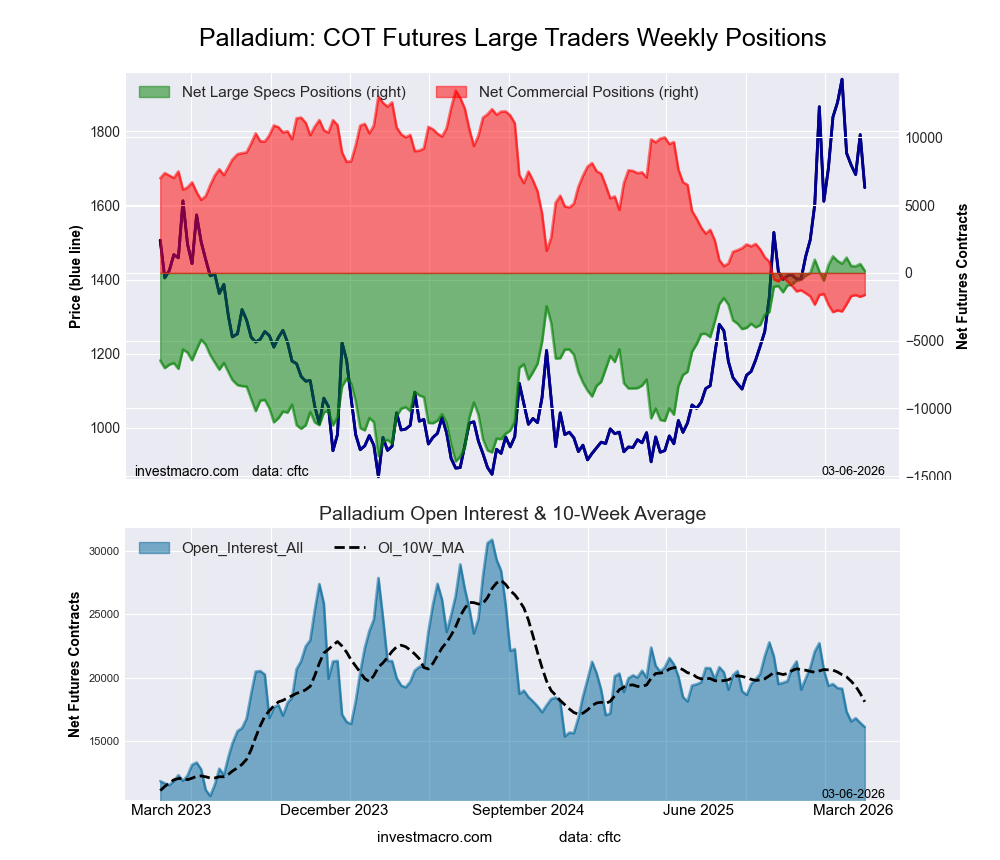 The Palladium Futures large speculator standing this week totaled a net position of 161 contracts in the data reported through Tuesday. This was a weekly fall of -503 contracts from the previous week which had a total of 664 net contracts.
This week’s current strength score (the trader positioning range over the past three years, measured from 0 to 100) shows the speculators are currently Bullish-Extreme with a score of 93.0 percent. The commercials are Bearish-Extreme with a score of 7.7 percent and the small traders (not shown in chart) are Bullish with a score of 70.8 percent.
Price Trend-Following Model: Weak Uptrend
Our weekly trend-following model classifies the current market price position as: Weak Uptrend.
| Palladium Futures Statistics | SPECULATORS | COMMERCIALS | SMALL TRADERS |
| – Percent of Open Interest Longs: | 48.3 | 33.8 | 15.7 |
| – Percent of Open Interest Shorts: | 47.3 | 44.0 | 6.5 |
| – Net Position: | 161 | -1,631 | 1,470 |
| – Gross Longs: | 7,768 | 5,446 | 2,519 |
| – Gross Shorts: | 7,607 | 7,077 | 1,049 |
| – Long to Short Ratio: | 1.0 to 1 | 0.8 to 1 | 2.4 to 1 |
| NET POSITION TREND: | |||
| – Strength Index Score (3 Year Range Pct): | 93.0 | 7.7 | 70.8 |
| – Strength Index Reading (3 Year Range): | Bullish-Extreme | Bearish-Extreme | Bullish |
| NET POSITION MOVEMENT INDEX: | |||
| – 6-Week Change in Strength Index: | -4.8 | 6.9 | -13.9 |
Steel Futures Futures:
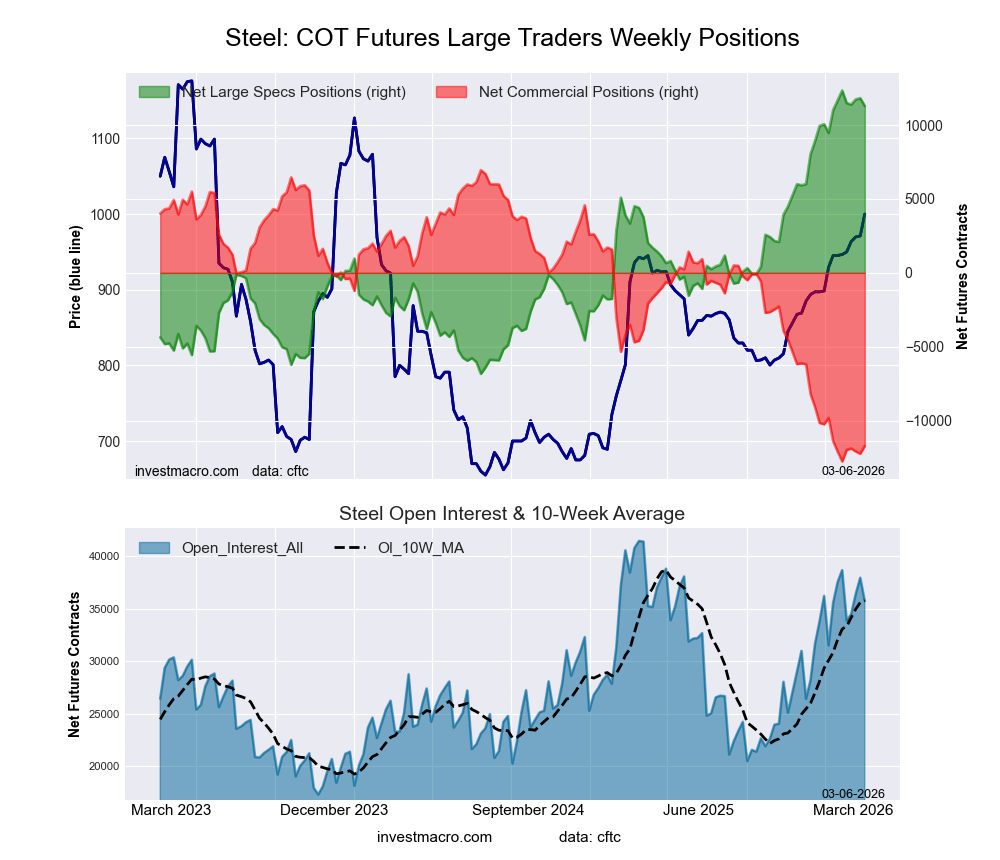 The Steel Futures large speculator standing this week totaled a net position of 11,298 contracts in the data reported through Tuesday. This was a weekly decrease of -526 contracts from the previous week which had a total of 11,824 net contracts.
This week’s current strength score (the trader positioning range over the past three years, measured from 0 to 100) shows the speculators are currently Bullish-Extreme with a score of 94.6 percent. The commercials are Bearish-Extreme with a score of 5.3 percent and the small traders (not shown in chart) are Bullish-Extreme with a score of 88.3 percent.
Price Trend-Following Model: Strong Uptrend
Our weekly trend-following model classifies the current market price position as: Strong Uptrend.
| Steel Futures Statistics | SPECULATORS | COMMERCIALS | SMALL TRADERS |
| – Percent of Open Interest Longs: | 37.3 | 59.2 | 1.5 |
| – Percent of Open Interest Shorts: | 5.7 | 92.0 | 0.3 |
| – Net Position: | 11,298 | -11,714 | 416 |
| – Gross Longs: | 13,321 | 21,158 | 519 |
| – Gross Shorts: | 2,023 | 32,872 | 103 |
| – Long to Short Ratio: | 6.6 to 1 | 0.6 to 1 | 5.0 to 1 |
| NET POSITION TREND: | |||
| – Strength Index Score (3 Year Range Pct): | 94.6 | 5.3 | 88.3 |
| – Strength Index Reading (3 Year Range): | Bullish-Extreme | Bearish-Extreme | Bullish-Extreme |
| NET POSITION MOVEMENT INDEX: | |||
| – 6-Week Change in Strength Index: | -1.9 | 1.9 | -1.4 |
Article By InvestMacro – Receive our weekly COT Newsletter
*COT Report: The COT data, released weekly to the public each Friday, is updated through the most recent Tuesday (data is 3 days old) and shows a quick view of how large speculators or non-commercials (for-profit traders) were positioned in the futures markets.
The CFTC categorizes trader positions according to commercial hedgers (traders who use futures contracts for hedging as part of the business), non-commercials (large traders who speculate to realize trading profits) and nonreportable traders (usually small traders/speculators) as well as their open interest (contracts open in the market at time of reporting). See CFTC criteria here.

- China has shifted to using its own strategic oil reserves Jun 9, 2026
- GBP/USD Remains Under Pressure Despite Attempts to Recover Jun 9, 2026
- SpaceX IPO: Set for $75 billion liftoff Jun 8, 2026
- On Friday, the American stock market experienced one of the strongest crashes in recent times Jun 8, 2026
- EUR/USD at April Lows: What’s Next for the Pair? Jun 8, 2026
- The ceasefire between Israel and Lebanon has reduced the geopolitical premium Jun 5, 2026
- EUR/USD: All Eyes on Non-Farm Payrolls Jun 5, 2026
- The escalation of the conflict in the Middle East put pressure on US and European stock indices Jun 4, 2026
- Gold Remains Under Pressure, but a Rebound Is Still Possible Jun 4, 2026
- Bitcoin drops below the psychological $70,000 level. The US stock indices hit new record highs Jun 3, 2026