
By RoboForex Analytical Department
Gold, on Wednesday, returned above the key level of 5000 USD per ounce and has already approached 5067 USD. The precious metal continues to grow after jumping more than 6% in the previous session, marking the strongest daily increase since 2008. The quotes were supported by purchases following a decline after a sharp correction at the beginning of the week.
Geopolitical risks gave an additional impetus to the precious metal. After US forces shot down an Iranian drone near an aircraft carrier in the Arabian Sea, demand for defensive assets intensified. At the same time, President Donald Trump stated that diplomatic contacts continue, and the White House confirmed the US-Iran talks scheduled for Friday.
Expectations of rapid Fed rate cuts have eased somewhat since the nomination of Kevin Warsh to head the Fed. Nevertheless, the markets are still pricing in two rate cuts – probably in the middle of the year and later in 2026.
Separately, it is noted that the publication of key US labour market statistics, including JOLTS data and the monthly employment report, will be postponed due to the partial government shutdown. The House voted on Tuesday on the Senate-approved stopgap budget.
Technical Analysis
Free Reports:
 Get our Weekly Commitment of Traders Reports - See where the biggest traders (Hedge Funds and Commercial Hedgers) are positioned in the futures markets on a weekly basis.
 Sign Up for Our Stock Market Newsletter – Get updated on News, Charts & Rankings of Public Companies when you join our Stocks Newsletter
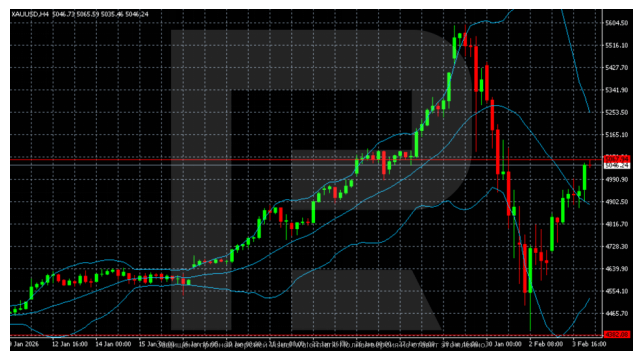
On the H4 chart for gold, after completing a powerful uptrend and reaching a peak around 5600, the market entered a sharp correction. The decline was impulsive, as evidenced by the expansion of Bollinger Bands – a sign of panic selling. The minimum was noted in the 4440–4450 zone, from where the technical rebound began. Current prices are recovering but remain below the Bollinger median line. The structure is still corrective, with increased volatility and a predominance of downside risks.
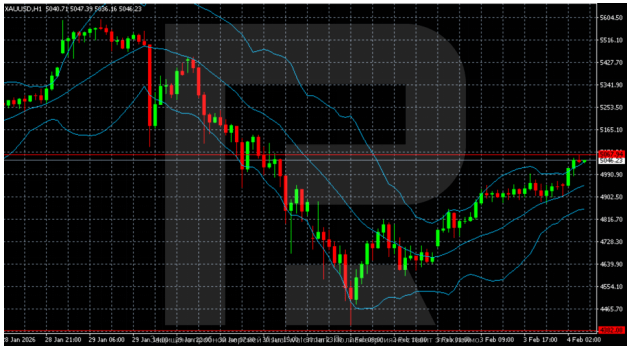
On the H1 chart, after a landslide downward movement, a base and a sequence of higher minima have formed – local stabilisation. The price is trading in a narrow upward channel and gradually moving towards the 5050-5100 resistance zone. However, the recovery looks technical. As long as the quotes are below key resistance and the median line of the higher timeframe, the rebound remains vulnerable to a resumption of selling.
Conclusion
In summary, gold’s sharp recovery is primarily a technical rebound from oversold conditions, supercharged by a sudden flare-up in geopolitical tensions. While the move is significant, the technical structure across timeframes suggests it remains a corrective bounce within a larger downtrend, not a confirmed reversal. The rally is vulnerable as long as prices trade below key higher-timeframe resistance. The fundamental landscape remains mixed, with delayed US data creating uncertainty and revised, but still present, Fed easing expectations providing a floor. Near-term direction will hinge on the evolution of Middle East diplomacy and gold’s ability to breach critical technical ceilings.
By RoboForex Analytical Department
Disclaimer
Any forecasts contained herein are based on the author’s particular opinion. This analysis may not be treated as trading advice. RoboForex bears no responsibility for trading results based on trading recommendations and reviews contained herein.

- Your Bourse and FXPRIMUS Bring 24/7 Synthetic Indices to the Global Broker Market Jun 16, 2026
- Institutional investors continue to reduce their presence in metals Jun 16, 2026
- USDJPY Driven by Emotions: Bank of Japan Raises Rate to Highest Level Since 1995 Jun 16, 2026
- The United States and Iran have signed a peace agreement – oil has fallen to 80 dollars per barrel. Jun 15, 2026
- EURUSD Ahead of the New Week: Expecting High Volatility Jun 15, 2026
- COT Metals Charts: Speculator Bets led by Steel Jun 14, 2026
- COT Bonds Charts: Speculator Bets led by 2-Year Bonds & Ultra 10-Year Bonds Jun 14, 2026
- COT Energy Charts: Speculator Bets led by Brent Oil Jun 14, 2026
- COT Soft Commodities Charts: Weekly Speculator Bets led lower by Corn and Soybean Meal Jun 14, 2026
- Today investors’ focus is directed at the historic IPO of SpaceX Jun 12, 2026