
By InvestMacro
Here are the latest charts and statistics for the Commitment of Traders (COT) data published by the Commodities Futures Trading Commission (CFTC).
The latest COT data is updated through Tuesday July 9th and shows a quick view of how large traders (for-profit speculators and commercial entities) were positioned in the futures markets.
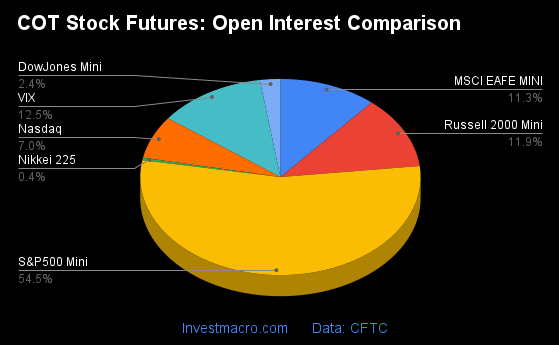
Weekly Speculator Changes led by Russell-Mini & MSCI EAFE-Mini
The COT stock markets speculator bets were higher this week as four out of the seven stock markets we cover had higher positioning while the other three markets had lower speculator contracts.
Free Reports:
 Get our Weekly Commitment of Traders Reports - See where the biggest traders (Hedge Funds and Commercial Hedgers) are positioned in the futures markets on a weekly basis.
 Sign Up for Our Stock Market Newsletter – Get updated on News, Charts & Rankings of Public Companies when you join our Stocks Newsletter
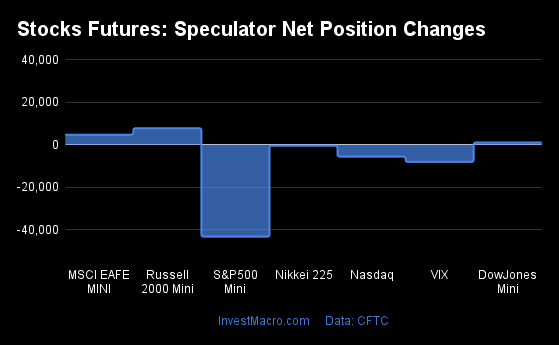
Leading the gains for the stock markets was the Russell-Mini (7,809 contracts) with the MSCI EAFE-Mini (4,742 contracts) and the DowJones-Mini (1,067 contracts) also showing positive weeks.
The markets with the declines in speculator bets this week were the S&P500-Mini (-43,203 contracts), the VIX (-8,053 contracts), the Nasdaq-Mini (-5,559 contracts) and the Nikkei 225 (-423 contracts) also having lower bets on the week.
Stock Market Net Speculators Leaderboard
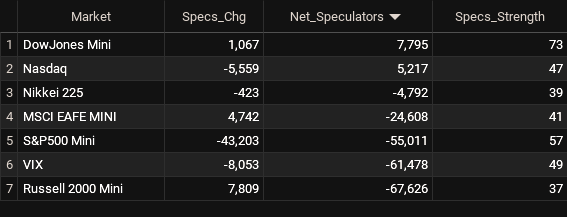
Legend: Weekly Speculators Change | Speculators Current Net Position | Speculators Strength Score compared to last 3-Years (0-100 range)
Strength Scores led by DowJones-Mini & S&P500-Mini
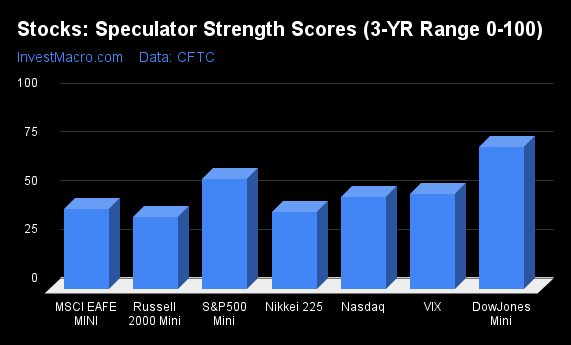
COT Strength Scores (a normalized measure of Speculator positions over a 3-Year range, from 0 to 100 where above 80 is Extreme-Bullish and below 20 is Extreme-Bearish) showed that the DowJones-Mini (73 percent) and the S&P500-Mini (57 percent) lead the stock markets this week. The VIX (49 percent) comes in as the next highest in the weekly strength scores.
On the downside, the Russell-Mini (37 percent) comes in at the lowest strength level currently and is in Extreme-Bearish territory (below 20 percent). The next lowest strength score is the Nikkei 225 (39 percent).
Strength Statistics:
VIX (48.6 percent) vs VIX previous week (57.3 percent)
S&P500-Mini (56.5 percent) vs S&P500-Mini previous week (63.0 percent)
DowJones-Mini (73.0 percent) vs DowJones-Mini previous week (71.2 percent)
Nasdaq-Mini (47.2 percent) vs Nasdaq-Mini previous week (55.9 percent)
Russell2000-Mini (37.1 percent) vs Russell2000-Mini previous week (31.6 percent)
Nikkei USD (39.3 percent) vs Nikkei USD previous week (42.9 percent)
EAFE-Mini (40.9 percent) vs EAFE-Mini previous week (36.0 percent)
Nasdaq-Mini tops the 6-Week Strength Trends
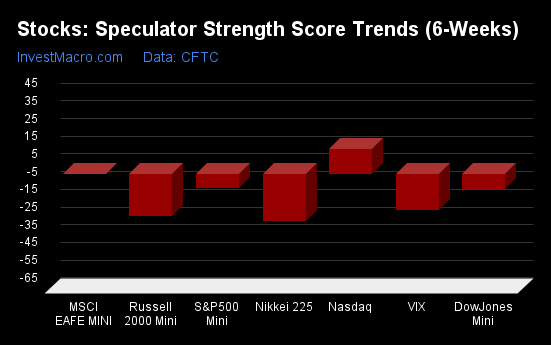
COT Strength Score Trends (or move index, calculates the 6-week changes in strength scores) showed that the Nasdaq-Mini (14 percent) leads the past six weeks trends and is the only market with a positive reading for the stock markets.
The Nikkei 225 (-27 percent) leads the downside trend scores currently with the Russell-Mini (-24 percent) coming in as the next market with lower trend scores.
Strength Trend Statistics:
VIX (-20.3 percent) vs VIX previous week (-2.2 percent)
S&P500-Mini (-7.9 percent) vs S&P500-Mini previous week (1.6 percent)
DowJones-Mini (-8.7 percent) vs DowJones-Mini previous week (-21.8 percent)
Nasdaq-Mini (13.9 percent) vs Nasdaq-Mini previous week (9.4 percent)
Russell2000-Mini (-24.0 percent) vs Russell2000-Mini previous week (-26.9 percent)
Nikkei USD (-26.9 percent) vs Nikkei USD previous week (-18.1 percent)
EAFE-Mini (-0.2 percent) vs EAFE-Mini previous week (0.2 percent)
Individual Stock Market Charts:
VIX Volatility Futures:
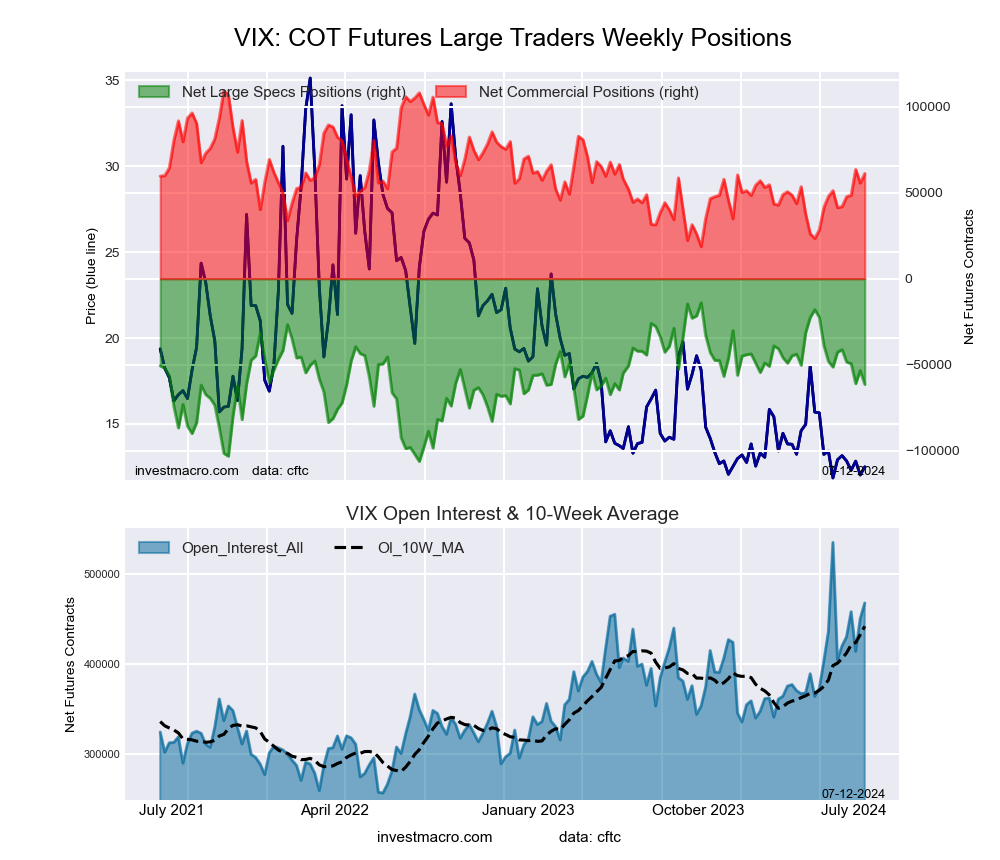
The VIX Volatility large speculator standing this week totaled a net position of -61,478 contracts in the data reported through Tuesday. This was a weekly reduction of -8,053 contracts from the previous week which had a total of -53,425 net contracts.
This week’s current strength score (the trader positioning range over the past three years, measured from 0 to 100) shows the speculators are currently Bearish with a score of 48.6 percent. The commercials are Bearish with a score of 46.8 percent and the small traders (not shown in chart) are Bullish-Extreme with a score of 94.6 percent.
Price Trend-Following Model: Downtrend
Our weekly trend-following model classifies the current market price position as: Downtrend. The current action for the model is considered to be: Hold – Maintain Short Position.
| VIX Volatility Futures Statistics | SPECULATORS | COMMERCIALS | SMALL TRADERS |
| – Percent of Open Interest Longs: | 18.8 | 47.3 | 6.1 |
| – Percent of Open Interest Shorts: | 31.9 | 34.2 | 6.1 |
| – Net Position: | -61,478 | 61,231 | 247 |
| – Gross Longs: | 87,842 | 221,430 | 28,736 |
| – Gross Shorts: | 149,320 | 160,199 | 28,489 |
| – Long to Short Ratio: | 0.6 to 1 | 1.4 to 1 | 1.0 to 1 |
| NET POSITION TREND: | |||
| – Strength Index Score (3 Year Range Pct): | 48.6 | 46.8 | 94.6 |
| – Strength Index Reading (3 Year Range): | Bearish | Bearish | Bullish-Extreme |
| NET POSITION MOVEMENT INDEX: | |||
| – 6-Week Change in Strength Index: | -20.3 | 21.8 | -5.4 |
S&P500 Mini Futures:
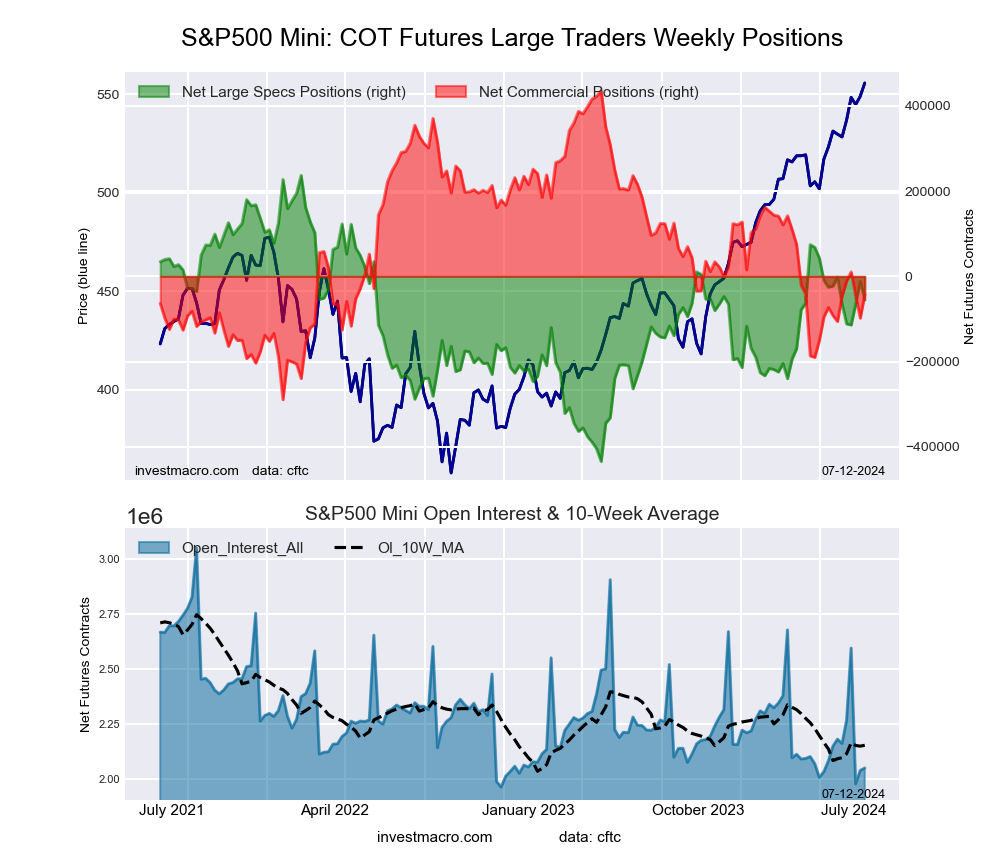 The S&P500 Mini large speculator standing this week totaled a net position of -55,011 contracts in the data reported through Tuesday. This was a weekly lowering of -43,203 contracts from the previous week which had a total of -11,808 net contracts.
This week’s current strength score (the trader positioning range over the past three years, measured from 0 to 100) shows the speculators are currently Bullish with a score of 56.5 percent. The commercials are Bearish with a score of 34.0 percent and the small traders (not shown in chart) are Bullish with a score of 77.7 percent.
Price Trend-Following Model: Strong Uptrend
Our weekly trend-following model classifies the current market price position as: Strong Uptrend. The current action for the model is considered to be: Hold – Maintain Long Position.
| S&P500 Mini Futures Statistics | SPECULATORS | COMMERCIALS | SMALL TRADERS |
| – Percent of Open Interest Longs: | 15.1 | 70.0 | 13.0 |
| – Percent of Open Interest Shorts: | 17.8 | 72.1 | 8.2 |
| – Net Position: | -55,011 | -43,078 | 98,089 |
| – Gross Longs: | 309,758 | 1,434,315 | 266,655 |
| – Gross Shorts: | 364,769 | 1,477,393 | 168,566 |
| – Long to Short Ratio: | 0.8 to 1 | 1.0 to 1 | 1.6 to 1 |
| NET POSITION TREND: | |||
| – Strength Index Score (3 Year Range Pct): | 56.5 | 34.0 | 77.7 |
| – Strength Index Reading (3 Year Range): | Bullish | Bearish | Bullish |
| NET POSITION MOVEMENT INDEX: | |||
| – 6-Week Change in Strength Index: | -7.9 | 8.7 | -4.1 |
Dow Jones Mini Futures:
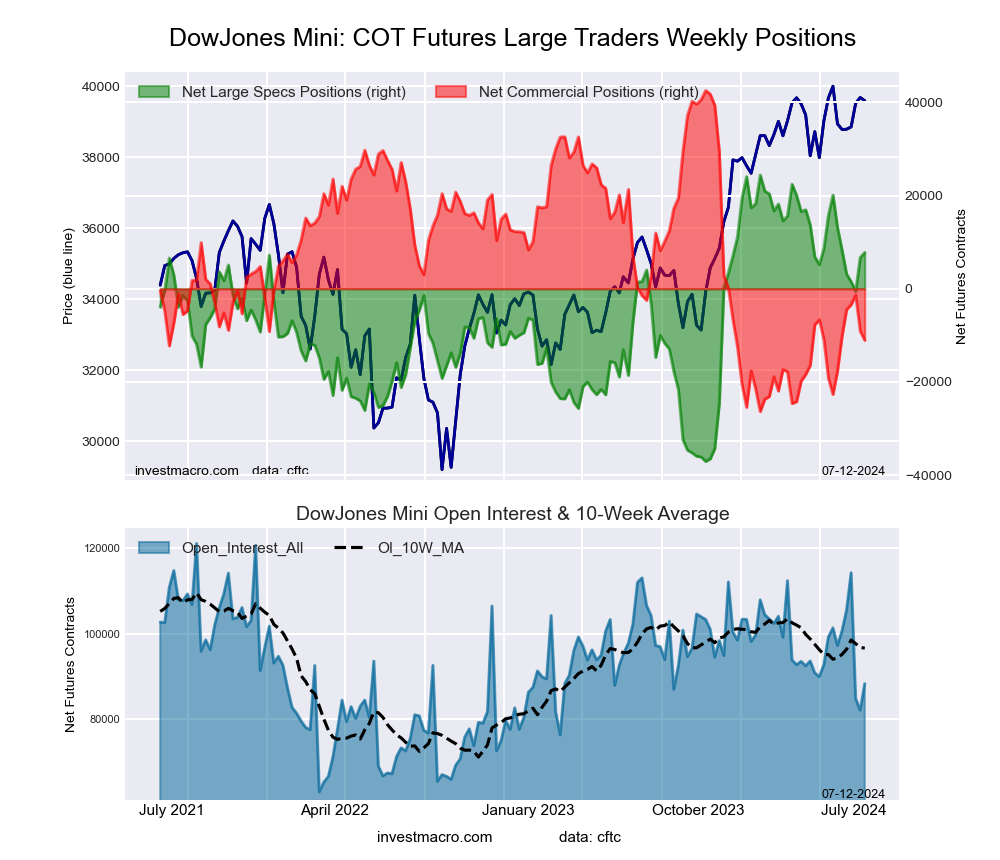 The Dow Jones Mini large speculator standing this week totaled a net position of 7,795 contracts in the data reported through Tuesday. This was a weekly boost of 1,067 contracts from the previous week which had a total of 6,728 net contracts.
This week’s current strength score (the trader positioning range over the past three years, measured from 0 to 100) shows the speculators are currently Bullish with a score of 73.0 percent. The commercials are Bearish with a score of 22.2 percent and the small traders (not shown in chart) are Bullish with a score of 64.5 percent.
Price Trend-Following Model: Strong Uptrend
Our weekly trend-following model classifies the current market price position as: Strong Uptrend. The current action for the model is considered to be: Hold – Maintain Long Position.
| Dow Jones Mini Futures Statistics | SPECULATORS | COMMERCIALS | SMALL TRADERS |
| – Percent of Open Interest Longs: | 25.3 | 55.2 | 15.3 |
| – Percent of Open Interest Shorts: | 16.4 | 67.7 | 11.6 |
| – Net Position: | 7,795 | -11,061 | 3,266 |
| – Gross Longs: | 22,317 | 48,737 | 13,525 |
| – Gross Shorts: | 14,522 | 59,798 | 10,259 |
| – Long to Short Ratio: | 1.5 to 1 | 0.8 to 1 | 1.3 to 1 |
| NET POSITION TREND: | |||
| – Strength Index Score (3 Year Range Pct): | 73.0 | 22.2 | 64.5 |
| – Strength Index Reading (3 Year Range): | Bullish | Bearish | Bullish |
| NET POSITION MOVEMENT INDEX: | |||
| – 6-Week Change in Strength Index: | -8.7 | 9.6 | -6.5 |
Nasdaq Mini Futures:
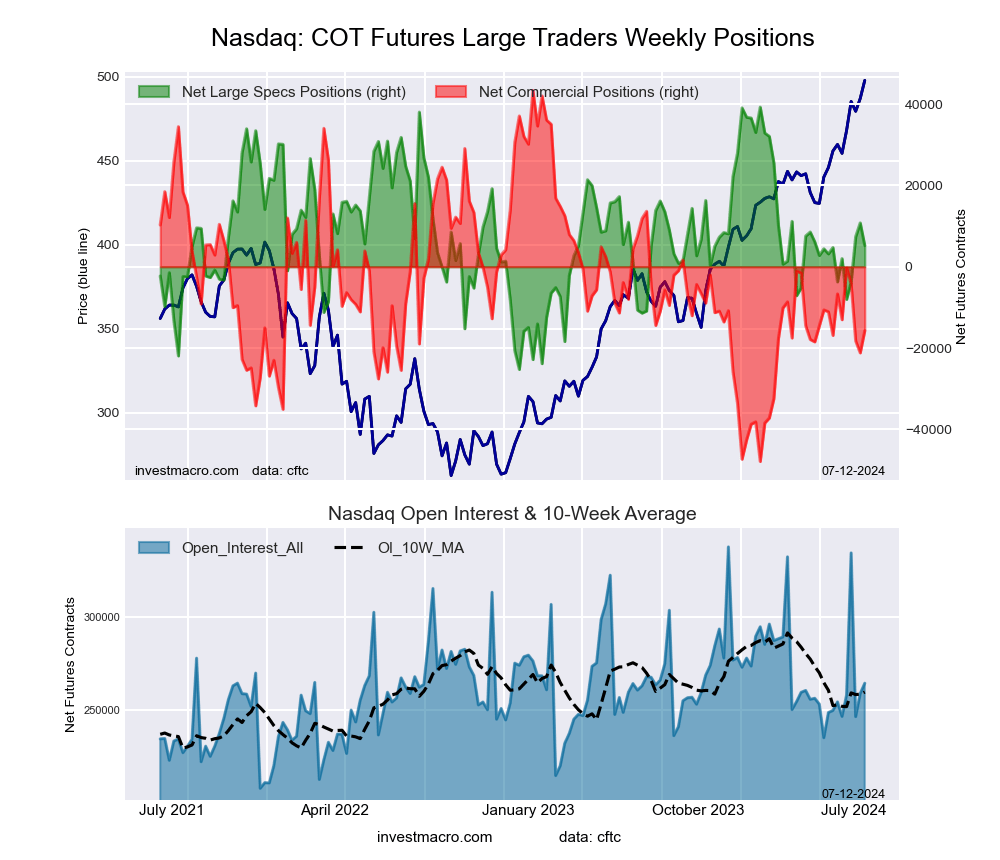 The Nasdaq Mini large speculator standing this week totaled a net position of 5,217 contracts in the data reported through Tuesday. This was a weekly fall of -5,559 contracts from the previous week which had a total of 10,776 net contracts.
This week’s current strength score (the trader positioning range over the past three years, measured from 0 to 100) shows the speculators are currently Bearish with a score of 47.2 percent. The commercials are Bearish with a score of 35.3 percent and the small traders (not shown in chart) are Bullish-Extreme with a score of 95.5 percent.
Price Trend-Following Model: Strong Uptrend
Our weekly trend-following model classifies the current market price position as: Strong Uptrend. The current action for the model is considered to be: Hold – Maintain Long Position.
| Nasdaq Mini Futures Statistics | SPECULATORS | COMMERCIALS | SMALL TRADERS |
| – Percent of Open Interest Longs: | 25.1 | 56.1 | 16.1 |
| – Percent of Open Interest Shorts: | 23.1 | 62.0 | 12.1 |
| – Net Position: | 5,217 | -15,719 | 10,502 |
| – Gross Longs: | 66,337 | 148,257 | 42,436 |
| – Gross Shorts: | 61,120 | 163,976 | 31,934 |
| – Long to Short Ratio: | 1.1 to 1 | 0.9 to 1 | 1.3 to 1 |
| NET POSITION TREND: | |||
| – Strength Index Score (3 Year Range Pct): | 47.2 | 35.3 | 95.5 |
| – Strength Index Reading (3 Year Range): | Bearish | Bearish | Bullish-Extreme |
| NET POSITION MOVEMENT INDEX: | |||
| – 6-Week Change in Strength Index: | 13.9 | -9.9 | 0.2 |
Russell 2000 Mini Futures:
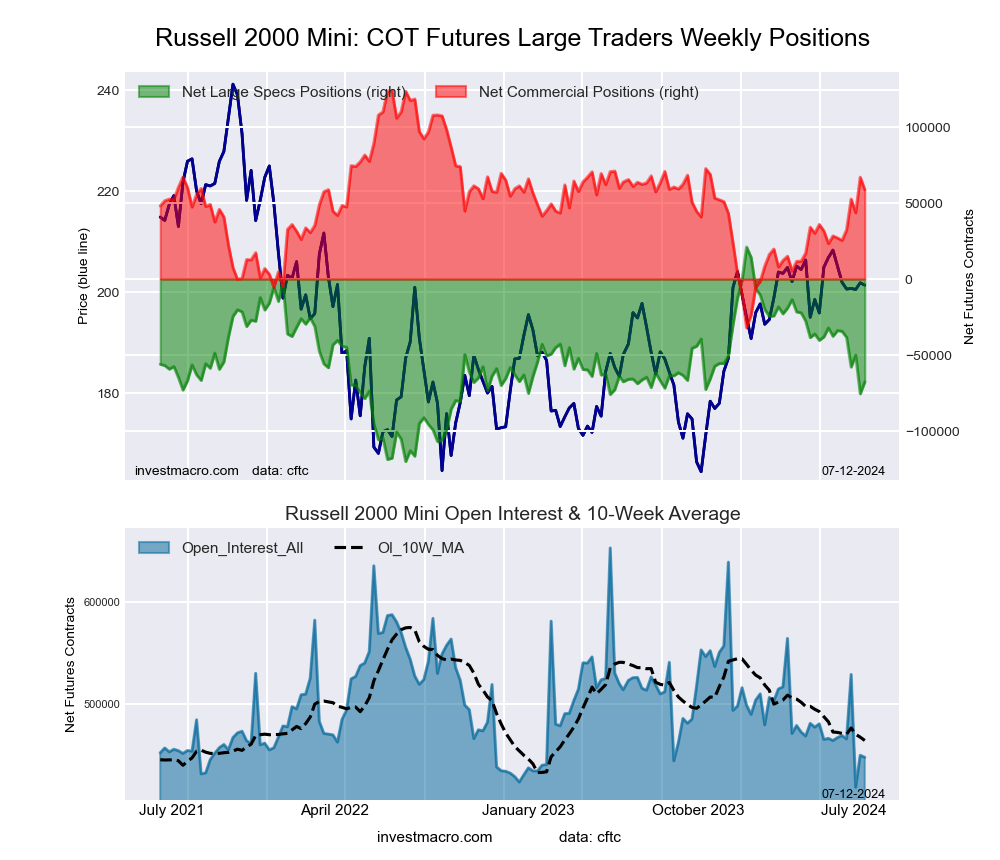 The Russell 2000 Mini large speculator standing this week totaled a net position of -67,626 contracts in the data reported through Tuesday. This was a weekly rise of 7,809 contracts from the previous week which had a total of -75,435 net contracts.
This week’s current strength score (the trader positioning range over the past three years, measured from 0 to 100) shows the speculators are currently Bearish with a score of 37.1 percent. The commercials are Bullish with a score of 58.2 percent and the small traders (not shown in chart) are Bullish with a score of 58.8 percent.
Price Trend-Following Model: Weak Downtrend
Our weekly trend-following model classifies the current market price position as: Weak Downtrend. The current action for the model is considered to be: Hold – Maintain Short Position.
| Russell 2000 Mini Futures Statistics | SPECULATORS | COMMERCIALS | SMALL TRADERS |
| – Percent of Open Interest Longs: | 12.4 | 79.6 | 6.1 |
| – Percent of Open Interest Shorts: | 27.5 | 66.5 | 4.1 |
| – Net Position: | -67,626 | 58,789 | 8,837 |
| – Gross Longs: | 55,367 | 356,460 | 27,196 |
| – Gross Shorts: | 122,993 | 297,671 | 18,359 |
| – Long to Short Ratio: | 0.5 to 1 | 1.2 to 1 | 1.5 to 1 |
| NET POSITION TREND: | |||
| – Strength Index Score (3 Year Range Pct): | 37.1 | 58.2 | 58.8 |
| – Strength Index Reading (3 Year Range): | Bearish | Bullish | Bullish |
| NET POSITION MOVEMENT INDEX: | |||
| – 6-Week Change in Strength Index: | -24.0 | 20.4 | 6.8 |
Nikkei Stock Average (USD) Futures:
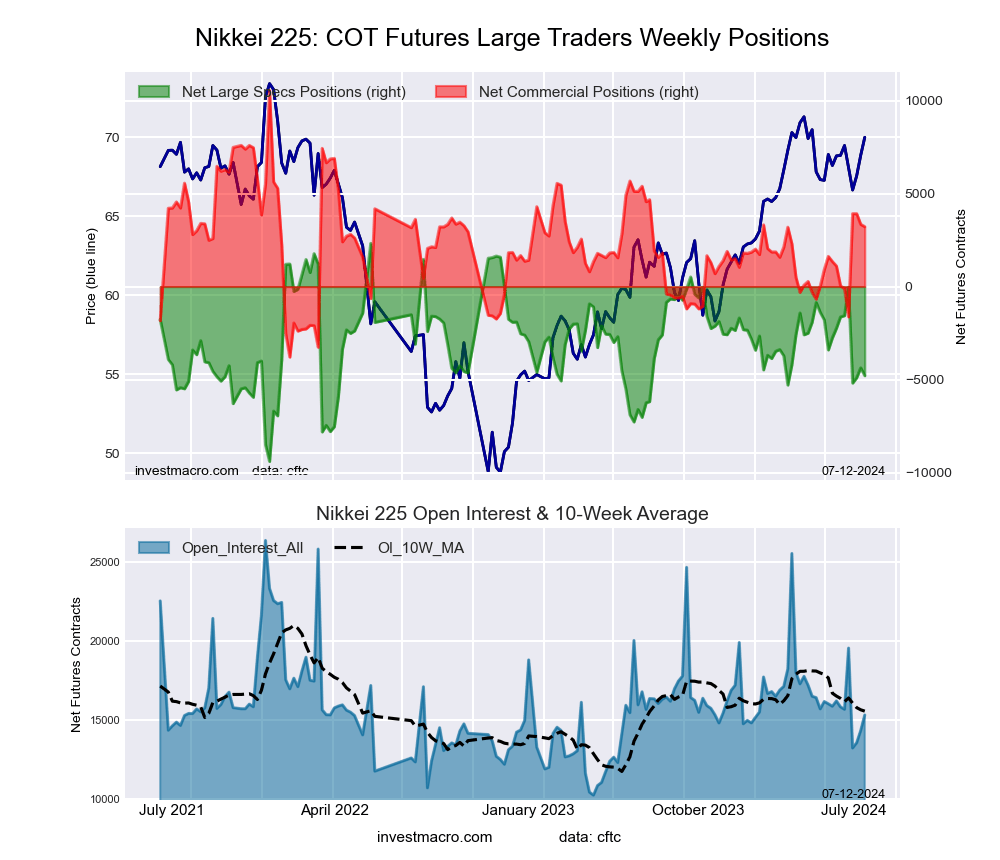 The Nikkei Stock Average (USD) large speculator standing this week totaled a net position of -4,792 contracts in the data reported through Tuesday. This was a weekly decrease of -423 contracts from the previous week which had a total of -4,369 net contracts.
This week’s current strength score (the trader positioning range over the past three years, measured from 0 to 100) shows the speculators are currently Bearish with a score of 39.3 percent. The commercials are Bearish with a score of 48.9 percent and the small traders (not shown in chart) are Bullish with a score of 65.4 percent.
Price Trend-Following Model: Weak Downtrend
Our weekly trend-following model classifies the current market price position as: Weak Downtrend. The current action for the model is considered to be: Hold – Maintain Short Position.
| Nikkei Stock Average Futures Statistics | SPECULATORS | COMMERCIALS | SMALL TRADERS |
| – Percent of Open Interest Longs: | 6.0 | 65.5 | 28.5 |
| – Percent of Open Interest Shorts: | 37.3 | 44.5 | 18.2 |
| – Net Position: | -4,792 | 3,218 | 1,574 |
| – Gross Longs: | 925 | 10,030 | 4,358 |
| – Gross Shorts: | 5,717 | 6,812 | 2,784 |
| – Long to Short Ratio: | 0.2 to 1 | 1.5 to 1 | 1.6 to 1 |
| NET POSITION TREND: | |||
| – Strength Index Score (3 Year Range Pct): | 39.3 | 48.9 | 65.4 |
| – Strength Index Reading (3 Year Range): | Bearish | Bearish | Bullish |
| NET POSITION MOVEMENT INDEX: | |||
| – 6-Week Change in Strength Index: | -26.9 | 22.1 | -0.2 |
MSCI EAFE Mini Futures:
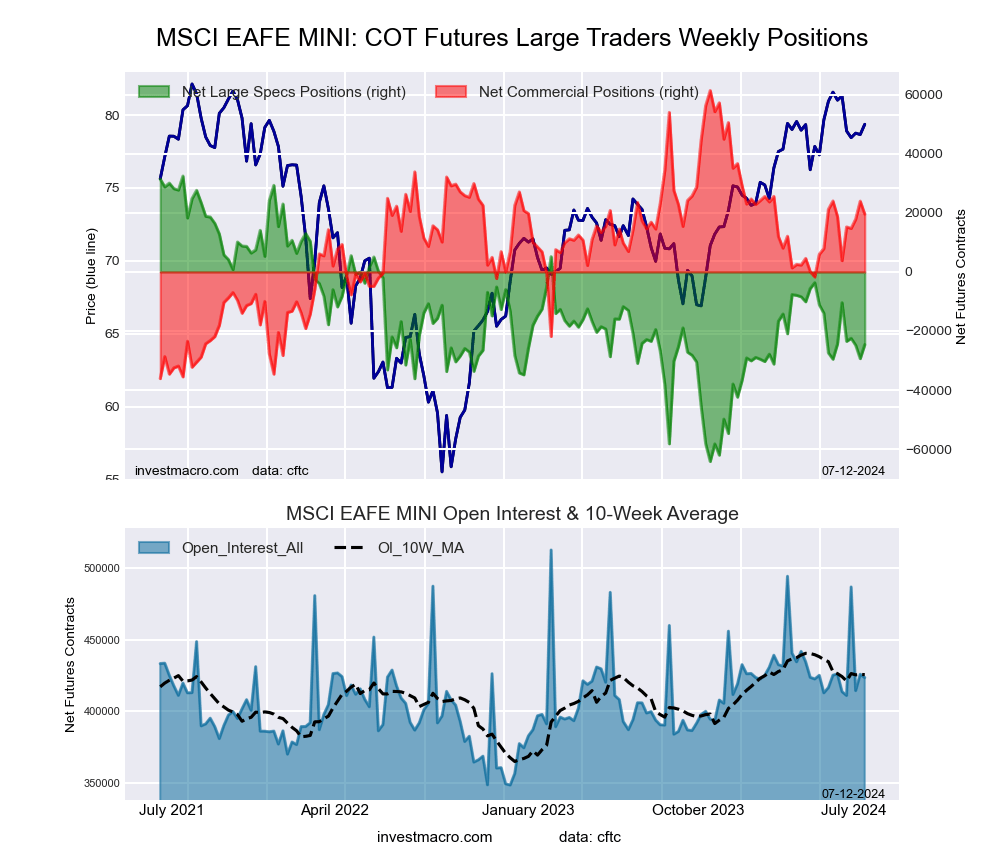 The MSCI EAFE Mini large speculator standing this week totaled a net position of -24,608 contracts in the data reported through Tuesday. This was a weekly lift of 4,742 contracts from the previous week which had a total of -29,350 net contracts.
This week’s current strength score (the trader positioning range over the past three years, measured from 0 to 100) shows the speculators are currently Bearish with a score of 40.9 percent. The commercials are Bullish with a score of 57.1 percent and the small traders (not shown in chart) are Bearish with a score of 42.1 percent.
Price Trend-Following Model: Strong Uptrend
Our weekly trend-following model classifies the current market price position as: Strong Uptrend. The current action for the model is considered to be: Hold – Maintain Long Position.
| MSCI EAFE Mini Futures Statistics | SPECULATORS | COMMERCIALS | SMALL TRADERS |
| – Percent of Open Interest Longs: | 7.3 | 89.4 | 3.0 |
| – Percent of Open Interest Shorts: | 13.1 | 84.8 | 1.8 |
| – Net Position: | -24,608 | 19,568 | 5,040 |
| – Gross Longs: | 31,004 | 378,665 | 12,714 |
| – Gross Shorts: | 55,612 | 359,097 | 7,674 |
| – Long to Short Ratio: | 0.6 to 1 | 1.1 to 1 | 1.7 to 1 |
| NET POSITION TREND: | |||
| – Strength Index Score (3 Year Range Pct): | 40.9 | 57.1 | 42.1 |
| – Strength Index Reading (3 Year Range): | Bearish | Bullish | Bearish |
| NET POSITION MOVEMENT INDEX: | |||
| – 6-Week Change in Strength Index: | -0.2 | 0.8 | -2.9 |
Article By InvestMacro – Receive our weekly COT Newsletter
*COT Report: The COT data, released weekly to the public each Friday, is updated through the most recent Tuesday (data is 3 days old) and shows a quick view of how large speculators or non-commercials (for-profit traders) were positioned in the futures markets.
The CFTC categorizes trader positions according to commercial hedgers (traders who use futures contracts for hedging as part of the business), non-commercials (large traders who speculate to realize trading profits) and nonreportable traders (usually small traders/speculators) as well as their open interest (contracts open in the market at time of reporting). See CFTC criteria here.

- The ceasefire between Israel and Lebanon has reduced the geopolitical premium Jun 5, 2026
- EUR/USD: All Eyes on Non-Farm Payrolls Jun 5, 2026
- The escalation of the conflict in the Middle East put pressure on US and European stock indices Jun 4, 2026
- Gold Remains Under Pressure, but a Rebound Is Still Possible Jun 4, 2026
- Bitcoin drops below the psychological $70,000 level. The US stock indices hit new record highs Jun 3, 2026
- EUR/USD on Edge as Markets Await Key Employment Data Jun 3, 2026
- Oil prices surged again amid rumors of a freeze in diplomacy between the United States and Iran Jun 2, 2026
- GBP/USD in a State of Uncertainty: Risks Remain, but Market Reactions Are Muted Jun 2, 2026
- The US stock indices once again finished the trading session at new all‑time highs Jun 1, 2026
- USD/JPY Approaches 160.00: Is Another Intervention Coming? Jun 1, 2026