
By Orbex
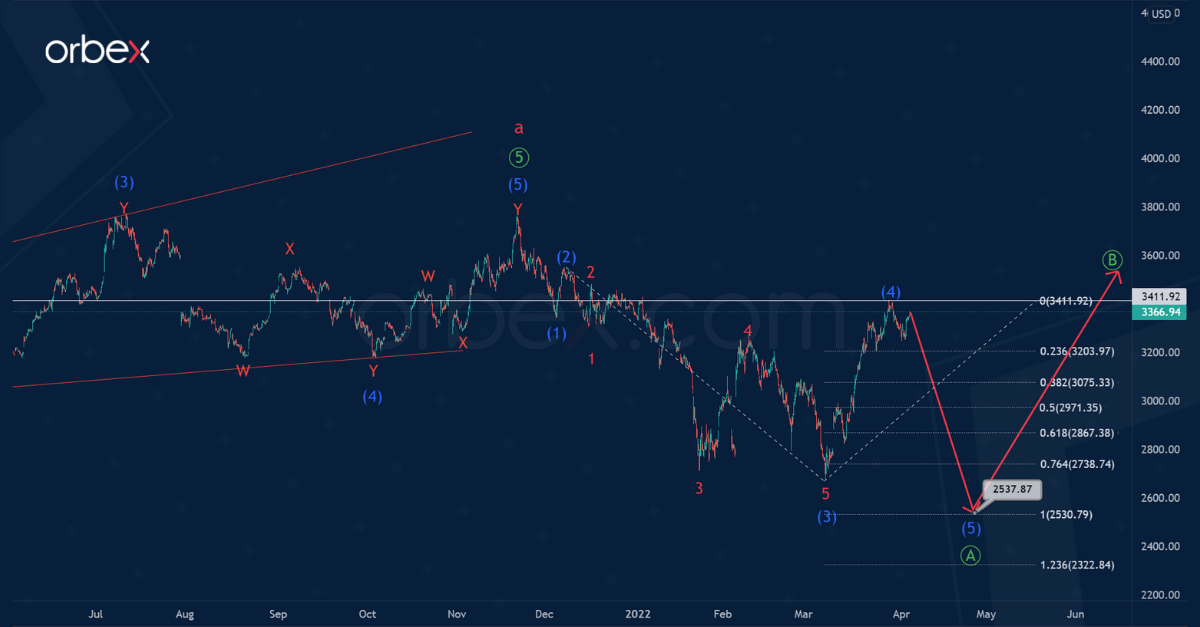
The current AMZN structure suggests the construction of a simple zigzag consisting of sub-waves a-b-c of the cycle degree.
The first major wave a, which includes primary sub-waves ①-②-③-④-⑤, has ended. In the last section of the chart, there is a decrease in the price, which could indicate the beginning of the construction of a bearish correction b. This correction could take the standard zigzag shape Ⓐ-Ⓑ-Ⓒ.
In the near future, there could be a decrease in the final intermediate wave (5), which can end the primary impulse wave Ⓐ near 2537.87. At that level, wave (5) will be equal to the previous impulse (3).
After the primary impulse wave Ⓐ ends, the stock price will begin to rise in correction Ⓑ, as shown on the chart.
Free Reports:
 Sign Up for Our Stock Market Newsletter – Get updated on News, Charts & Rankings of Public Companies when you join our Stocks Newsletter
 Get our Weekly Commitment of Traders Reports - See where the biggest traders (Hedge Funds and Commercial Hedgers) are positioned in the futures markets on a weekly basis.
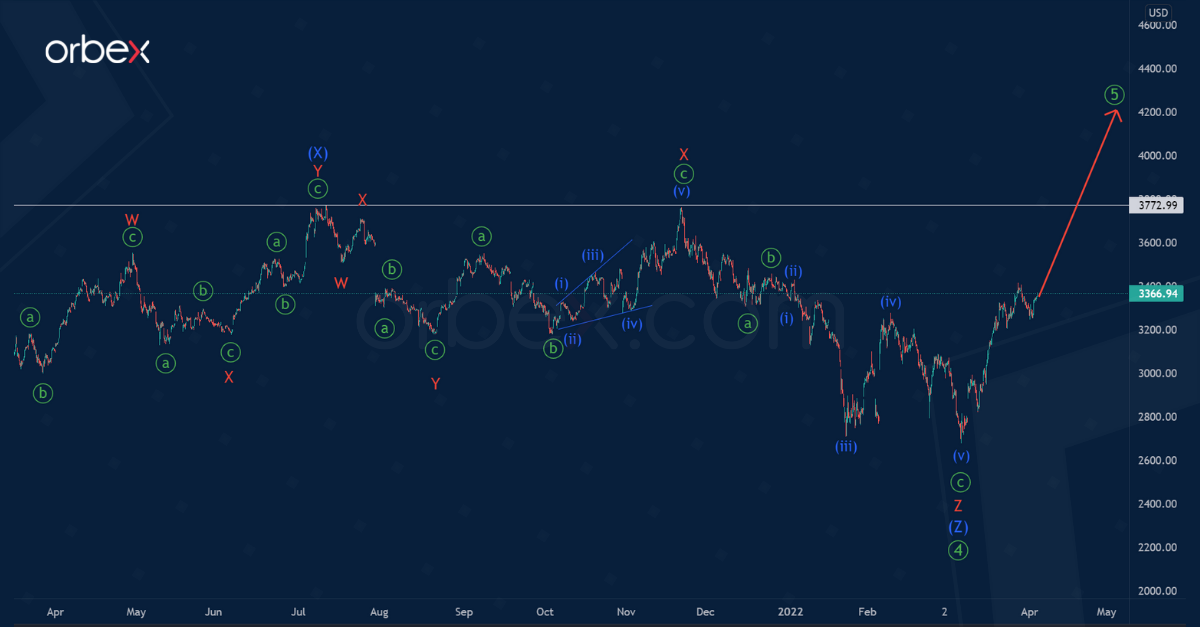
Alternatively, the cycle impulse wave a could still be in the formation stage. Perhaps the construction of the primary correction ④ has recently ended.
On the current chart, we see the final part of this correction. It took the form of an intermediate triple (W)-(X)-(Y)-(X)-(Z) zigzag.
The market will start moving upwards within the final wave ⑤ of the primary degree.
Most likely, prices will rise in price significantly above the high of 3772.99. This is marked by the minor intervening wave X.
Join our responsible trading community – Open your Orbex account now!
![]() Article by Orbex
Article by Orbex
Orbex is a fully licensed broker that was established in 2011. Founded with a mission to serve its traders responsibly and provides traders with access to the world’s largest and most liquid financial markets. www.orbex.com

- EUR/USD: The Advantage Remains with the Dollar Jun 29, 2026
- Escalation of the US–Iran conflict is once again supporting the rise in oil prices Jun 29, 2026
- Oil prices fall back to pre‑war levels. Silver drops to a 7‑month low Jun 25, 2026
- Gold Falls to an Eight-Month Low: This May Not Be the Bottom Jun 25, 2026
- Stock indices came under heavy selling pressure amid growing skepticism about AI investments Jun 24, 2026
- The Pound Is Pressured Not by Politics, but by a Strong US Dollar Jun 24, 2026
- Global crude oil prices continued to decline. The AUD/USD exchange rate hit an 11‑week low Jun 23, 2026
- EUR/USD Remains Under Sellers’ Control as the Dollar Stays Strong Jun 23, 2026
- Gold Falls for the Third Consecutive Week: Is There Still Upside Potential? Jun 22, 2026
- Bank Indonesia raised its interest rate. Norges Bank and the SNB left rates unchanged Jun 19, 2026