
By InvestMacro | COT | Data Tables | COT Leaders | Downloads | COT Newsletter
Here are the latest charts and statistics for the Commitment of Traders (COT) data published by the Commodities Futures Trading Commission (CFTC). The latest COT data is updated through Tuesday December 14th 2021 and shows a quick view of how large traders (for-profit speculators and commercial entities) were positioned in the futures markets.
Highlighting this week’s COT metals data is the weakness in the Gold futures bets. The speculative net position in the Gold futures fell sharply this week and dropped for a fourth consecutive week. These declines have now shed a total of -57,379 contracts off the bullish position in just the past four weeks time-frame. This has brought the overall net bullish position for Gold futures to the lowest level of the past eight weeks.
All of the metals markets were cover fell this week with Gold (-14,784 contracts) leading the way and joined by Silver (-7,849 contracts), Copper (-507 contracts), Platinum (-2,331 contracts) and Palladium (-1,043 contracts).
| Dec-14-2021 | OI | OI-Index | Spec-Net | Spec-Index | Com-Net | COM-Index | Smalls-Net | Smalls-Index |
|---|---|---|---|---|---|---|---|---|
| WTI Crude | 1,953,397 | 0 | 347,137 | 22 | -385,527 | 67 | 38,390 | 69 |
| Gold | 503,709 | 20 | 202,401 | 52 | -231,411 | 47 | 29,010 | 47 |
| Silver | 142,384 | 9 | 21,984 | 44 | -35,855 | 64 | 13,871 | 21 |
| Copper | 171,976 | 6 | 6,697 | 47 | -13,108 | 50 | 6,411 | 62 |
| Palladium | 10,098 | 16 | -3,774 | 0 | 4,125 | 100 | -351 | 24 |
| Platinum | 66,300 | 32 | 3,731 | 8 | -9,661 | 95 | 5,930 | 45 |
| Natural Gas | 1,153,450 | 7 | -130,226 | 39 | 99,238 | 62 | 30,988 | 57 |
| Brent | 217,274 | 53 | -23,610 | 78 | 20,030 | 22 | 3,580 | 58 |
| Heating Oil | 304,130 | 3 | 4,723 | 49 | -20,481 | 49 | 15,758 | 53 |
| Soybeans | 647,243 | 9 | 63,221 | 46 | -27,165 | 59 | -36,056 | 12 |
| Corn | 1,459,289 | 14 | 426,621 | 85 | -381,897 | 18 | -44,724 | 17 |
| Coffee | 260,063 | 29 | 60,308 | 92 | -63,167 | 10 | 2,859 | 8 |
| Sugar | 874,996 | 12 | 216,463 | 81 | -251,878 | 20 | 35,415 | 52 |
| Wheat | 361,469 | 14 | 11,965 | 57 | -5,152 | 36 | -6,813 | 69 |
Gold Comex Futures:
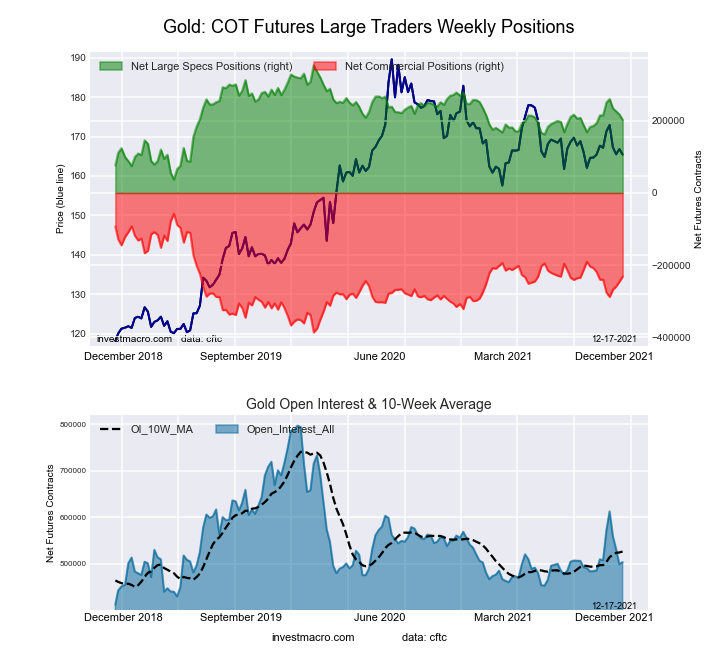 The Gold Comex Futures large speculator standing this week recorded a net position of 202,401 contracts in the data reported through Tuesday. This was a weekly decrease of -14,784 contracts from the previous week which had a total of 217,185 net contracts.
Free Reports:
 Download Our Metatrader 4 Indicators – Put Our Free MetaTrader 4 Custom Indicators on your charts when you join our Weekly Newsletter
 Get our Weekly Commitment of Traders Reports - See where the biggest traders (Hedge Funds and Commercial Hedgers) are positioned in the futures markets on a weekly basis.
This week’s current strength score (the trader positioning range over the past three years, measured from 0 to 100) shows the speculators are currently Bullish with a score of 52.2 percent. The commercials are Bearish with a score of 47.0 percent and the small traders (not shown in chart) are Bearish with a score of 46.5 percent.
| Gold Futures Statistics | SPECULATORS | COMMERCIALS | SMALL TRADERS |
| – Percent of Open Interest Longs: | 59.2 | 21.3 | 9.7 |
| – Percent of Open Interest Shorts: | 19.0 | 67.3 | 3.9 |
| – Net Position: | 202,401 | -231,411 | 29,010 |
| – Gross Longs: | 298,142 | 107,421 | 48,697 |
| – Gross Shorts: | 95,741 | 338,832 | 19,687 |
| – Long to Short Ratio: | 3.1 to 1 | 0.3 to 1 | 2.5 to 1 |
| NET POSITION TREND: | |||
| – Strength Index Score (3 Year Range Pct): | 52.2 | 47.0 | 46.5 |
| – Strength Index Reading (3 Year Range): | Bullish | Bearish | Bearish |
| NET POSITION MOVEMENT INDEX: | |||
| – 6-Week Change in Strength Index: | -4.0 | 2.6 | 12.1 |
Silver Comex Futures:
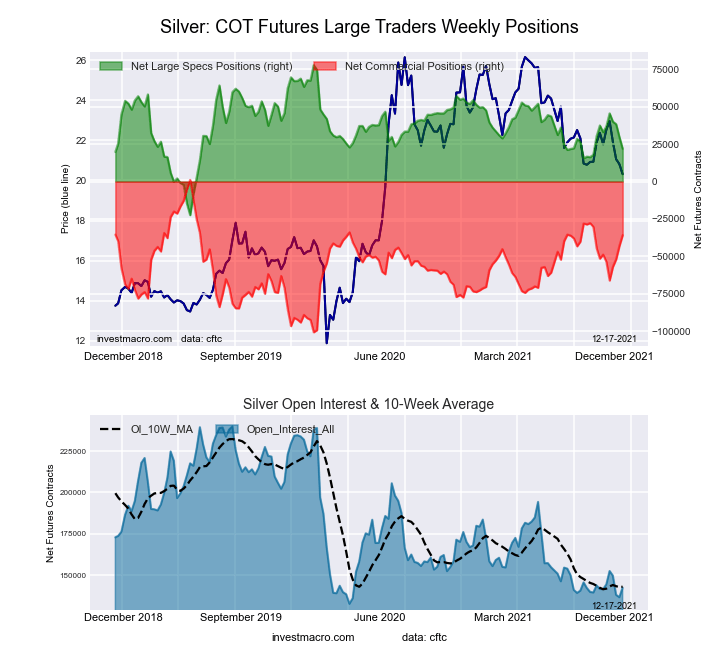 The Silver Comex Futures large speculator standing this week recorded a net position of 21,984 contracts in the data reported through Tuesday. This was a weekly fall of -7,849 contracts from the previous week which had a total of 29,833 net contracts.
This week’s current strength score (the trader positioning range over the past three years, measured from 0 to 100) shows the speculators are currently Bearish with a score of 44.3 percent. The commercials are Bullish with a score of 63.7 percent and the small traders (not shown in chart) are Bearish with a score of 20.8 percent.
| Silver Futures Statistics | SPECULATORS | COMMERCIALS | SMALL TRADERS |
| – Percent of Open Interest Longs: | 44.7 | 30.5 | 18.8 |
| – Percent of Open Interest Shorts: | 29.3 | 55.7 | 9.1 |
| – Net Position: | 21,984 | -35,855 | 13,871 |
| – Gross Longs: | 63,669 | 43,477 | 26,796 |
| – Gross Shorts: | 41,685 | 79,332 | 12,925 |
| – Long to Short Ratio: | 1.5 to 1 | 0.5 to 1 | 2.1 to 1 |
| NET POSITION TREND: | |||
| – Strength Index Score (3 Year Range Pct): | 44.3 | 63.7 | 20.8 |
| – Strength Index Reading (3 Year Range): | Bearish | Bullish | Bearish |
| NET POSITION MOVEMENT INDEX: | |||
| – 6-Week Change in Strength Index: | -11.1 | 12.8 | -11.3 |
Copper Grade #1 Futures:
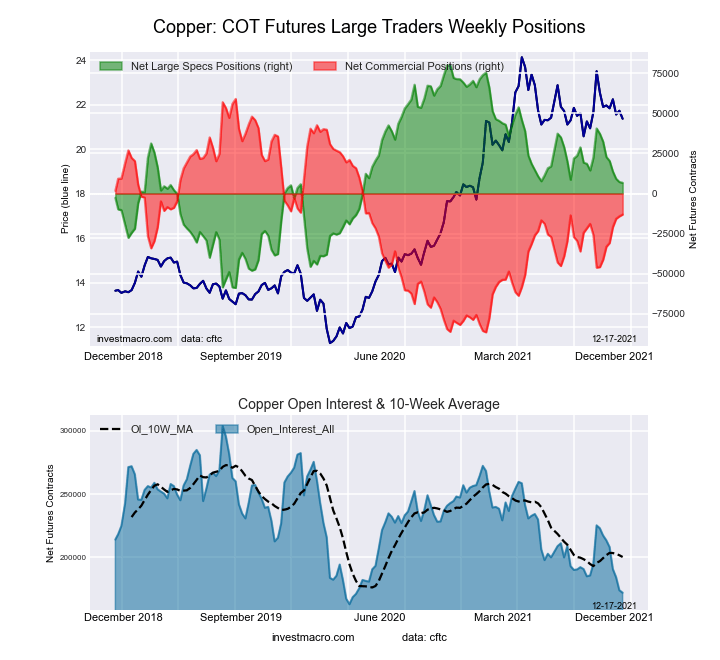 The Copper Grade #1 Futures large speculator standing this week recorded a net position of 6,697 contracts in the data reported through Tuesday. This was a weekly lowering of -507 contracts from the previous week which had a total of 7,204 net contracts.
This week’s current strength score (the trader positioning range over the past three years, measured from 0 to 100) shows the speculators are currently Bearish with a score of 47.2 percent. The commercials are Bullish with a score of 50.4 percent and the small traders (not shown in chart) are Bullish with a score of 62.4 percent.
| Copper Futures Statistics | SPECULATORS | COMMERCIALS | SMALL TRADERS |
| – Percent of Open Interest Longs: | 36.6 | 43.9 | 10.1 |
| – Percent of Open Interest Shorts: | 32.7 | 51.6 | 6.4 |
| – Net Position: | 6,697 | -13,108 | 6,411 |
| – Gross Longs: | 62,990 | 75,561 | 17,403 |
| – Gross Shorts: | 56,293 | 88,669 | 10,992 |
| – Long to Short Ratio: | 1.1 to 1 | 0.9 to 1 | 1.6 to 1 |
| NET POSITION TREND: | |||
| – Strength Index Score (3 Year Range Pct): | 47.2 | 50.4 | 62.4 |
| – Strength Index Reading (3 Year Range): | Bearish | Bullish | Bullish |
| NET POSITION MOVEMENT INDEX: | |||
| – 6-Week Change in Strength Index: | -18.5 | 19.4 | -14.7 |
Platinum Futures:
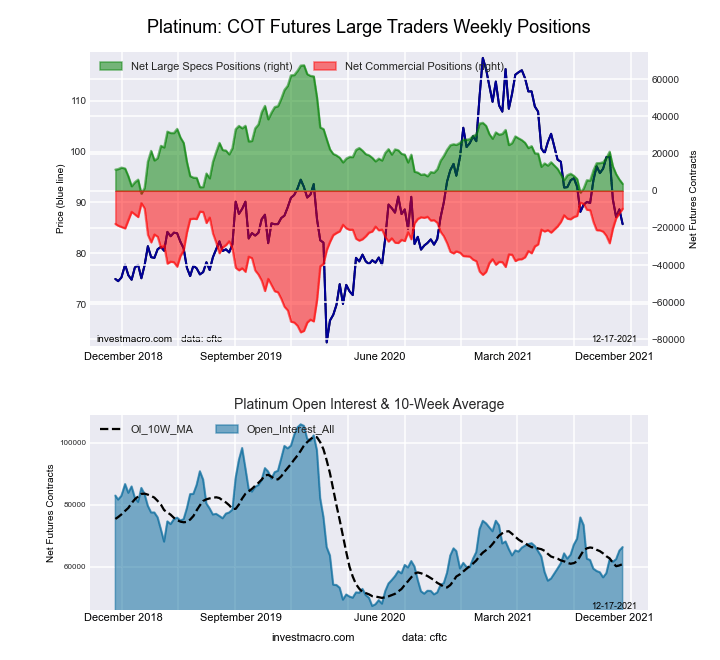 The Platinum Futures large speculator standing this week recorded a net position of 3,731 contracts in the data reported through Tuesday. This was a weekly lowering of -2,331 contracts from the previous week which had a total of 6,062 net contracts.
This week’s current strength score (the trader positioning range over the past three years, measured from 0 to 100) shows the speculators are currently Bearish-Extreme with a score of 7.7 percent. The commercials are Bullish-Extreme with a score of 95.3 percent and the small traders (not shown in chart) are Bearish with a score of 44.7 percent.
| Platinum Futures Statistics | SPECULATORS | COMMERCIALS | SMALL TRADERS |
| – Percent of Open Interest Longs: | 42.0 | 38.7 | 14.8 |
| – Percent of Open Interest Shorts: | 36.4 | 53.3 | 5.8 |
| – Net Position: | 3,731 | -9,661 | 5,930 |
| – Gross Longs: | 27,853 | 25,655 | 9,781 |
| – Gross Shorts: | 24,122 | 35,316 | 3,851 |
| – Long to Short Ratio: | 1.2 to 1 | 0.7 to 1 | 2.5 to 1 |
| NET POSITION TREND: | |||
| – Strength Index Score (3 Year Range Pct): | 7.7 | 95.3 | 44.7 |
| – Strength Index Reading (3 Year Range): | Bearish-Extreme | Bullish-Extreme | Bearish |
| NET POSITION MOVEMENT INDEX: | |||
| – 6-Week Change in Strength Index: | -16.8 | 17.6 | -9.4 |
Palladium Futures:
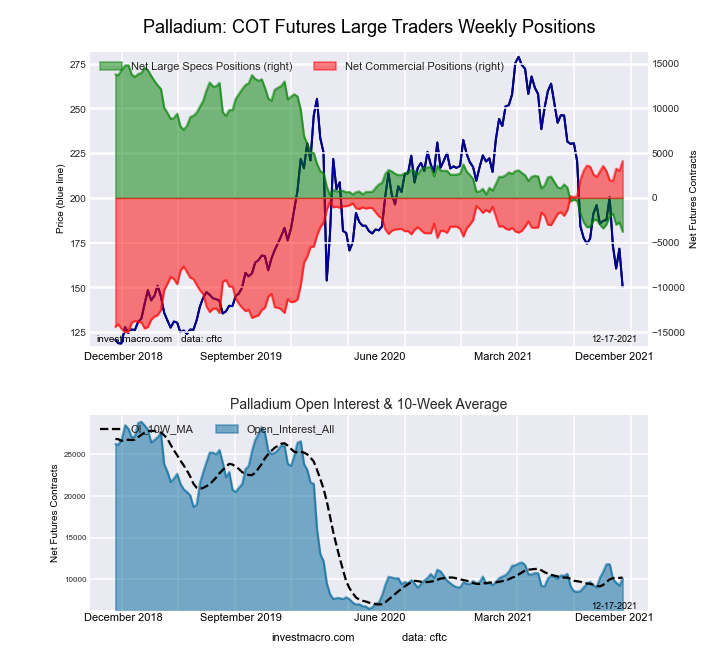 The Palladium Futures large speculator standing this week recorded a net position of -3,774 contracts in the data reported through Tuesday. This was a weekly reduction of -1,043 contracts from the previous week which had a total of -2,731 net contracts.
This week’s current strength score (the trader positioning range over the past three years, measured from 0 to 100) shows the speculators are currently Bearish-Extreme with a score of 0.0 percent. The commercials are Bullish-Extreme with a score of 100.0 percent and the small traders (not shown in chart) are Bearish with a score of 24.0 percent.
| Palladium Futures Statistics | SPECULATORS | COMMERCIALS | SMALL TRADERS |
| – Percent of Open Interest Longs: | 26.1 | 59.2 | 12.4 |
| – Percent of Open Interest Shorts: | 63.5 | 18.3 | 15.9 |
| – Net Position: | -3,774 | 4,125 | -351 |
| – Gross Longs: | 2,637 | 5,973 | 1,256 |
| – Gross Shorts: | 6,411 | 1,848 | 1,607 |
| – Long to Short Ratio: | 0.4 to 1 | 3.2 to 1 | 0.8 to 1 |
| NET POSITION TREND: | |||
| – Strength Index Score (3 Year Range Pct): | 0.0 | 100.0 | 24.0 |
| – Strength Index Reading (3 Year Range): | Bearish-Extreme | Bullish-Extreme | Bearish |
| NET POSITION MOVEMENT INDEX: | |||
| – 6-Week Change in Strength Index: | -2.1 | 2.9 | -9.9 |
Article By InvestMacro – Receive our weekly COT Reports by Email
*COT Report: The COT data, released weekly to the public each Friday, is updated through the most recent Tuesday (data is 3 days old) and shows a quick view of how large speculators or non-commercials (for-profit traders) were positioned in the futures markets.
The CFTC categorizes trader positions according to commercial hedgers (traders who use futures contracts for hedging as part of the business), non-commercials (large traders who speculate to realize trading profits) and nonreportable traders (usually small traders/speculators) as well as their open interest (contracts open in the market at time of reporting).See CFTC criteria here.

- The US Tech sector hit by sell‑off. Oil prices decline on renewed negotiations Jul 28, 2026
- Gold Declines, Focus on Fed and Falling Oil Prices Jul 28, 2026
- This week will be one of the most crowded for central‑bank meetings Jul 27, 2026
- EUR/USD Ahead of a Key Week: Holding Near Lows Jul 27, 2026
- COT Metals Charts: Weekly Speculator Changes led by Copper Jul 26, 2026
- COT Bonds Charts: Speculator Bets led by SOFR 3-Months & 5-Year Bonds Jul 26, 2026
- COT Energy Charts: Weekly Speculator Bets led by WTI Crude & Natural Gas Jul 26, 2026
- COT Soft Commodities Charts: Weekly Speculator Bets led by Corn & Soybeans Jul 26, 2026
- The US introduces new import tariffs for 60 countries. Brent crude surpasses $100 per barrel Jul 24, 2026
- USD/JPY Breaks Records: Nothing Slows the Yen’s Decline Jul 24, 2026