
Article By RoboForex.com
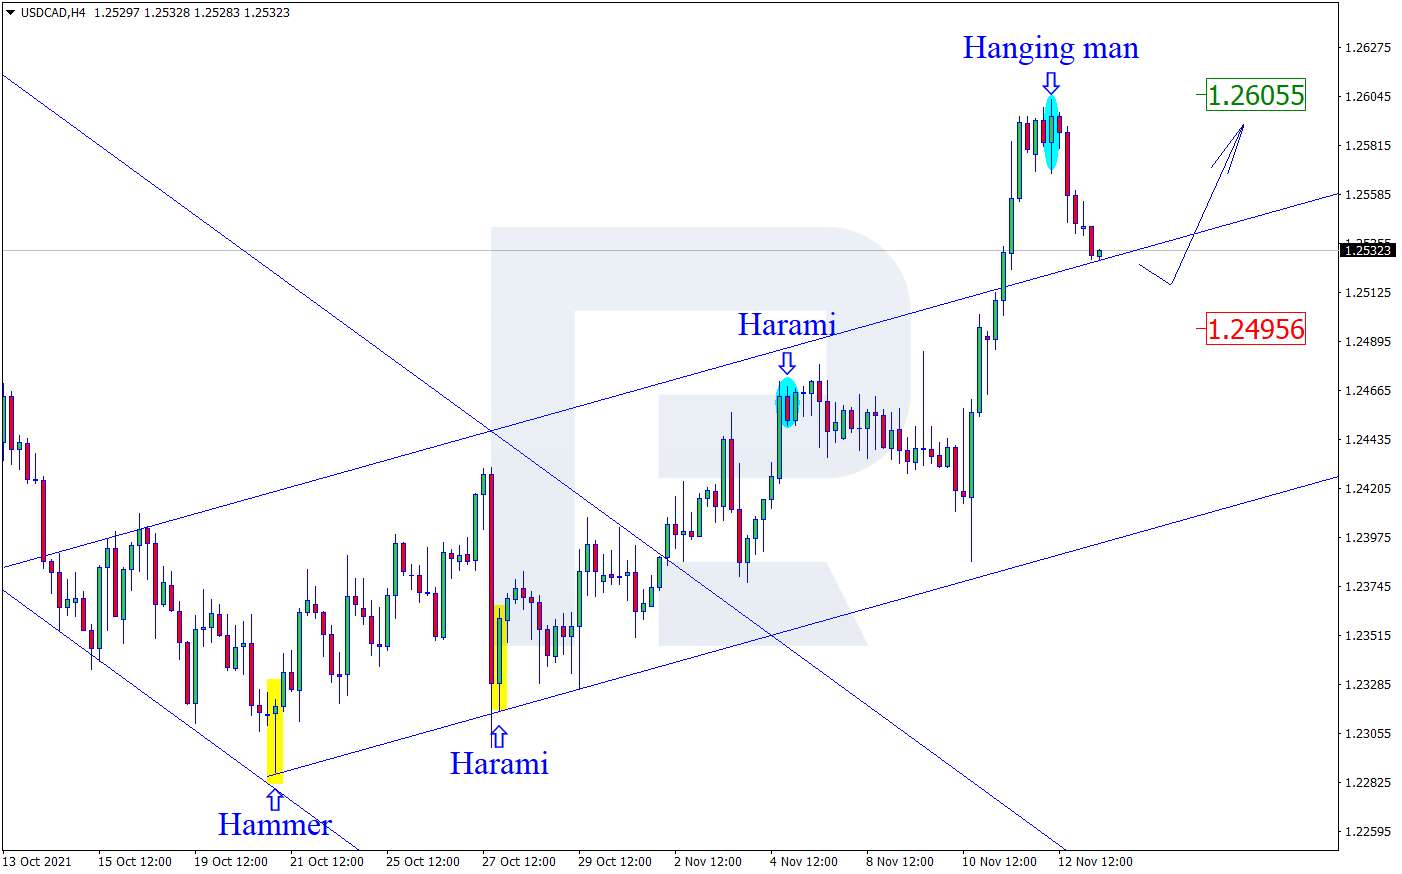
USDCAD, “US Dollar vs Canadian Dollar”
As we can see in the H4 chart, after forming several reversal patterns, including Hanging Man, close to the resistance level, USDCAD is reversing in the form of a new decline. In this case, the downside target may be the support area at 1.2495. However, an alternative scenario implies that the asset may continue growing to reach 1.2605 without testing the support area.

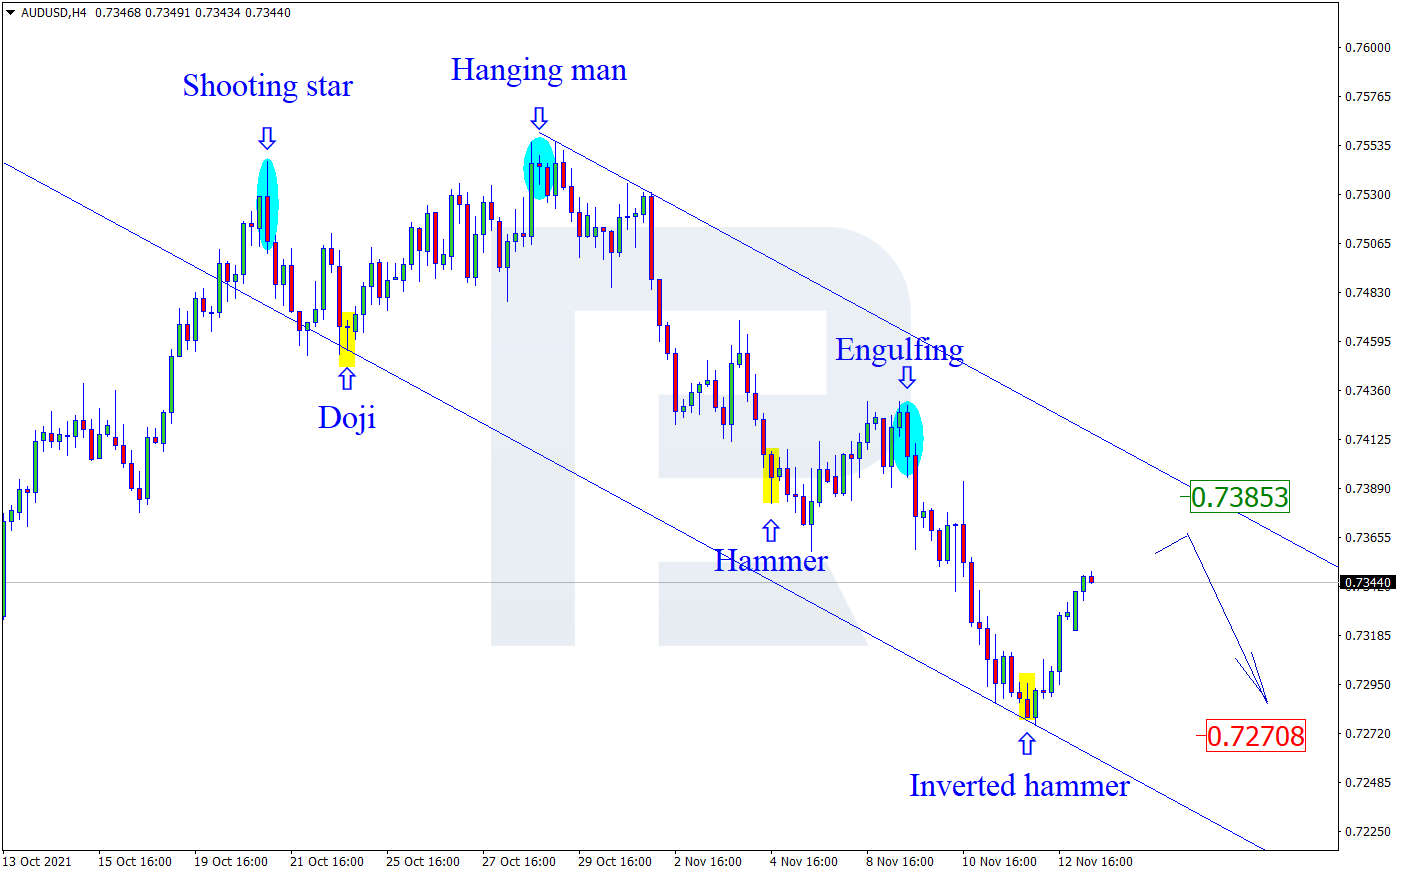
AUDUSD, “Australian Dollar vs US Dollar”
As we can see in the H4 chart, AUDUSD has formed several reversal patterns, such as Inverted Hammer, near the support level. At the moment, the asset is reversing in the form of a new correctional wave. In this case, the target may be the resistance area at 0.7385. At the same time, an opposite scenario implies that the price may continue falling to reach 0.7270 without testing the channel’s upside border.
Free Reports:
 Get our Weekly Commitment of Traders Reports - See where the biggest traders (Hedge Funds and Commercial Hedgers) are positioned in the futures markets on a weekly basis.
 Sign Up for Our Stock Market Newsletter – Get updated on News, Charts & Rankings of Public Companies when you join our Stocks Newsletter
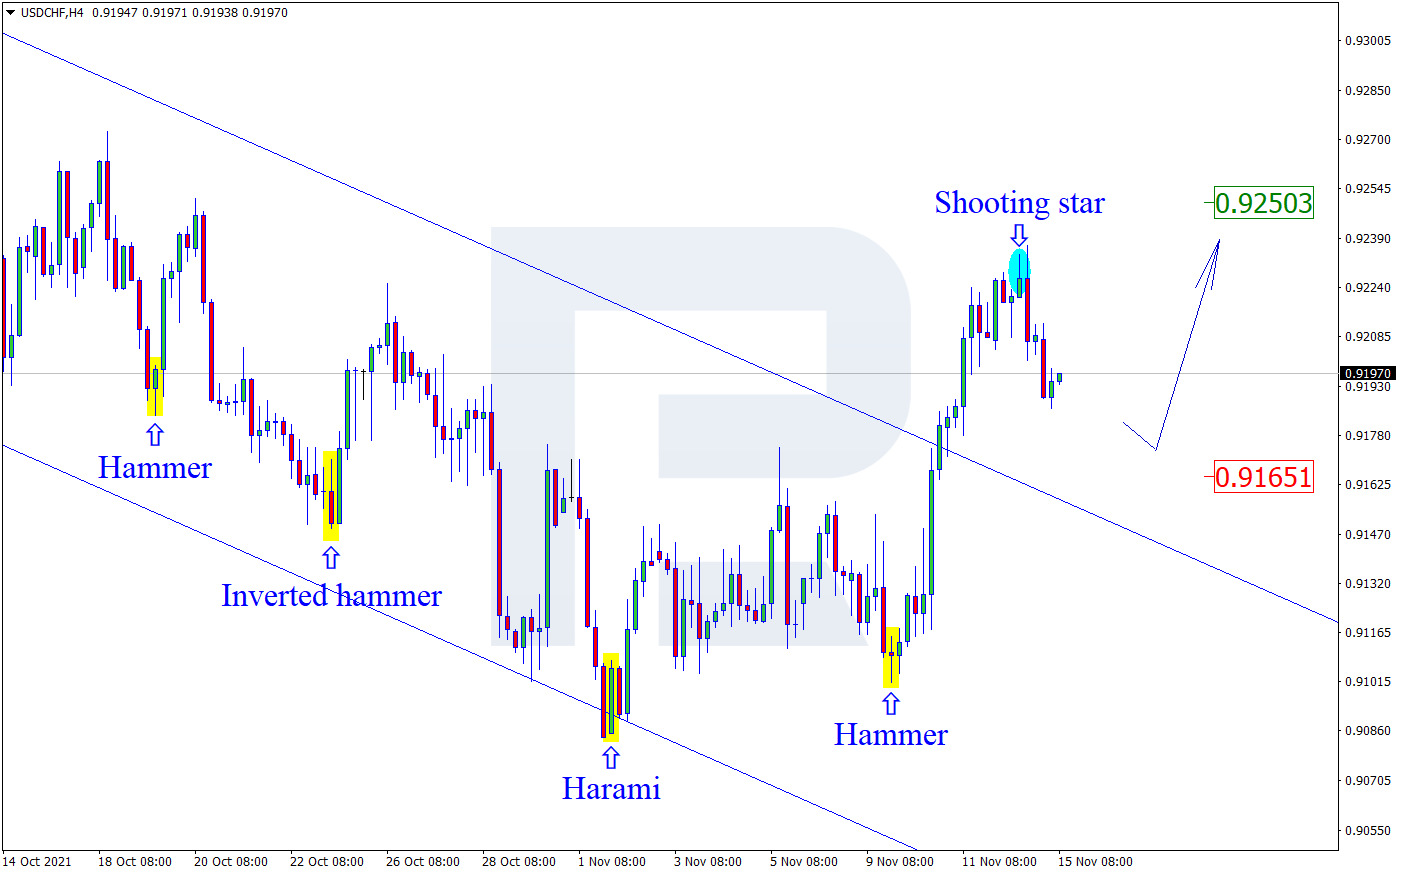
USDCHF, “US Dollar vs Swiss Franc”
As we can see in the H4 chart, after testing the resistance area, the pair has formed several reversal patterns, for example, Shooting Star. At the moment, USDCHF is reversing in the form of a new correctional wave towards the support level. In this case, the downside target may be at 0.9165. Still, there might be an alternative scenario, according to which the asset may continue growing to reach 0.9250 without testing the support level.
Article By RoboForex.com
Attention!
Forecasts presented in this section only reflect the author’s private opinion and should not be considered as guidance for trading. RoboForex LP bears no responsibility for trading results based on trading recommendations described in these analytical reviews.

- Gold Falls for the Third Consecutive Week: Is There Still Upside Potential? Jun 22, 2026
- Bank Indonesia raised its interest rate. Norges Bank and the SNB left rates unchanged Jun 19, 2026
- EUR/USD Loses Ground as Market Sentiment Favours the US Dollar Jun 19, 2026
- GBPUSD Awaits Bank of England Meeting Near April Lows Jun 18, 2026
- Markets disliked the results of the FOMC meeting. HKMA followed the Fed and kept its rate unchanged. Jun 18, 2026
- Gold Surges 2% Since Week Opening Amid Geopolitical Shifts and Fed Expectations Jun 17, 2026
- Your Bourse and FXPRIMUS Bring 24/7 Synthetic Indices to the Global Broker Market Jun 16, 2026
- Institutional investors continue to reduce their presence in metals Jun 16, 2026
- USDJPY Driven by Emotions: Bank of Japan Raises Rate to Highest Level Since 1995 Jun 16, 2026
- The United States and Iran have signed a peace agreement – oil has fallen to 80 dollars per barrel. Jun 15, 2026