
By Dmitriy Gurkovskiy, Chief Analyst at RoboForex
Oil is starting a new November weak with a decline. Brent is trading at $81.60 and looking rather weak so far.
The latest statistics from Baker Hughes showed that the Oil Rig Count added 4 units over the week and now equals 454. It’s a pretty bearish signal – the drilling activity in the US is accelerating, which may result in higher output, hence an excessive supply.
The latest report from the United States Department of Energy says that the oil extraction in the fourth quarter of 2021 will add 0.3 million bpdб while the total daily output will reach 11.6 million bpd. If everything goes as planned, the DoE will adjust its forecast once again in December.
This week, the International Energy Agency is scheduled to publish its forecasts on the supply and demand – oil investors are ready to respond.
In the H4 chart, after rebounding from 85.85, Brent is still falling towards 79.00 and may later start a new correction to test 82.85 from below. After that, the asset may form a new descending structure to reach 77.55 and then start another growth with the target at 90.00. From the technical point of view, this scenario is confirmed by MACD Oscillator: its signal line is moving below 0 within the histogram area, which implies a descending wave on the price chart. After this wave is over, the line is expected to grow towards 0.
Free Reports:
 Sign Up for Our Stock Market Newsletter – Get updated on News, Charts & Rankings of Public Companies when you join our Stocks Newsletter
 Get our Weekly Commitment of Traders Reports - See where the biggest traders (Hedge Funds and Commercial Hedgers) are positioned in the futures markets on a weekly basis.

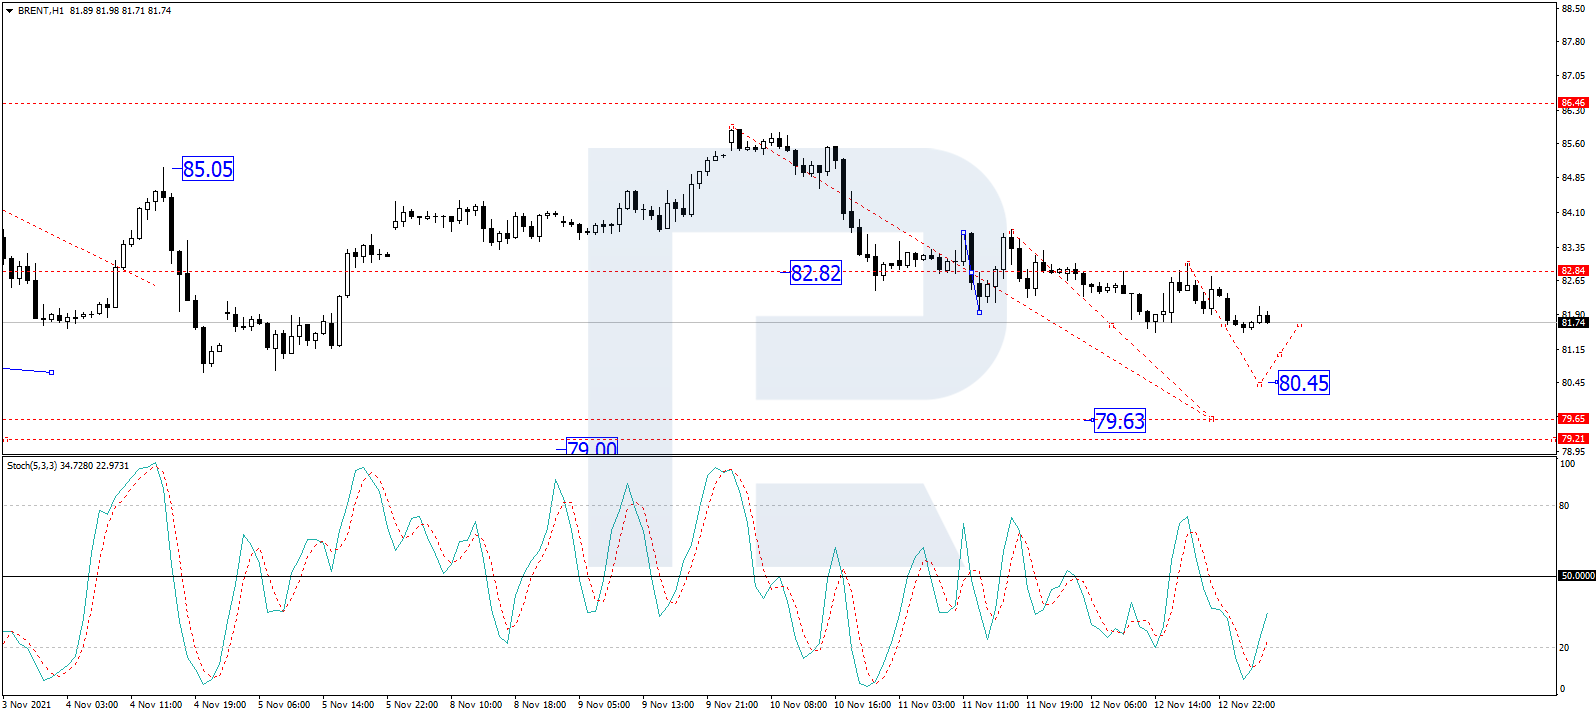
As we can see in the H1 chart, after forming a new consolidation range around 82.82, Brent has expanded it to the downside. In fact, this range should be considered as a downside continuation pattern. Possibly, the asset may reach 79.63 and then start a new correction to return to 82.82. Later, the market may resume trading downwards with the short-term target at 79.00. From the technical point of view, this idea is confirmed by the Stochastic Oscillator: its signal line is moving below 20, which implies a further downtrend on the price chart. After the price reaches the above-mentioned short-term target, the line may resume growing towards 50.
Disclaimer
Any forecasts contained herein are based on the author’s particular opinion. This analysis may not be treated as trading advice. RoboForex bears no responsibility for trading results based on trading recommendations and reviews contained herein.

- COT Metals Charts: Weekly Speculator Bets led by Copper & Steel Jul 18, 2026
- COT Bonds Charts: Weekly Speculator Bets led by 2-Year, SOFR 3M & 5-Year Bonds Jul 18, 2026
- COT Energy Charts: Weekly Speculator Bets led by Brent Oil & Heating Oil Jul 18, 2026
- COT Soft Commodities Charts: Weekly Speculator Bets led by Wheat, Corn & Soybean Meal Jul 18, 2026
- The Bank of Canada kept its interest rate unchanged. Platinum prices reached a three‑week high Jul 16, 2026
- Stock indices rose after the release of US inflation data. China’s GDP slowed sharply Jul 15, 2026
- GBP/USD Awaits Political News: What Will Happen Next Jul 15, 2026
- USD/JPY Holds at Highs: Pressure Lingers on Yen Jul 14, 2026
- Oil prices jumped 4% amid a new wave of escalation between the US and Iran Jul 13, 2026
- EUR/USD: US Inflation Will Determine Everything Jul 13, 2026