
By CountingPips.com COT Home | Data Tables | Data Downloads | Newsletter
Here are the latest charts and statistics for the Commitment of Traders (COT) data published by the Commodities Futures Trading Commission (CFTC).
The latest COT data is updated through Tuesday August 31 2021 and shows a quick view of how macro investors (for-profit speculators and commercial entities) were positioned in the futures markets.
VIX Volatility Futures:
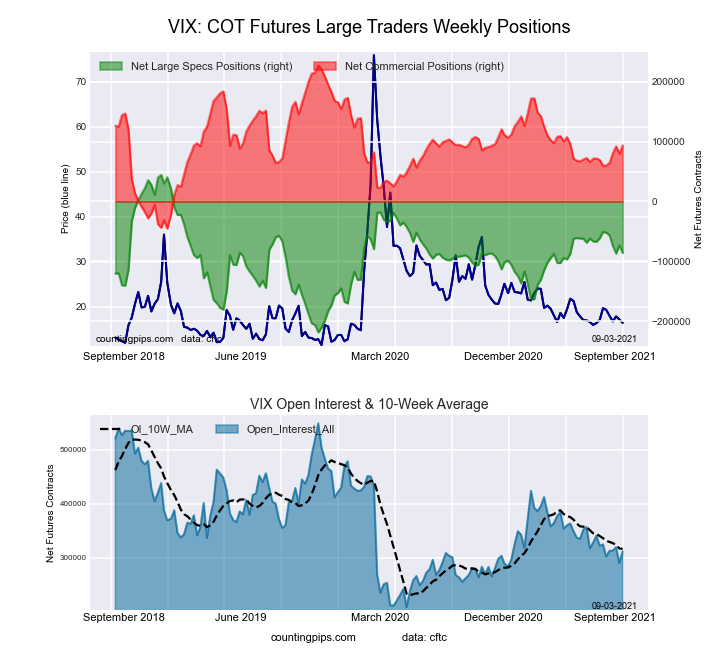 The VIX Volatility large speculator standing this week came in at a net position of -85,835 contracts in the data reported through Tuesday. This was a weekly decrease of -12,686 contracts from the previous week which had a total of -73,149 net contracts.
This week’s current strength score (the trader positioning range over the past three years, measured from 0 to 100) shows the speculators are currently Bullish with a score of 50.5 percent. The commercials are Bullish with a score of 50.9 percent and the small traders (not shown in chart) are Bearish with a score of 27.2 percent.
| VIX Volatility Futures Statistics | SPECULATORS | COMMERCIALS | SMALL TRADERS |
| – Percent of Open Interest Longs: | 21.2 | 55.9 | 6.8 |
| – Percent of Open Interest Shorts: | 48.7 | 25.9 | 9.3 |
| – Net Position: | -85,835 | 93,529 | -7,694 |
| – Gross Longs: | 66,107 | 174,327 | 21,288 |
| – Gross Shorts: | 151,942 | 80,798 | 28,982 |
| – Long to Short Ratio: | 0.4 to 1 | 2.2 to 1 | 0.7 to 1 |
| NET POSITION TREND: | |||
| – COT Index Score (3 Year Range Pct): | 50.5 | 50.9 | 27.2 |
| – COT Index Reading (3 Year Range): | Bullish | Bullish | Bearish |
| NET POSITION MOVEMENT INDEX: | |||
| – 6-Week Change in Strength Index: | -13.4 | 12.4 | 4.8 |
Free Reports:
 Sign Up for Our Stock Market Newsletter – Get updated on News, Charts & Rankings of Public Companies when you join our Stocks Newsletter
 Get our Weekly Commitment of Traders Reports - See where the biggest traders (Hedge Funds and Commercial Hedgers) are positioned in the futures markets on a weekly basis.
S&P500 Mini Futures:
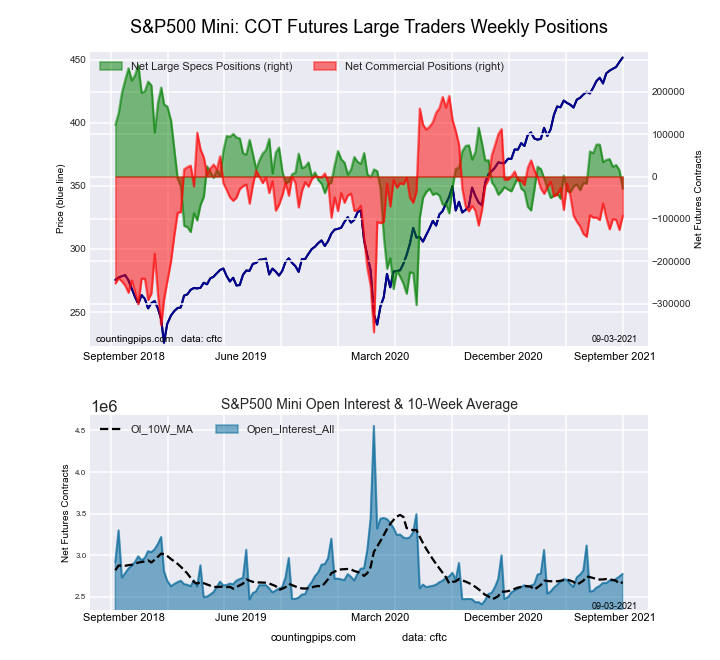 The S&P500 Mini large speculator standing this week came in at a net position of -28,724 contracts in the data reported through Tuesday. This was a weekly decrease of -43,617 contracts from the previous week which had a total of 14,893 net contracts.
This week’s current strength score (the trader positioning range over the past three years, measured from 0 to 100) shows the speculators are currently Bearish with a score of 48.5 percent. The commercials are Bearish with a score of 49.3 percent and the small traders (not shown in chart) are Bullish with a score of 51.9 percent.
| S&P500 Mini Futures Statistics | SPECULATORS | COMMERCIALS | SMALL TRADERS |
| – Percent of Open Interest Longs: | 14.0 | 68.5 | 13.4 |
| – Percent of Open Interest Shorts: | 15.1 | 71.9 | 9.0 |
| – Net Position: | -28,724 | -92,837 | 121,561 |
| – Gross Longs: | 389,721 | 1,902,213 | 371,634 |
| – Gross Shorts: | 418,445 | 1,995,050 | 250,073 |
| – Long to Short Ratio: | 0.9 to 1 | 1.0 to 1 | 1.5 to 1 |
| NET POSITION TREND: | |||
| – COT Index Score (3 Year Range Pct): | 48.5 | 49.3 | 51.9 |
| – COT Index Reading (3 Year Range): | Bearish | Bearish | Bullish |
| NET POSITION MOVEMENT INDEX: | |||
| – 6-Week Change in Strength Index: | -11.1 | -5.2 | 19.3 |
Dow Jones Mini Futures:
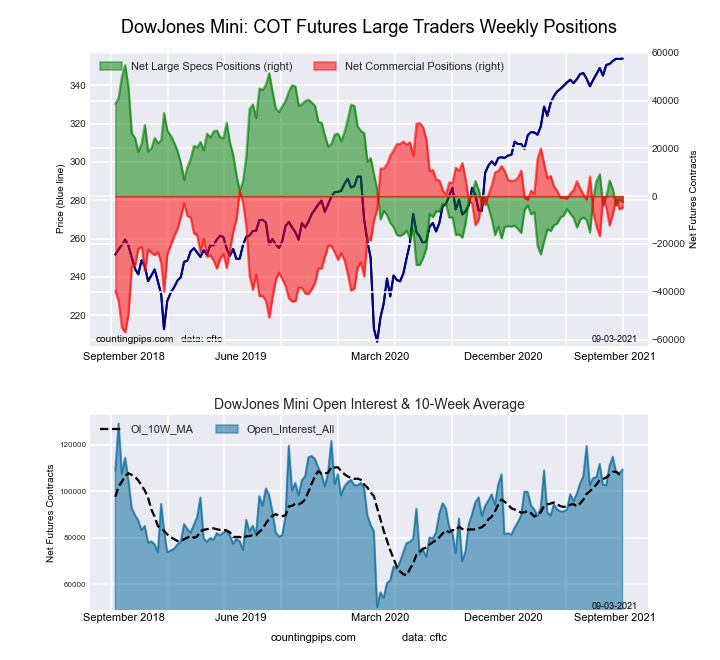 The Dow Jones Mini large speculator standing this week came in at a net position of -2,542 contracts in the data reported through Tuesday. This was a weekly decline of -1,150 contracts from the previous week which had a total of -1,392 net contracts.
This week’s current strength score (the trader positioning range over the past three years, measured from 0 to 100) shows the speculators are currently Bearish with a score of 31.4 percent. The commercials are Bullish with a score of 59.7 percent and the small traders (not shown in chart) are Bullish with a score of 77.3 percent.
| Dow Jones Mini Futures Statistics | SPECULATORS | COMMERCIALS | SMALL TRADERS |
| – Percent of Open Interest Longs: | 40.1 | 42.4 | 16.7 |
| – Percent of Open Interest Shorts: | 42.5 | 46.8 | 10.1 |
| – Net Position: | -2,542 | -4,726 | 7,268 |
| – Gross Longs: | 43,851 | 46,373 | 18,281 |
| – Gross Shorts: | 46,393 | 51,099 | 11,013 |
| – Long to Short Ratio: | 0.9 to 1 | 0.9 to 1 | 1.7 to 1 |
| NET POSITION TREND: | |||
| – COT Index Score (3 Year Range Pct): | 31.4 | 59.7 | 77.3 |
| – COT Index Reading (3 Year Range): | Bearish | Bullish | Bullish |
| NET POSITION MOVEMENT INDEX: | |||
| – 6-Week Change in Strength Index: | 1.6 | -4.9 | 15.6 |
Nasdaq Mini Futures:
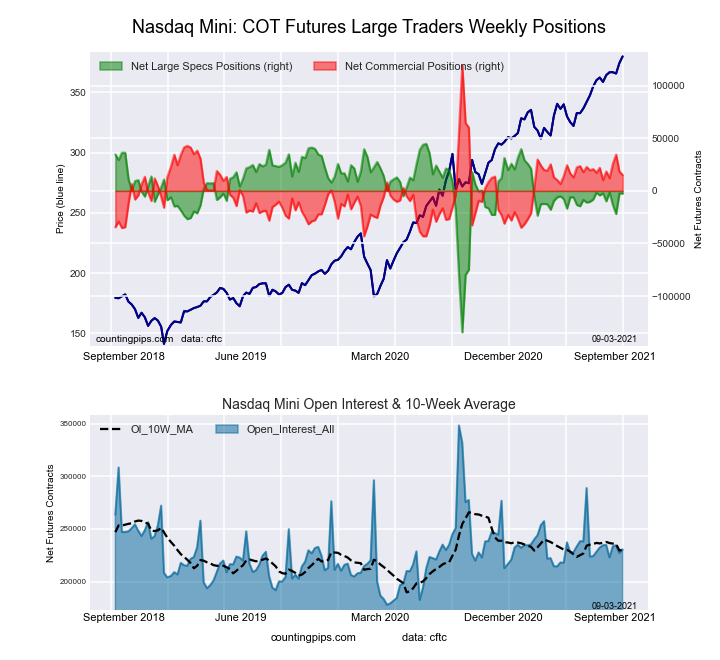 The Nasdaq Mini large speculator standing this week came in at a net position of -2,449 contracts in the data reported through Tuesday. This was a weekly lowering of -31 contracts from the previous week which had a total of -2,418 net contracts.
This week’s current strength score (the trader positioning range over the past three years, measured from 0 to 100) shows the speculators are currently Bullish with a score of 73.7 percent. The commercials are Bearish with a score of 35.8 percent and the small traders (not shown in chart) are Bearish-Extreme with a score of 15.6 percent.
| Nasdaq Mini Futures Statistics | SPECULATORS | COMMERCIALS | SMALL TRADERS |
| – Percent of Open Interest Longs: | 30.1 | 51.8 | 15.9 |
| – Percent of Open Interest Shorts: | 31.2 | 45.3 | 21.4 |
| – Net Position: | -2,449 | 15,118 | -12,669 |
| – Gross Longs: | 69,396 | 119,514 | 36,684 |
| – Gross Shorts: | 71,845 | 104,396 | 49,353 |
| – Long to Short Ratio: | 1.0 to 1 | 1.1 to 1 | 0.7 to 1 |
| NET POSITION TREND: | |||
| – COT Index Score (3 Year Range Pct): | 73.7 | 35.8 | 15.6 |
| – COT Index Reading (3 Year Range): | Bullish | Bearish | Bearish-Extreme |
| NET POSITION MOVEMENT INDEX: | |||
| – 6-Week Change in Strength Index: | -0.1 | 3.0 | -10.5 |
Russell 2000 Mini Futures:
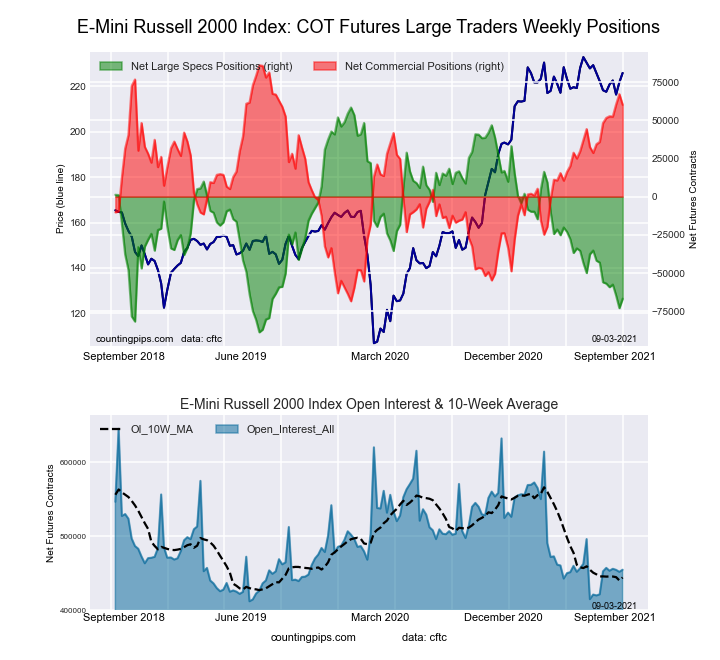 The Russell 2000 Mini large speculator standing this week came in at a net position of -66,790 contracts in the data reported through Tuesday. This was a weekly rise of 6,141 contracts from the previous week which had a total of -72,931 net contracts.
This week’s current strength score (the trader positioning range over the past three years, measured from 0 to 100) shows the speculators are currently Bearish-Extreme with a score of 14.9 percent. The commercials are Bullish-Extreme with a score of 83.2 percent and the small traders (not shown in chart) are Bullish with a score of 52.0 percent.
| Russell 2000 Mini Futures Statistics | SPECULATORS | COMMERCIALS | SMALL TRADERS |
| – Percent of Open Interest Longs: | 10.5 | 81.7 | 6.6 |
| – Percent of Open Interest Shorts: | 25.2 | 68.5 | 5.1 |
| – Net Position: | -66,790 | 60,084 | 6,706 |
| – Gross Longs: | 47,869 | 371,437 | 30,012 |
| – Gross Shorts: | 114,659 | 311,353 | 23,306 |
| – Long to Short Ratio: | 0.4 to 1 | 1.2 to 1 | 1.3 to 1 |
| NET POSITION TREND: | |||
| – COT Index Score (3 Year Range Pct): | 14.9 | 83.2 | 52.0 |
| – COT Index Reading (3 Year Range): | Bearish-Extreme | Bullish-Extreme | Bullish |
| NET POSITION MOVEMENT INDEX: | |||
| – 6-Week Change in Strength Index: | -7.3 | 7.7 | -3.4 |
Nikkei Stock Average (USD) Futures:
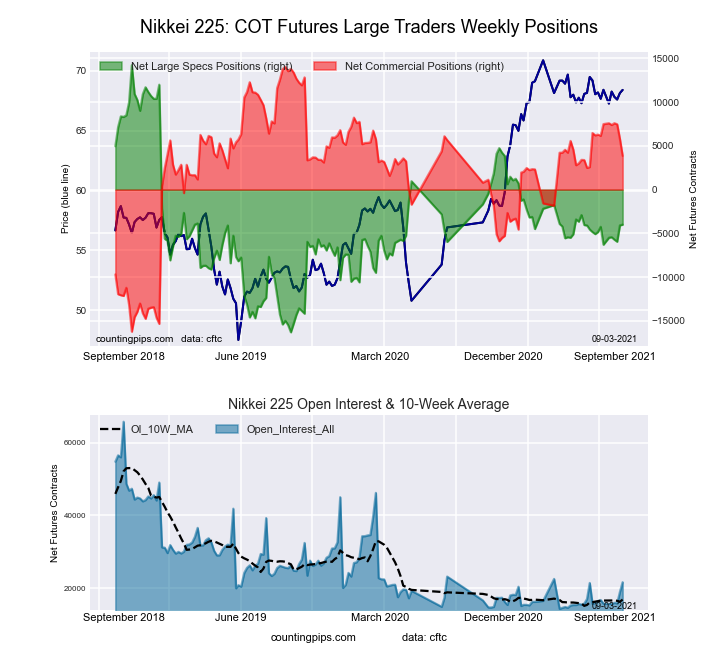 The Nikkei Stock Average (USD) large speculator standing this week came in at a net position of -4,003 contracts in the data reported through Tuesday. This was a weekly gain of 86 contracts from the previous week which had a total of -4,089 net contracts.
This week’s current strength score (the trader positioning range over the past three years, measured from 0 to 100) shows the speculators are currently Bearish with a score of 40.3 percent. The commercials are Bullish with a score of 66.4 percent and the small traders (not shown in chart) are Bearish with a score of 28.7 percent.
| Nikkei Stock Average Futures Statistics | SPECULATORS | COMMERCIALS | SMALL TRADERS |
| – Percent of Open Interest Longs: | 16.1 | 47.9 | 27.7 |
| – Percent of Open Interest Shorts: | 34.6 | 30.1 | 27.0 |
| – Net Position: | -4,003 | 3,855 | 148 |
| – Gross Longs: | 3,484 | 10,374 | 6,005 |
| – Gross Shorts: | 7,487 | 6,519 | 5,857 |
| – Long to Short Ratio: | 0.5 to 1 | 1.6 to 1 | 1.0 to 1 |
| NET POSITION TREND: | |||
| – COT Index Score (3 Year Range Pct): | 40.3 | 66.4 | 28.7 |
| – COT Index Reading (3 Year Range): | Bearish | Bullish | Bearish |
| NET POSITION MOVEMENT INDEX: | |||
| – 6-Week Change in Strength Index: | 7.5 | -12.0 | 17.1 |
MSCI EAFE Mini Futures:
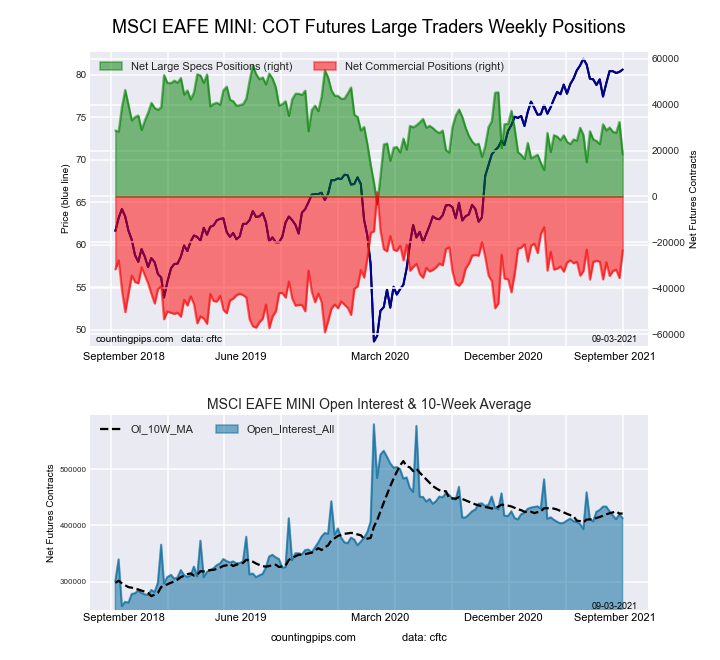 The MSCI EAFE Mini large speculator standing this week came in at a net position of 18,266 contracts in the data reported through Tuesday. This was a weekly fall of -14,186 contracts from the previous week which had a total of 32,452 net contracts.
This week’s current strength score (the trader positioning range over the past three years, measured from 0 to 100) shows the speculators are currently Bearish with a score of 35.8 percent. The commercials are Bullish with a score of 58.5 percent and the small traders (not shown in chart) are Bullish with a score of 63.3 percent.
| MSCI EAFE Mini Futures Statistics | SPECULATORS | COMMERCIALS | SMALL TRADERS |
| – Percent of Open Interest Longs: | 8.2 | 89.0 | 2.5 |
| – Percent of Open Interest Shorts: | 3.7 | 94.7 | 1.2 |
| – Net Position: | 18,266 | -23,491 | 5,225 |
| – Gross Longs: | 33,722 | 367,699 | 10,202 |
| – Gross Shorts: | 15,456 | 391,190 | 4,977 |
| – Long to Short Ratio: | 2.2 to 1 | 0.9 to 1 | 2.0 to 1 |
| NET POSITION TREND: | |||
| – COT Index Score (3 Year Range Pct): | 35.8 | 58.5 | 63.3 |
| – COT Index Reading (3 Year Range): | Bearish | Bullish | Bullish |
| NET POSITION MOVEMENT INDEX: | |||
| – 6-Week Change in Strength Index: | -21.8 | 20.7 | 5.2 |
Article By CountingPips.com – Receive our weekly COT Reports by Email
*COT Report: The COT data, released weekly to the public each Friday, is updated through the most recent Tuesday (data is 3 days old) and shows a quick view of how large speculators or non-commercials (for-profit traders) were positioned in the futures markets.
The CFTC categorizes trader positions according to commercial hedgers (traders who use futures contracts for hedging as part of the business), non-commercials (large traders who speculate to realize trading profits) and nonreportable traders (usually small traders/speculators).
Find CFTC criteria here: (http://www.cftc.gov/MarketReports/CommitmentsofTraders/ExplanatoryNotes/index.htm).

- Gold (XAU/USD) Faces Persistent Selling Pressure Jun 10, 2026
- The US technology sector once again came under a wave of selling Jun 10, 2026
- China has shifted to using its own strategic oil reserves Jun 9, 2026
- GBP/USD Remains Under Pressure Despite Attempts to Recover Jun 9, 2026
- SpaceX IPO: Set for $75 billion liftoff Jun 8, 2026
- On Friday, the American stock market experienced one of the strongest crashes in recent times Jun 8, 2026
- EUR/USD at April Lows: What’s Next for the Pair? Jun 8, 2026
- The ceasefire between Israel and Lebanon has reduced the geopolitical premium Jun 5, 2026
- EUR/USD: All Eyes on Non-Farm Payrolls Jun 5, 2026
- The escalation of the conflict in the Middle East put pressure on US and European stock indices Jun 4, 2026