
By RoboForex Analytical Department
The NZD/USD pair has experienced a significant decline, touching a low of 0.5841 and reaching a yearly trough of 0.5796. The primary pressure comes from a robust US dollar, bolstered by anticipations of a more stringent tariff regime under US President-elect Donald Trump. Speculations about Trump imposing an additional 10% tariff on all Chinese goods have particularly impacted the Kiwi, given China’s role as New Zealand’s largest trading partner.
The market pre-emptively reacts to potential US policy shifts, recalling Trump’s previous term characterised by aggressive trade policies. This has cast a long shadow over the NZD, influencing investor sentiment.
The upcoming Reserve Bank of New Zealand (RBNZ) meeting on Wednesday is crucial, with expectations leaning towards a 50-basis-point rate cut to 4.25% per annum. This expected move aligns with the RBNZ’s dovish stance from October and could sustain the downward pressure on the NZD.
Technical analysis of NZD/USD
Free Reports:
 Get our Weekly Commitment of Traders Reports - See where the biggest traders (Hedge Funds and Commercial Hedgers) are positioned in the futures markets on a weekly basis.
 Download Our Metatrader 4 Indicators – Put Our Free MetaTrader 4 Custom Indicators on your charts when you join our Weekly Newsletter
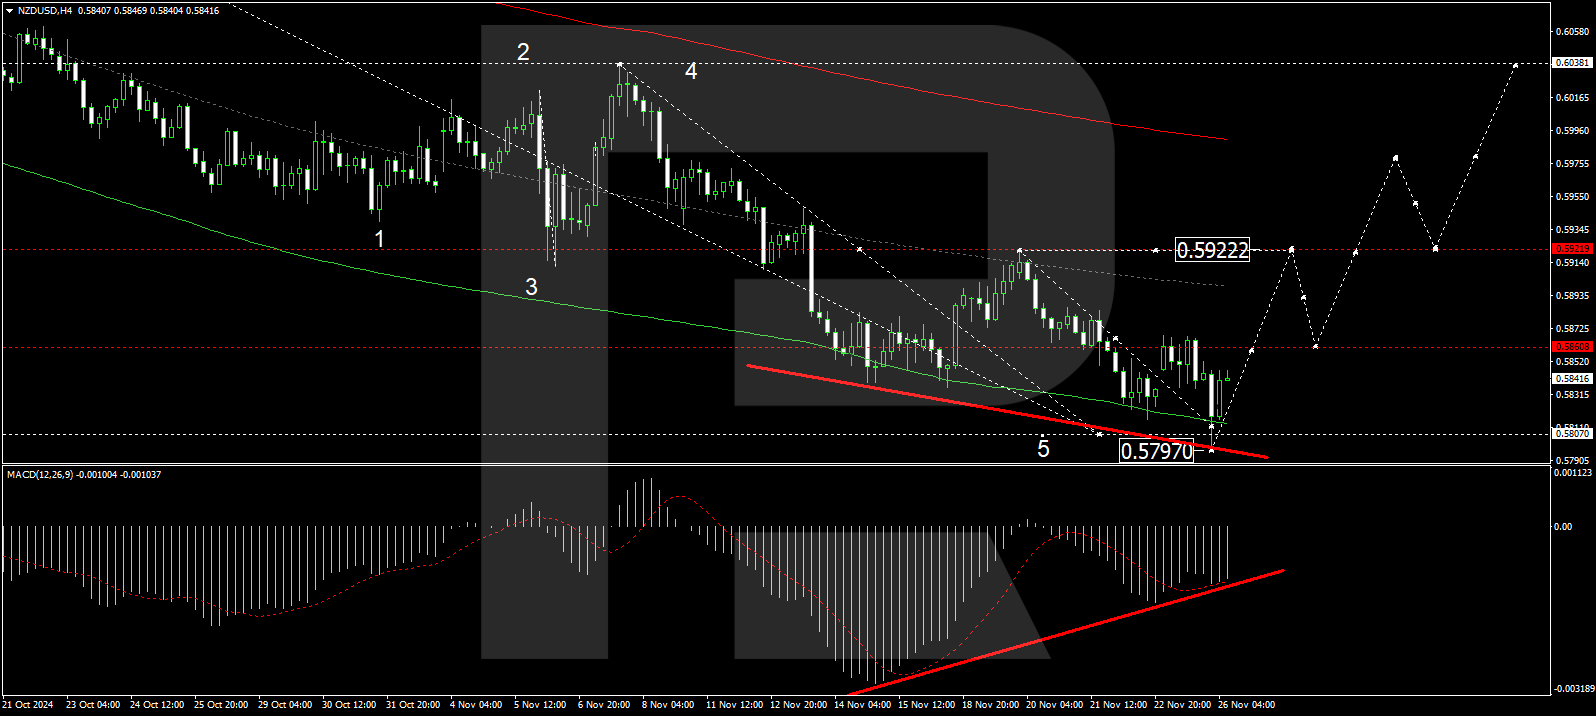
H4 chart: the NZD/USD has completed a decline wave, reaching 0.5797, with a subsequent recovery phase targeting 0.5922 underway. After reaching this level, a potential pullback to 0.5860 could establish a consolidation zone around this marker. A break below this range might extend the decline to 0.5777, while an upward breach could pave the way to 0.5977.
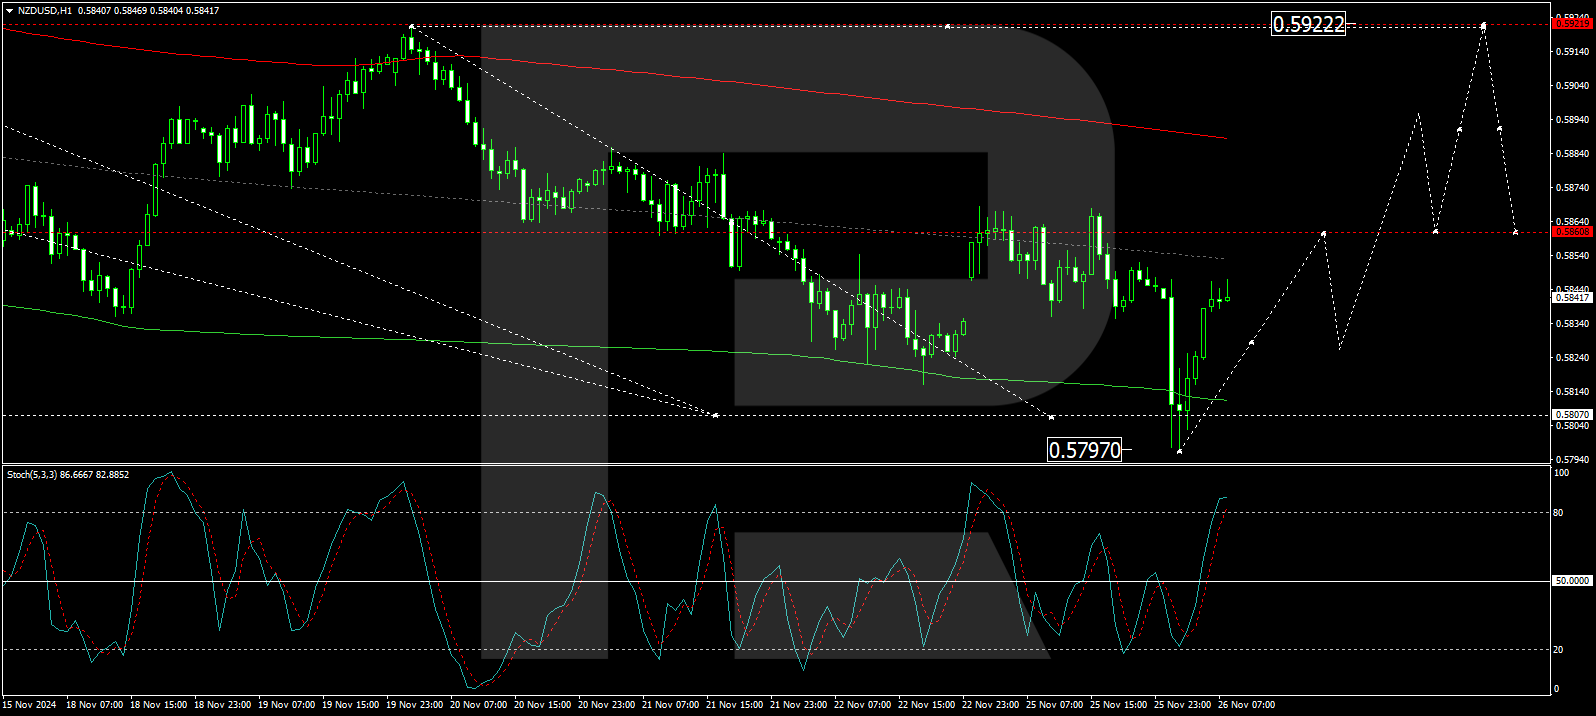
H1 chart: the pair is forming an initial growth wave towards 0.5860. Following this target, a retraction to 0.5828 is likely. The Stochastic oscillator supports this currency forecast, indicating a possible downturn from elevated levels and enhancing the likelihood of continuing the downward trajectory.
Disclaimer
Any forecasts contained herein are based on the author’s particular opinion. This analysis may not be treated as trading advice. RoboForex bears no responsibility for trading results based on trading recommendations and reviews contained herein.

- EUR/USD: Busy Week Ahead Aug 3, 2026
- Positive sentiment in the AI sector supported stock indices. Oil prices remain volatile Aug 3, 2026
- The Tech‑heavy NASDAQ Index jumped by more than 3.3%. The offshore yuan is trading at its highest level since 2023 Jul 31, 2026
- USD/JPY After Volatility: Multiple Events in One Day Jul 31, 2026
- The US indices sell off amid renewed US-Iran clashes. Oil jumps by 7% Jul 30, 2026
- USD/JPY Temporary in Equilibrium: Multiple Factors in Focus Jul 30, 2026
- GBP/USD at Month’s Lows: The Outlook Remains Weak Jul 29, 2026
- Crude oil falls below $80 per barrel. Australia sees inflation slowdown Jul 29, 2026
- The US Tech sector hit by sell‑off. Oil prices decline on renewed negotiations Jul 28, 2026
- Gold Declines, Focus on Fed and Falling Oil Prices Jul 28, 2026
