
Article By RoboForex.com
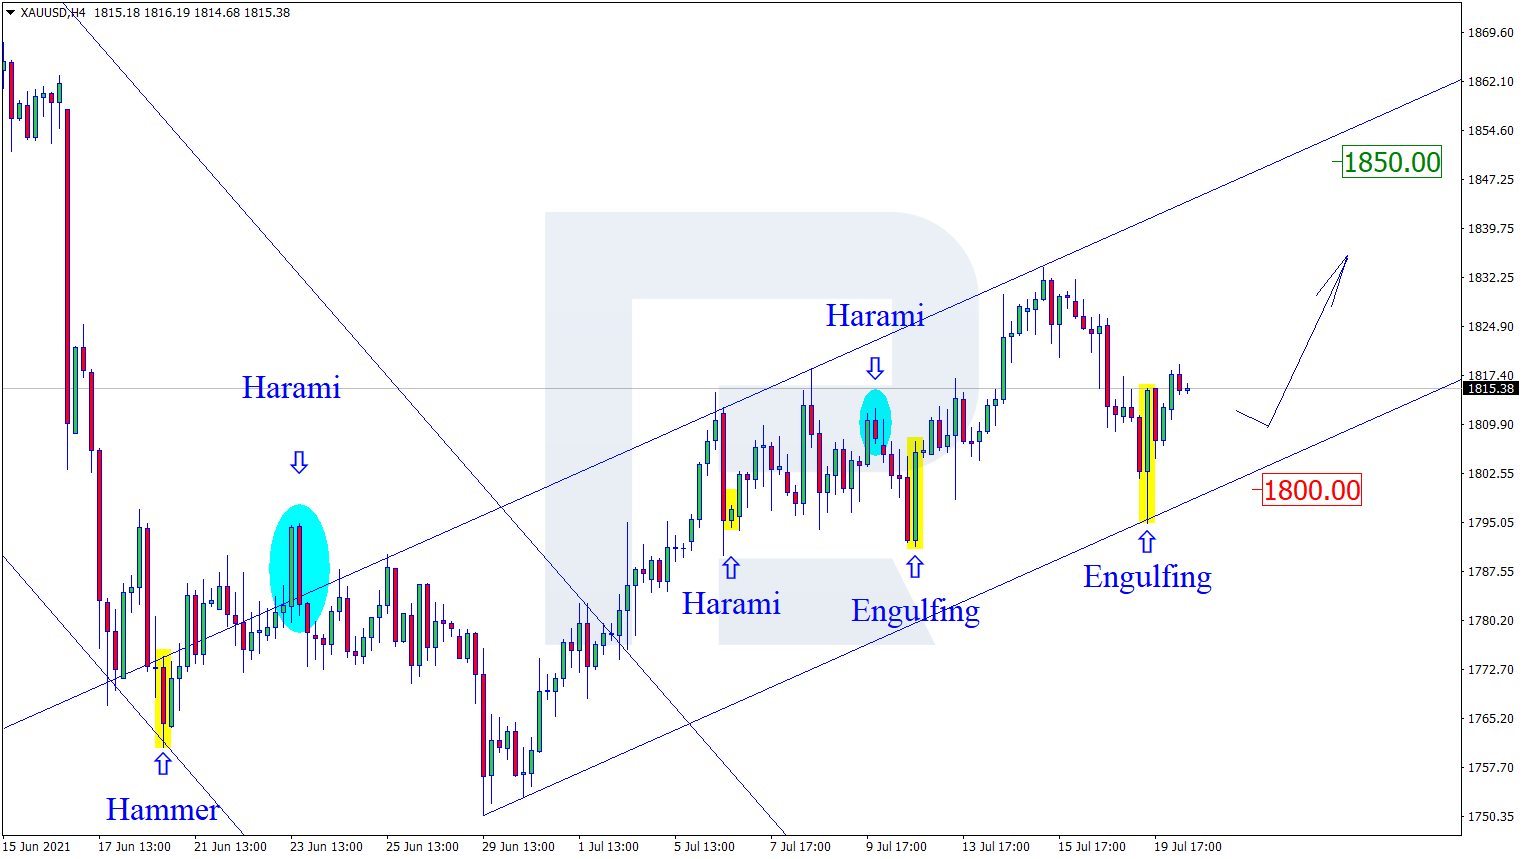
XAUUSD, “Gold vs US Dollar”
As we can see in the H4 chart, the asset is still trading upwards. After forming several reversal patterns, such as Engulfing, not from the support level, XAUUSD may reverse and start a new growth to reach the resistance area at 1850.00. At the same time, an opposite scenario implies that the price may correct towards 1800.00 before resuming its ascending tendency.

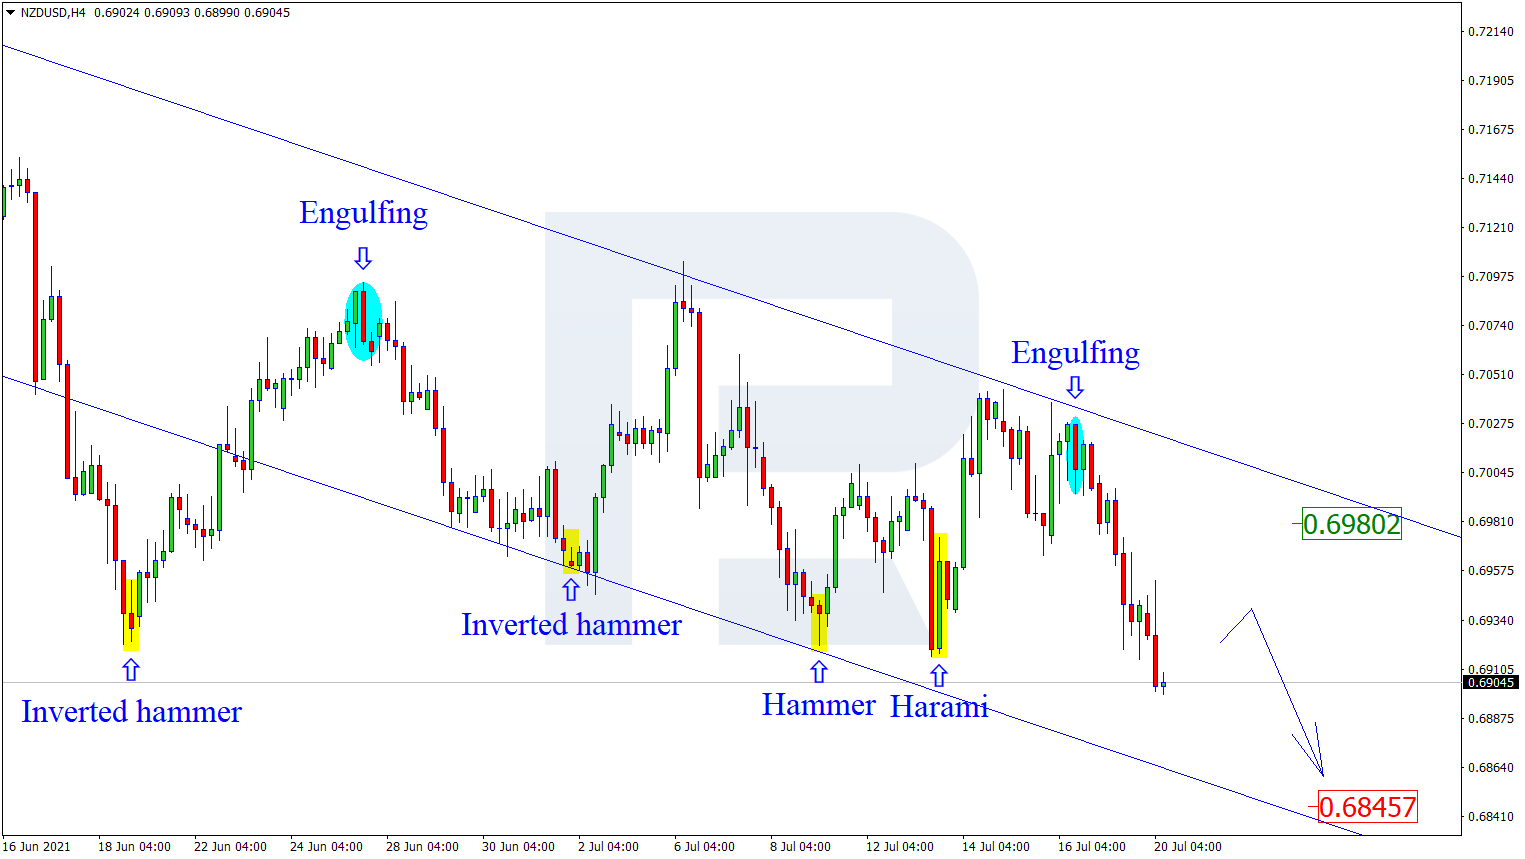
NZDUSD, “New Zealand vs US Dollar”
As we can see in the H4 chart, the descending impulse continues. By now, NZDUSD has formed several reversal patterns, such as Harami and Engulfing, close to the resistance level. At the moment, the asset is reversing. In this case, the downside target is the support area at 0.6845. After testing this level, the asset may break it and continue moving downwards. However, an alternative scenario implies that the price may correct towards 0.6980 before resuming its decline.
Free Reports:
 Sign Up for Our Stock Market Newsletter – Get updated on News, Charts & Rankings of Public Companies when you join our Stocks Newsletter
 Get our Weekly Commitment of Traders Reports - See where the biggest traders (Hedge Funds and Commercial Hedgers) are positioned in the futures markets on a weekly basis.
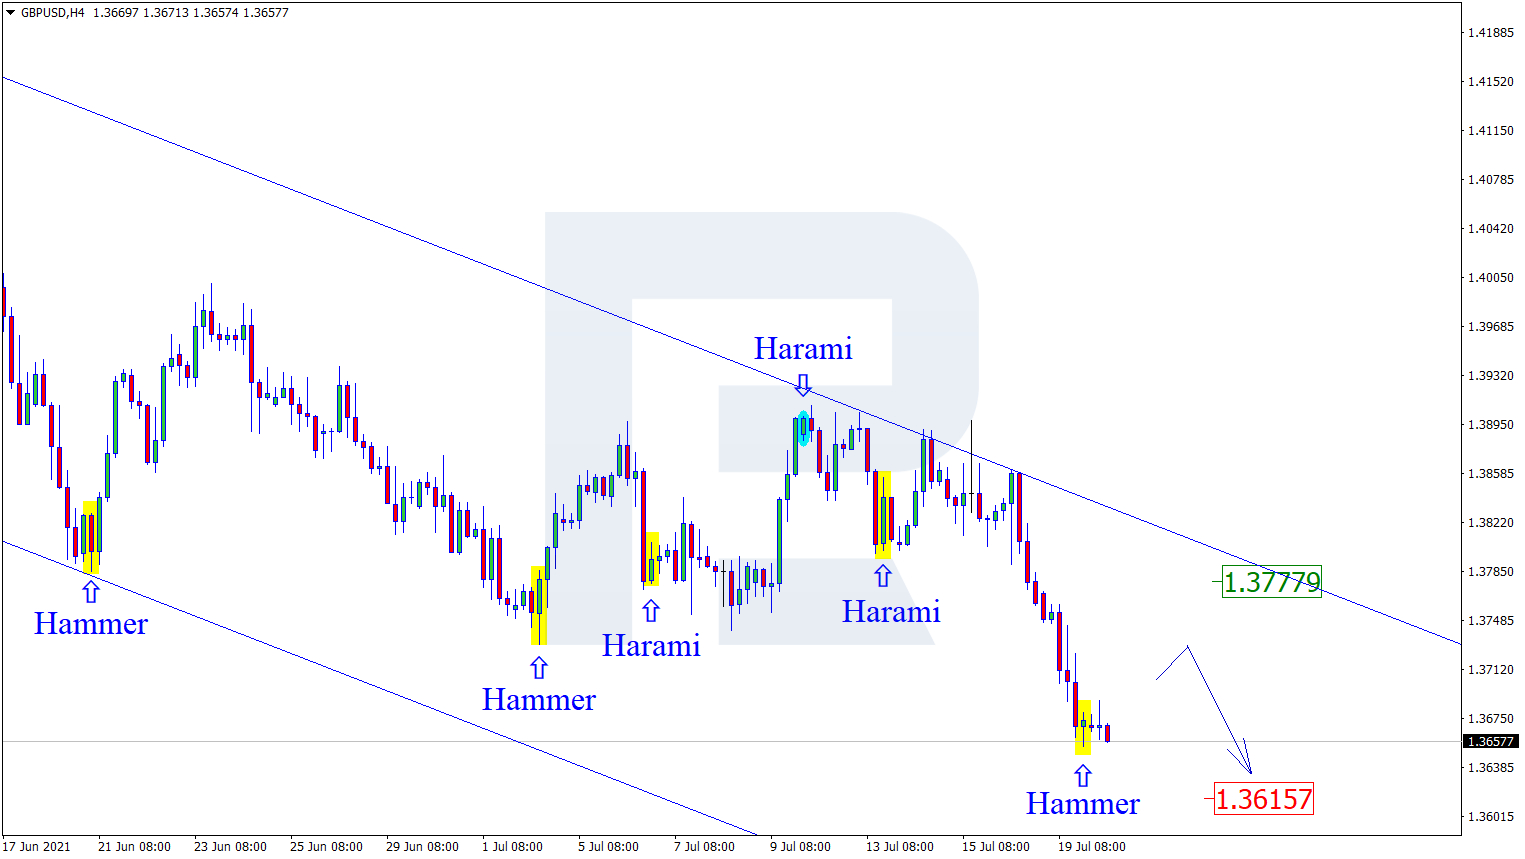
GBPUSD, “Great Britain Pound vs US Dollar”
As we can see in the H4 chart, the asset is still trading within the downtrend. By now, GBPUSD has formed several reversal patterns, such as Hammer, not far from the support area. At the moment, the pair may reverse and start a new correction towards the resistance level. In this case, the upside target may be at 1.3777. After testing this level, the market may rebound from it and resume falling. Still, there might be an alternative scenario, according to which the asset may continue falling towards the support area at 1.3610 without any significant corrections.
Article By RoboForex.com
Attention!
Forecasts presented in this section only reflect the author’s private opinion and should not be considered as guidance for trading. RoboForex LP bears no responsibility for trading results based on trading recommendations described in these analytical reviews.

- Gold Surges 2% Since Week Opening Amid Geopolitical Shifts and Fed Expectations Jun 17, 2026
- Your Bourse and FXPRIMUS Bring 24/7 Synthetic Indices to the Global Broker Market Jun 16, 2026
- Institutional investors continue to reduce their presence in metals Jun 16, 2026
- USDJPY Driven by Emotions: Bank of Japan Raises Rate to Highest Level Since 1995 Jun 16, 2026
- The United States and Iran have signed a peace agreement – oil has fallen to 80 dollars per barrel. Jun 15, 2026
- EURUSD Ahead of the New Week: Expecting High Volatility Jun 15, 2026
- COT Metals Charts: Speculator Bets led by Steel Jun 14, 2026
- COT Bonds Charts: Speculator Bets led by 2-Year Bonds & Ultra 10-Year Bonds Jun 14, 2026
- COT Energy Charts: Speculator Bets led by Brent Oil Jun 14, 2026
- COT Soft Commodities Charts: Weekly Speculator Bets led lower by Corn and Soybean Meal Jun 14, 2026