
Article By RoboForex.com
EURUSD, “Euro vs US Dollar”
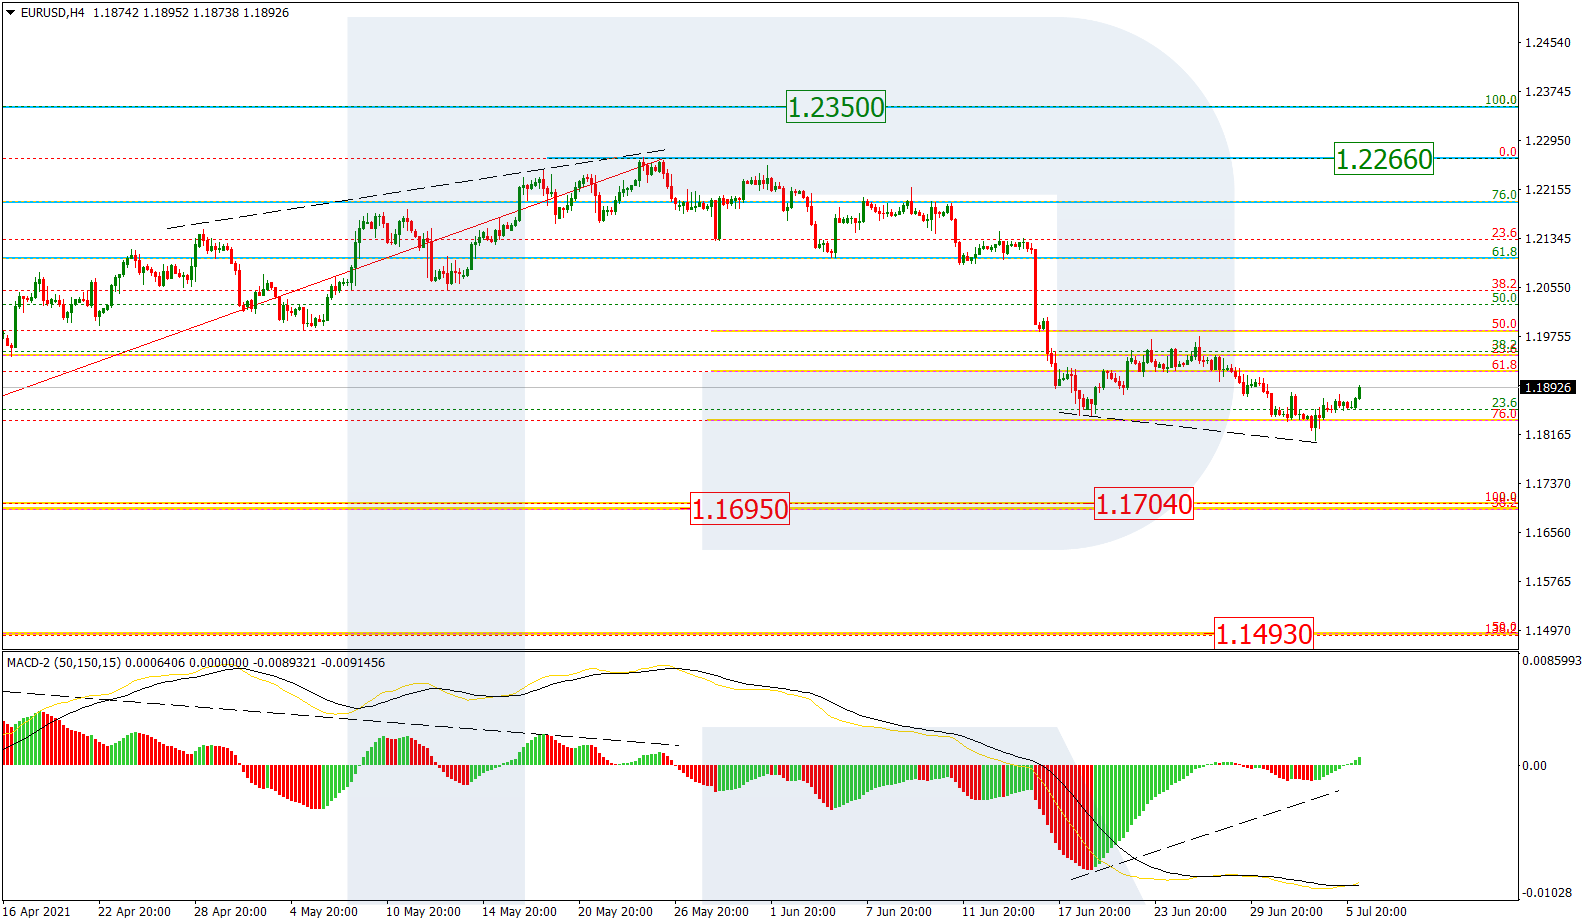
As we can see in the H4 chart, the asset is starting a new rising movement after convergence on MACD; the previous decline has reached 76.0% fibo. At the same time, this convergence may force the asset to form not just a pullback but a proper ascending wave towards the short/long-term highs at 1.2266 and 1.2350 respectively. However, if the price completes the pullback without updating the high, the instrument may fall to break the mid-term 76.0% fibo at 1.1704 and then continue moving towards the long-term 50.0% fibo at 1.1695.

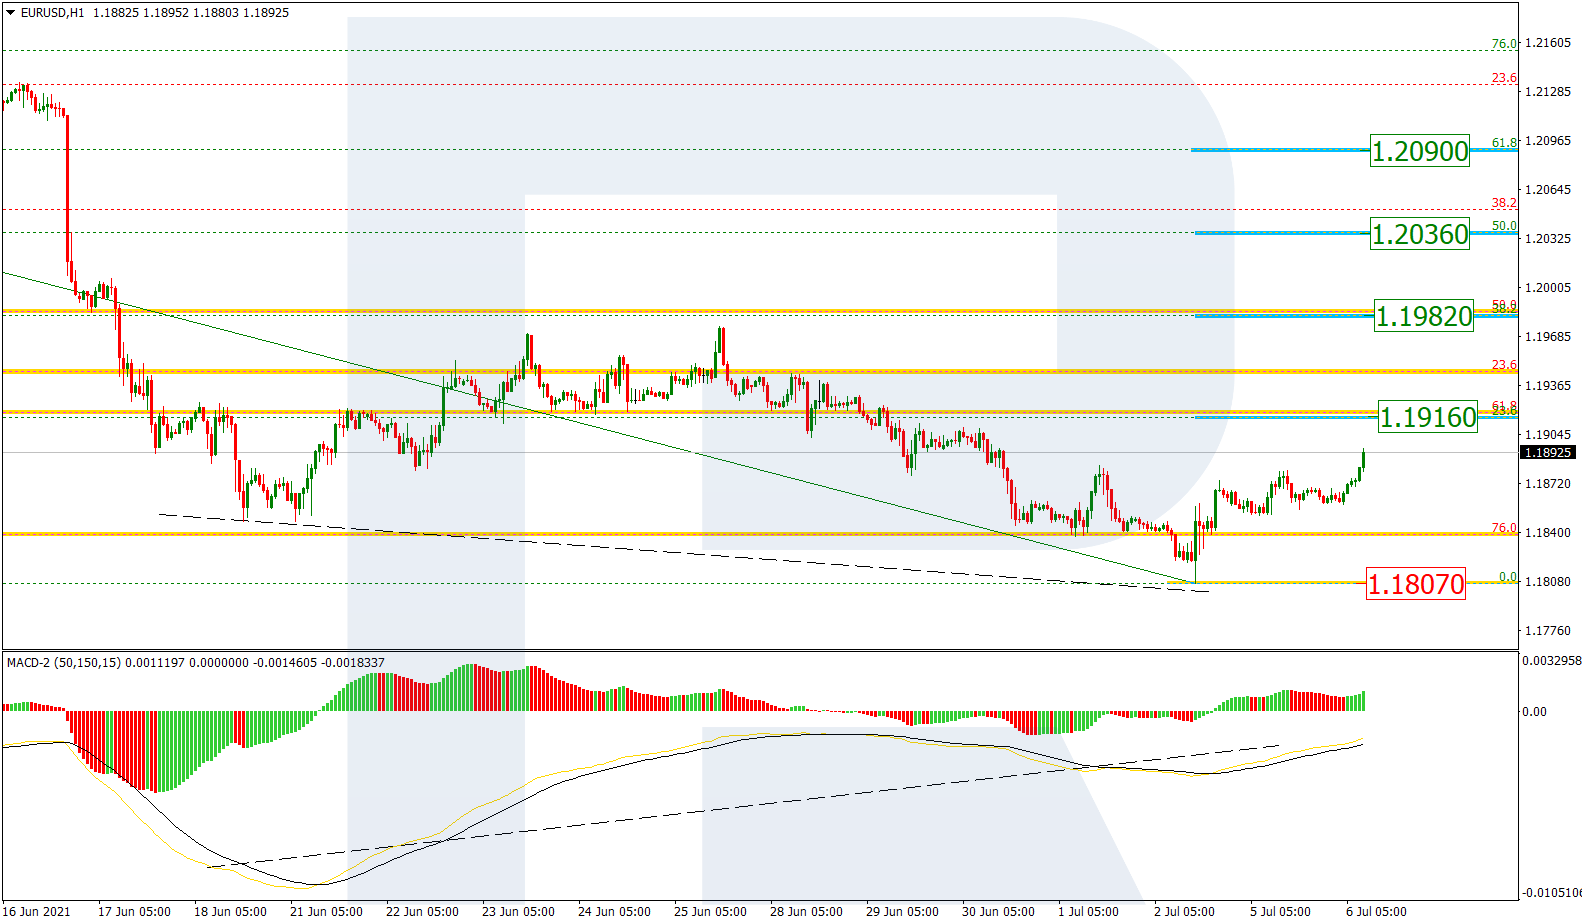
The H1 chart shows potential correctional targets after convergence. At the moment, the pair is approaching 23.6% fibo at 1.1916 and may later continue moving towards 38.2%, 50.0%, and 61.8% fibo at 1.1982, 1.2036, and 1.2090 respectively. A breakout of the local low and the support at 1.1807 will complete the pullback and lead to a further decline.
Free Reports:
 Download Our Metatrader 4 Indicators – Put Our Free MetaTrader 4 Custom Indicators on your charts when you join our Weekly Newsletter
 Get our Weekly Commitment of Traders Reports - See where the biggest traders (Hedge Funds and Commercial Hedgers) are positioned in the futures markets on a weekly basis.
USDJPY, “US Dollar vs. Japanese Yen”
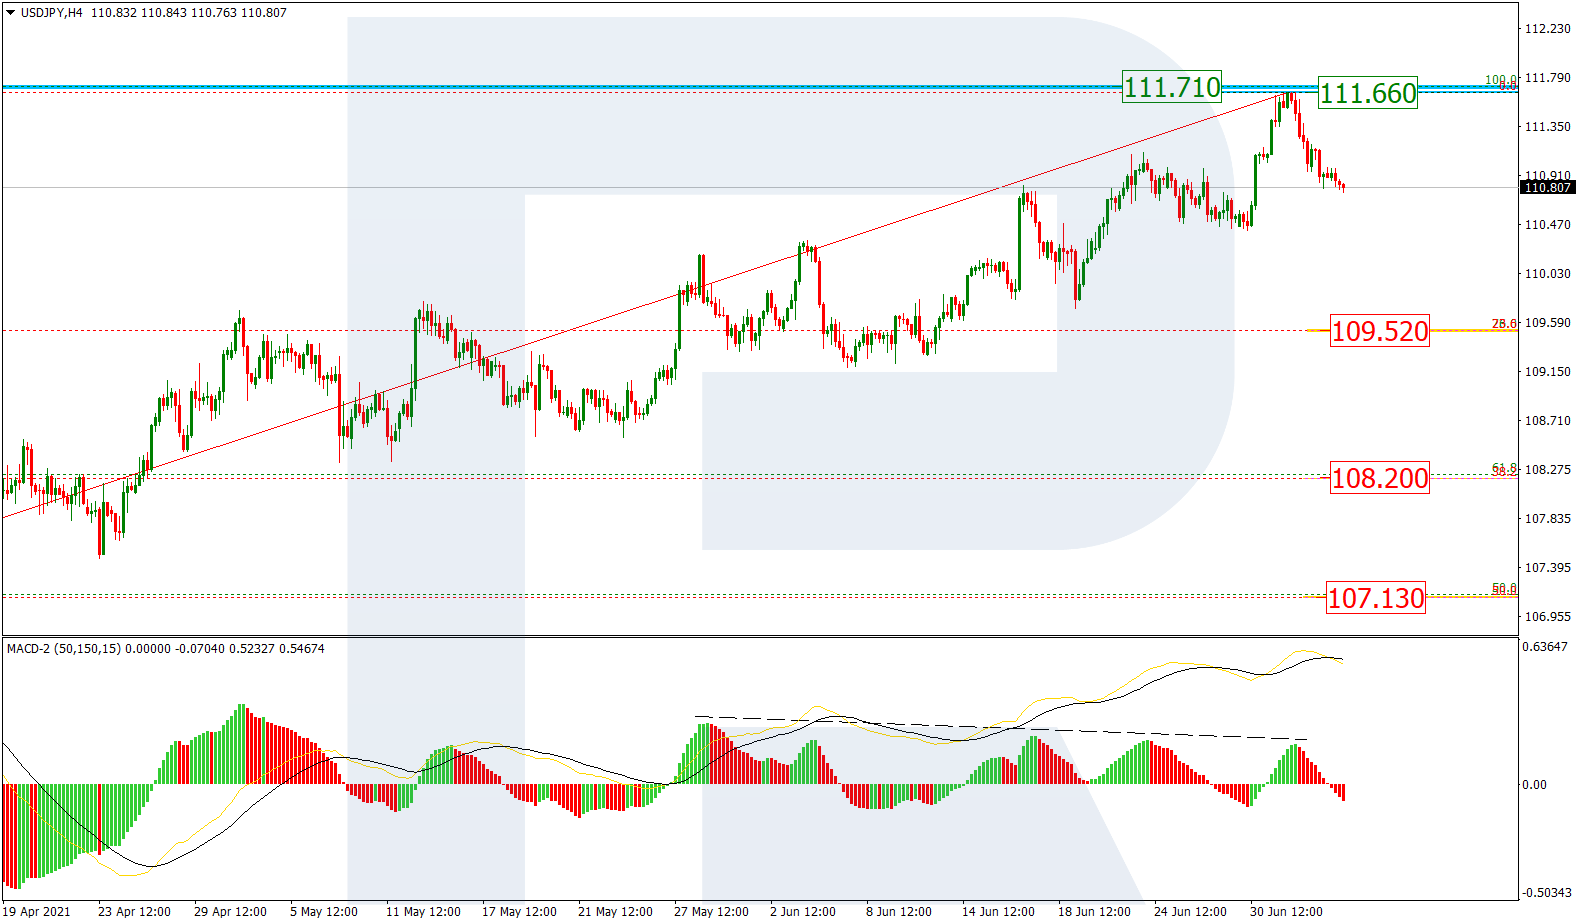
In the H4 chart, a test of the previous fractal high at 111.71 has been followed by divergence on MACD, and now the pair is starting to fall. In general, this movement may be considered as a descending correction. The targets are 23.6%, 38.2%, and 50.0% fibo at 109.52, 108.20, and 107.13 respectively. The local resistance is at 111.66.
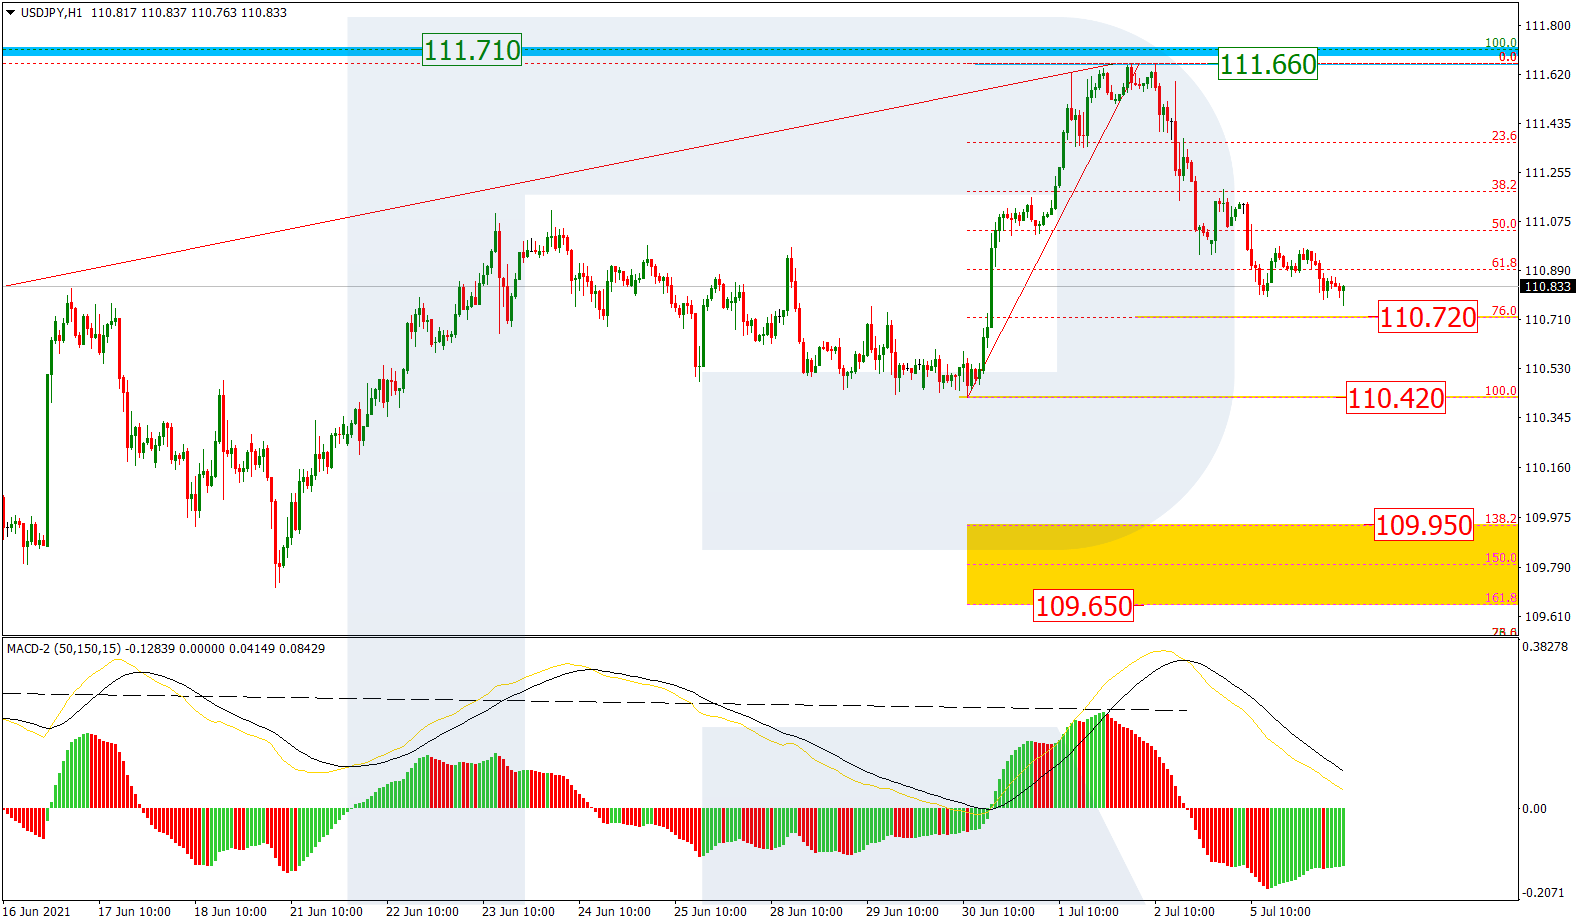
The H1 chart shows a correctional decline after the previous rising impulse. At the moment, the asset is approaching 76.0% fibo at 110.72 and may later continue falling towards the local low at 110.42, a breakout of which may lead to a further downtrend to reach the post-correctional extension area between 138.2% and 161.8% fibo at 109.95 and 109.65 respectively.
Article By RoboForex.com
Attention!
Forecasts presented in this section only reflect the author’s private opinion and should not be considered as guidance for trading. RoboForex LP bears no responsibility for trading results based on trading recommendations described in these analytical reviews.

- GBPUSD Awaits Bank of England Meeting Near April Lows Jun 18, 2026
- Markets disliked the results of the FOMC meeting. HKMA followed the Fed and kept its rate unchanged. Jun 18, 2026
- Gold Surges 2% Since Week Opening Amid Geopolitical Shifts and Fed Expectations Jun 17, 2026
- Your Bourse and FXPRIMUS Bring 24/7 Synthetic Indices to the Global Broker Market Jun 16, 2026
- Institutional investors continue to reduce their presence in metals Jun 16, 2026
- USDJPY Driven by Emotions: Bank of Japan Raises Rate to Highest Level Since 1995 Jun 16, 2026
- The United States and Iran have signed a peace agreement – oil has fallen to 80 dollars per barrel. Jun 15, 2026
- EURUSD Ahead of the New Week: Expecting High Volatility Jun 15, 2026
- COT Metals Charts: Speculator Bets led by Steel Jun 14, 2026
- COT Bonds Charts: Speculator Bets led by 2-Year Bonds & Ultra 10-Year Bonds Jun 14, 2026