
By Han Tan, Market Analyst, ForexTime
It’s a quiet, range bound and directionless day in the markets with the UK and US on holiday. The dollar is flat having given up all its bumper US inflation (core PCE) gains late Friday.
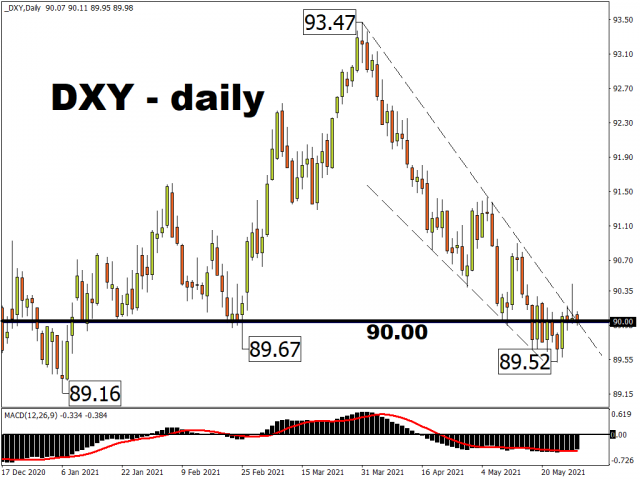
Many economists believe that neither the CPI or PCE numbers have peaked this year and yet bond yields, an excellent indicator ahead of such news, are still very subdued (and actually fell on Friday).
Have we seen the temper tantrum already since US yields have advanced from 0.5% last August to a peak of 1.77% in late March?
While we covered in brief the defining economic data of the week, NFP, in our morning report, there are numerous other events that could move markets and currencies, some of them pointers along the way towards Friday’s release. The employment index of the ISM report out Tuesday and the ADP data the following day, as well as the weekly initial jobless claims may help inform on the US monthly job figures.
Free Reports:
 Sign Up for Our Stock Market Newsletter – Get updated on News, Charts & Rankings of Public Companies when you join our Stocks Newsletter
 Get our Weekly Commitment of Traders Reports - See where the biggest traders (Hedge Funds and Commercial Hedgers) are positioned in the futures markets on a weekly basis.
Wednesday’s ISM will also be closely watched to see if the manufacturing recovery is staying strong. Slowing growth in new orders and output dampened the previous month after the index raced to a 37-year high in March with a reading of 64.7. Fed Chair Powell speaks on Friday at a climate change conference along with the ECB’s Lagarde, and this week will be the last chance for several Fed officials to talk on policy before the blackout period starts on June 5.
RBA to follow the RBNZ?
‘No’ is most certainly the answer with weak inflation numbers and a slowdown in total employment combining to keep policy measures unchanged. In fact, the RBA did signal in their most recent minutes that they would make a decision on the next stage of their QE and bond yield control programme (YCC) at their July meeting. As economies open up round the world, so the RBA will be aware that the domestic recovery should improve, even as Melbourne has been forced into its fourth lockdown since the pandemic began.
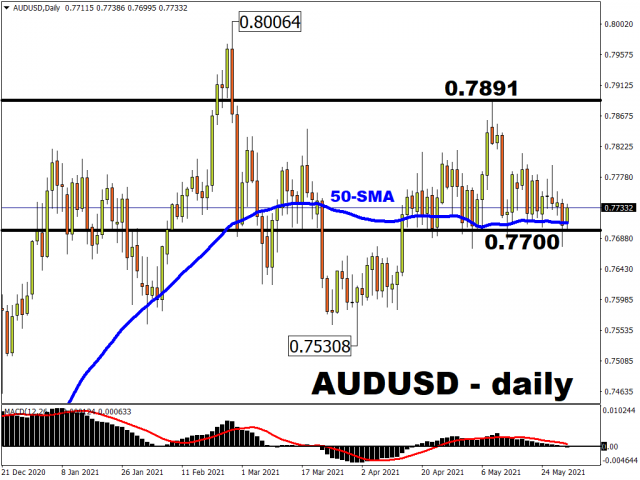
AUD/USD has tracked sideways around 0.77 for some months now, sitting on the 50-day moving average and buffeted by competing forces on its economy.
Any hawkish tilt by the RBA, in step with the Bank of Canada and RBNZ, would see the bulls take charge and push the pair to the top of the range near this month’s high at 0.7891. If the meeting is simply a holding event, traders will wait for the US jobs data to see if the pair can find some direction.
Disclaimer: The content in this article comprises personal opinions and should not be construed as containing personal and/or other investment advice and/or an offer of and/or solicitation for any transactions in financial instruments and/or a guarantee and/or prediction of future performance. ForexTime (FXTM), its affiliates, agents, directors, officers or employees do not guarantee the accuracy, validity, timeliness or completeness, of any information or data made available and assume no liability as to any loss arising from any investment based on the same.
![]() Article by ForexTime
Article by ForexTime
ForexTime Ltd (FXTM) is an award winning international online forex broker regulated by CySEC 185/12 www.forextime.com

- Oil prices fall back to pre‑war levels. Silver drops to a 7‑month low Jun 25, 2026
- Gold Falls to an Eight-Month Low: This May Not Be the Bottom Jun 25, 2026
- Stock indices came under heavy selling pressure amid growing skepticism about AI investments Jun 24, 2026
- The Pound Is Pressured Not by Politics, but by a Strong US Dollar Jun 24, 2026
- Global crude oil prices continued to decline. The AUD/USD exchange rate hit an 11‑week low Jun 23, 2026
- EUR/USD Remains Under Sellers’ Control as the Dollar Stays Strong Jun 23, 2026
- Gold Falls for the Third Consecutive Week: Is There Still Upside Potential? Jun 22, 2026
- Bank Indonesia raised its interest rate. Norges Bank and the SNB left rates unchanged Jun 19, 2026
- EUR/USD Loses Ground as Market Sentiment Favours the US Dollar Jun 19, 2026
- GBPUSD Awaits Bank of England Meeting Near April Lows Jun 18, 2026