
Article By RoboForex.com
GBPUSD, “Great Britain Pound vs US Dollar”
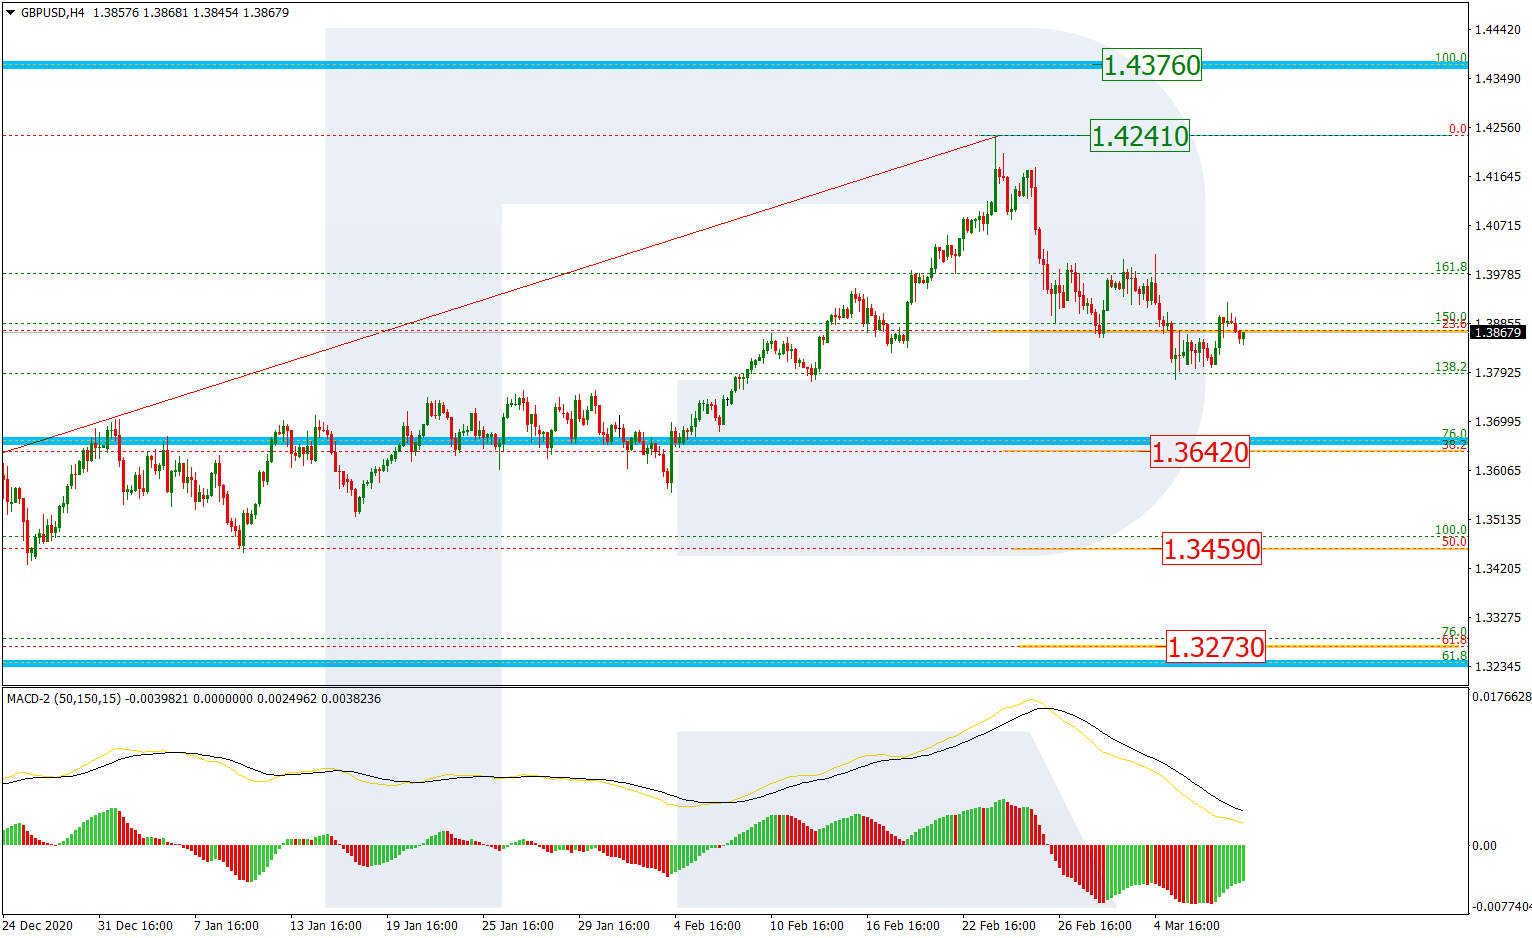
As we can see in the H4 chart, the situation hasn’t changed much. After finishing the uptrend and then reaching 23.6% fibo, GBPUSD is starting a short-term pullback, which may be followed by a further decline towards 38.2%, 50.0%, and 61.8% fibo at 1.3642, 1.3459, and 1.3273 respectively. A breakout of the high will result in a further uptrend towards the long-term fractal high at 1.4376.

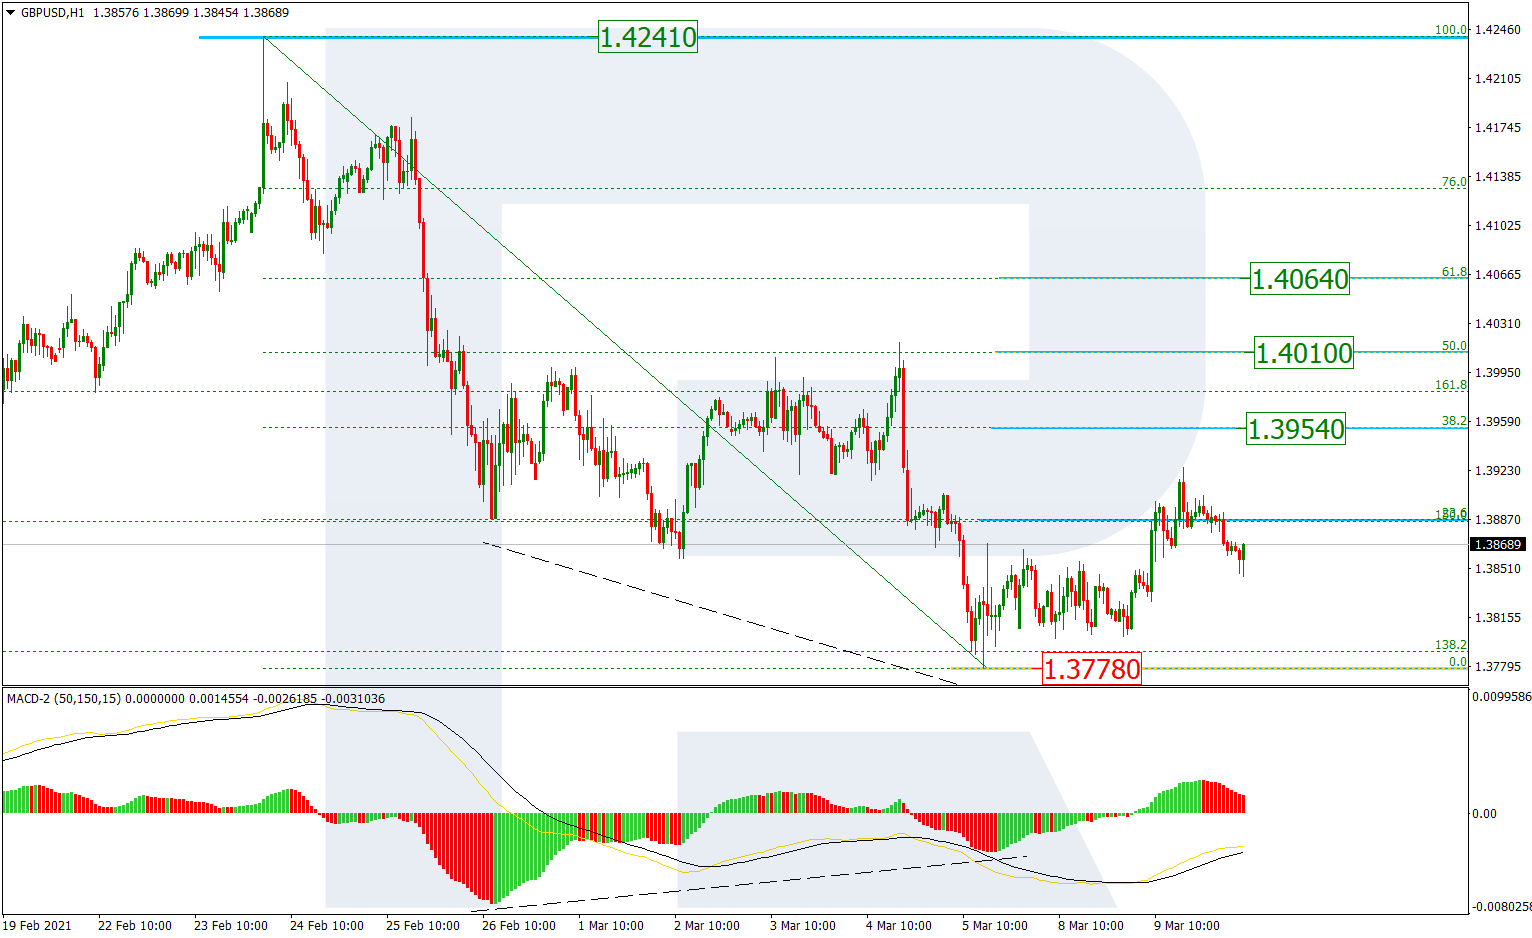
The H1 chart shows an ascending correctional movement after a convergence on MACD, which has already reached 23.6% and may later continue towards 38.2%, 50.0%, and 61.8% fibo at 1.3954, 1.4010, and 1.4064 respectively. A breakout of the low at 1.3778 will result in a further mid-term downtrend.
Free Reports:
 Sign Up for Our Stock Market Newsletter – Get updated on News, Charts & Rankings of Public Companies when you join our Stocks Newsletter
 Get our Weekly Commitment of Traders Reports - See where the biggest traders (Hedge Funds and Commercial Hedgers) are positioned in the futures markets on a weekly basis.
EURJPY, “Euro vs. Japanese Yen”
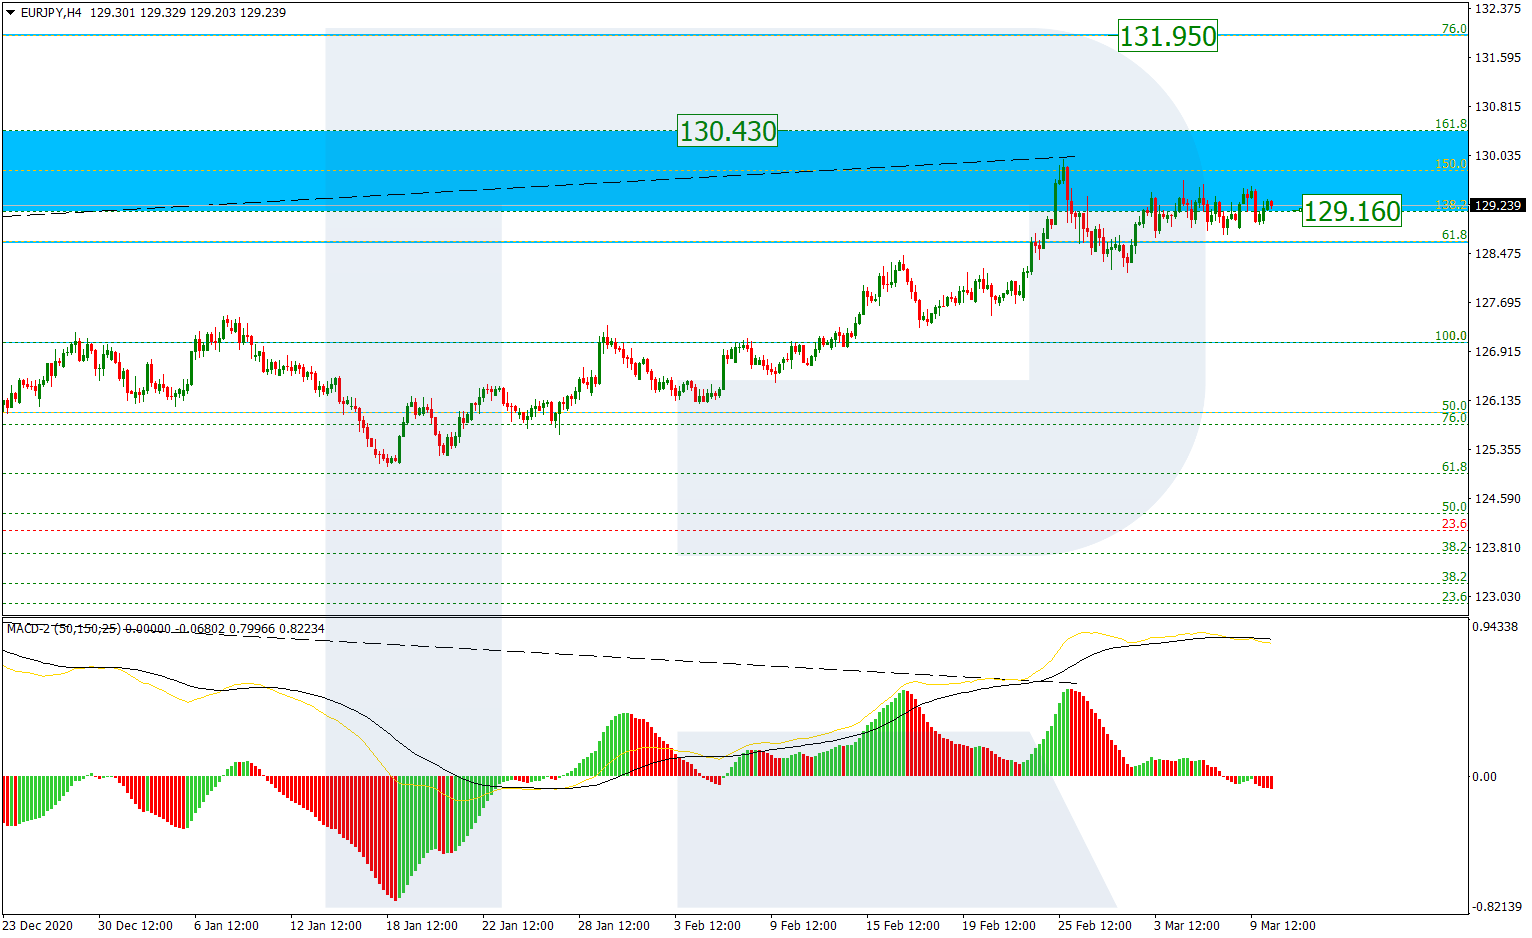
As we can see in the H4 chart, after entering the post-correctional extension area between 138.2% and 161.8% fibo at 129.16 and 130.43 respectively, EURJPY is forming the Triangle correctional pattern. Possibly, the price may complete this correctional movement by breaking the pattern to the upside. After that, the instrument may continue trading within the uptrend to reach 76.0% at 131.95.
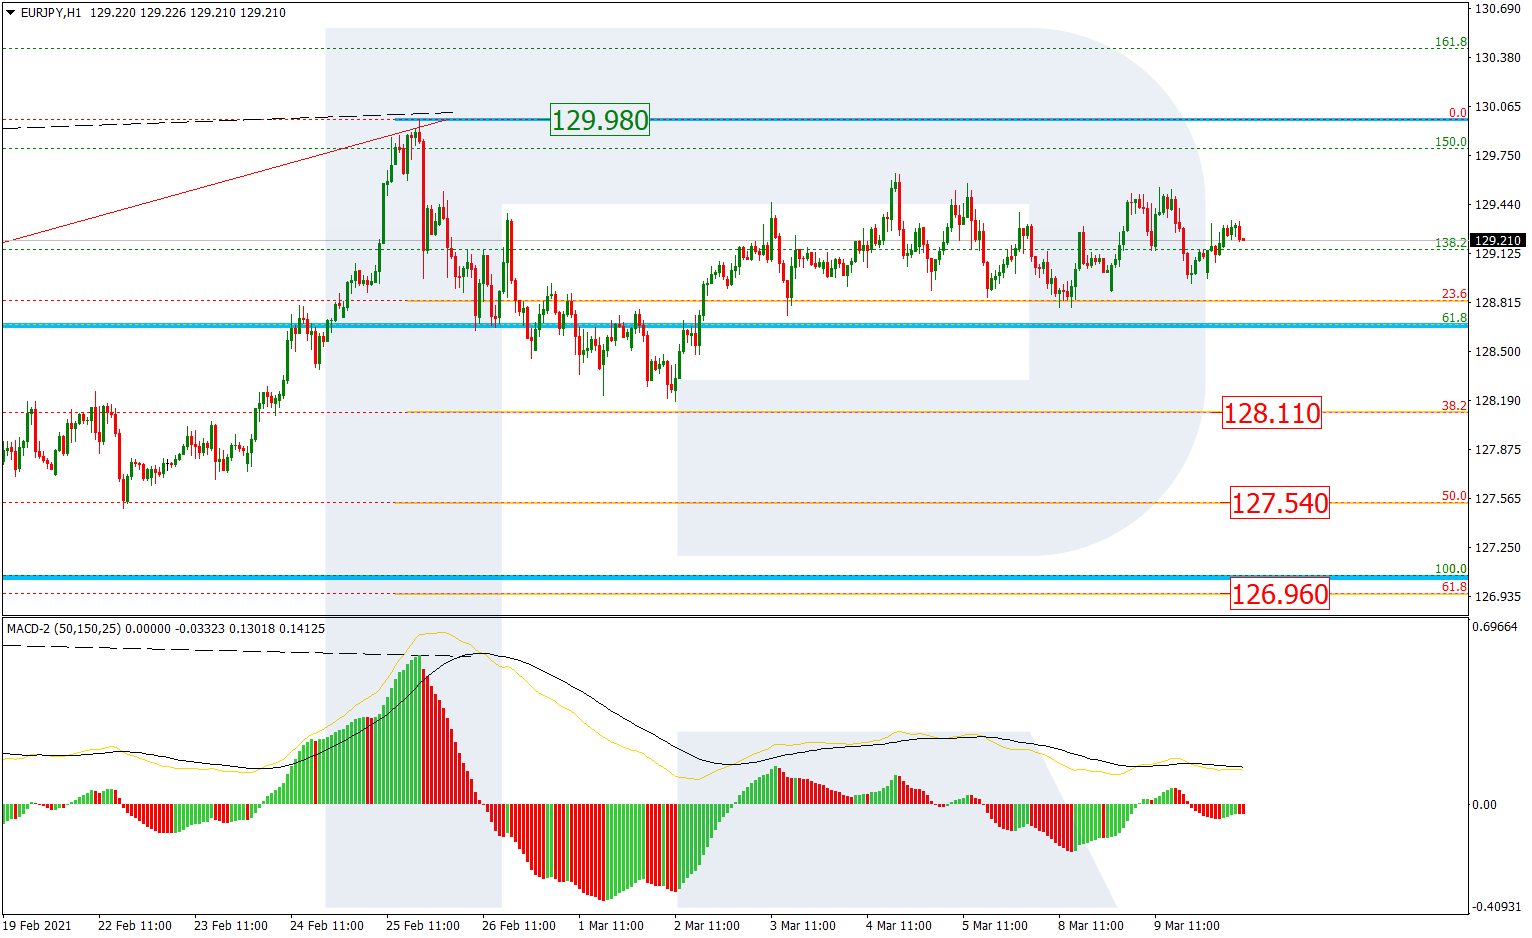
The H1 chart shows a more detailed structure of the current correction. The first descending wave couldn’t reach 38.2% fibo at 128.11 but the rising structure that followed also failed to update the high at 129.98. In this case, the market may start a new decline to reach 50.0% and 61.8% fibo at 127.54 and 126.96 respectively.
Article By RoboForex.com
Attention!
Forecasts presented in this section only reflect the author’s private opinion and should not be considered as guidance for trading. RoboForex LP bears no responsibility for trading results based on trading recommendations described in these analytical reviews.

- EUR/USD: The Advantage Remains with the Dollar Jun 29, 2026
- Escalation of the US–Iran conflict is once again supporting the rise in oil prices Jun 29, 2026
- Oil prices fall back to pre‑war levels. Silver drops to a 7‑month low Jun 25, 2026
- Gold Falls to an Eight-Month Low: This May Not Be the Bottom Jun 25, 2026
- Stock indices came under heavy selling pressure amid growing skepticism about AI investments Jun 24, 2026
- The Pound Is Pressured Not by Politics, but by a Strong US Dollar Jun 24, 2026
- Global crude oil prices continued to decline. The AUD/USD exchange rate hit an 11‑week low Jun 23, 2026
- EUR/USD Remains Under Sellers’ Control as the Dollar Stays Strong Jun 23, 2026
- Gold Falls for the Third Consecutive Week: Is There Still Upside Potential? Jun 22, 2026
- Bank Indonesia raised its interest rate. Norges Bank and the SNB left rates unchanged Jun 19, 2026