
Technology stocks took a huge hit this week after the US sued Facebook for abuse of monopoly power and an announcement from the European Commission to fine technology companies up to 6% of global turnover on abuse of a company’s market dominance.
While the FAANG stocks (Facebook, Apple, Amazon, Netflix and Google) have taken a hit, they are still the companies that are most interesting for investors. Any weakness could be bought, helping these stock prices to push higher.
Apple is poised for an interesting period as it is close to potential breakout territory, after forming an ascending triangle chart pattern formation, as shown below by the blue lines.
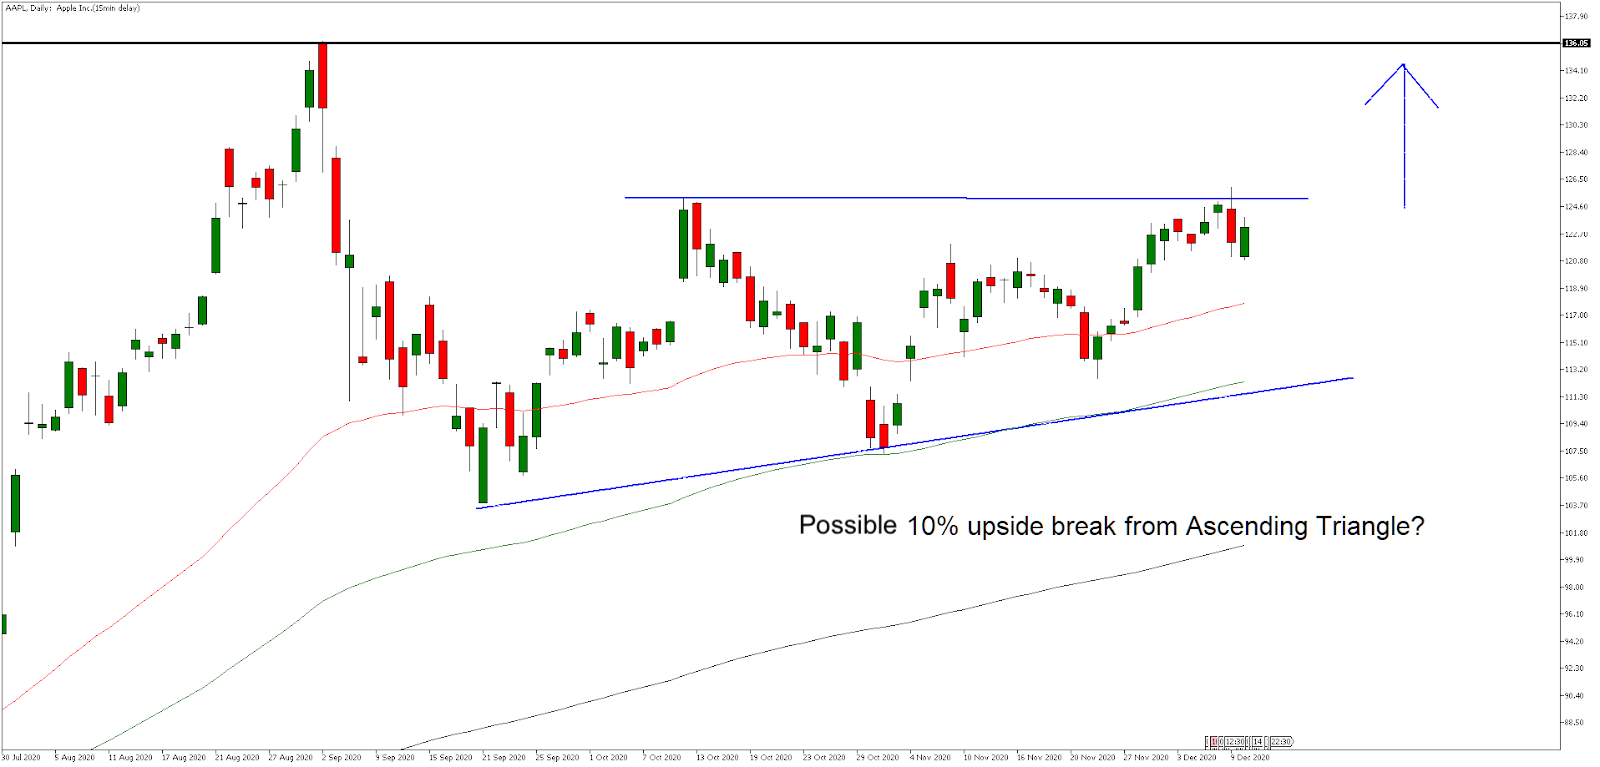
Source: Admiral Markets MetaTrader 5, AAPL, Daily – Data range: from Jul 30, 2020, to Dec 10, 2020, performed on Dec 10, 2020, at 5:30 pm GMT. Please note: Past performance is not a reliable indicator of future results.
Free Reports:
 Sign Up for Our Stock Market Newsletter – Get updated on News, Charts & Rankings of Public Companies when you join our Stocks Newsletter
 Get our Weekly Commitment of Traders Reports - See where the biggest traders (Hedge Funds and Commercial Hedgers) are positioned in the futures markets on a weekly basis.
Last five-year performance: 2019 = +86.61%, 2018 = -6.79%, 2017 = +46.11%, 2016 = +10.03%, 2015 = -4.64%.
The ascending triangle formation is formed of a horizontal resistance level at 125.28, with an ascending trend line support level both shown via the blue lines above. The pattern is a bullish formation where traders would typically employ reversion to the mean trading strategies to trade inside of the triangle pattern, or wait for a breakout into an uptrend.
With Apple products in demand over the holiday season, investors may have reason to be bullish about the company. A break above the technical horizontal resistance line at 125.28 could help the price move towards its all-time high price level at around 136 made in September. This represents roughly 10% upside.
- Learn more about chart patterns and price action strategies in the ‘Price Action Trading Strategies‘ article.
According to BarChart, there has been a huge shift in bullish analyst ratings for Apple stock, as shown below:
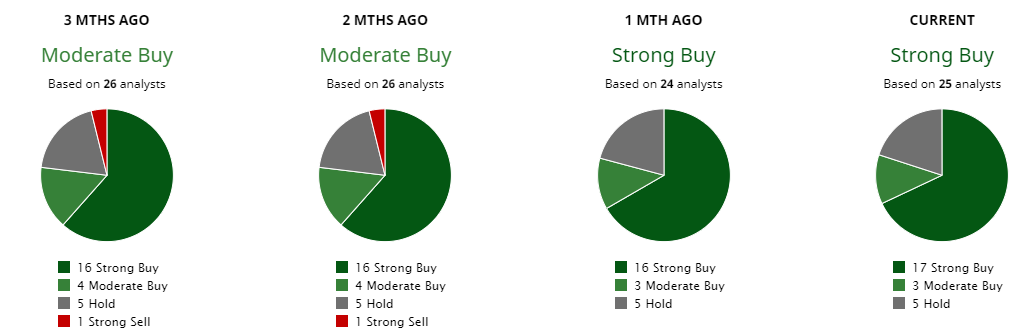
Source: BarChart, December 10, 2020
Did you know that you can use the Trading Central Technical Ideas Lookup indicator to find actionable trading ideas on this index and thousands of other instruments across Forex, stocks, indices, commodities and more?
You can get this indicator completely FREE by upgrading your MetaTrader 5 trading platform provided by Admiral Markets UK Ltd to the exclusive Admiral Markets Supreme Edition! You’ll also receive a whole range of advanced trading tools such as correlation and sentiment indicators!
Start your free download by clicking on the banner below:
INFORMATION ABOUT ANALYTICAL MATERIALS:
The given data provides additional information regarding all analysis, estimates, prognosis, forecasts, market reviews, weekly outlooks or other similar assessments or information (hereinafter “Analysis”) published on the website of Admiral Markets. Before making any investment decisions please pay close attention to the following:
1.This is a marketing communication. The content is published for informative purposes only and is in no way to be construed as investment advice or recommendation. It has not been prepared in accordance with legal requirements designed to promote the independence of investment research, and that it is not subject to any prohibition on dealing ahead of the dissemination of investment research.
2.Any investment decision is made by each client alone whereas Admiral Markets UK Ltd (Admiral Markets) shall not be responsible for any loss or damage arising from any such decision, whether or not based on the content.
3.With view to protecting the interests of our clients and the objectivity of the Analysis, Admiral Markets has established relevant internal procedures for prevention and management of conflicts of interest.
4.The Analysis is prepared by an independent analyst Jitan Solanki, Freelance Contributor (hereinafter “Author”) based on personal estimations.
5.Whilst every reasonable effort is taken to ensure that all sources of the content are reliable and that all information is presented, as much as possible, in an understandable, timely, precise and complete manner, Admiral Markets does not guarantee the accuracy or completeness of any information contained within the Analysis.
6.Any kind of past or modelled performance of financial instruments indicated within the content should not be construed as an express or implied promise, guarantee or implication by Admiral Markets for any future performance. The value of the financial instrument may both increase and decrease and the preservation of the asset value is not guaranteed.
7.Leveraged products (including contracts for difference) are speculative in nature and may result in losses or profit. Before you start trading, please ensure that you fully understand the risks involved.

- GBPUSD Awaits Bank of England Meeting Near April Lows Jun 18, 2026
- Markets disliked the results of the FOMC meeting. HKMA followed the Fed and kept its rate unchanged. Jun 18, 2026
- Gold Surges 2% Since Week Opening Amid Geopolitical Shifts and Fed Expectations Jun 17, 2026
- Your Bourse and FXPRIMUS Bring 24/7 Synthetic Indices to the Global Broker Market Jun 16, 2026
- Institutional investors continue to reduce their presence in metals Jun 16, 2026
- USDJPY Driven by Emotions: Bank of Japan Raises Rate to Highest Level Since 1995 Jun 16, 2026
- The United States and Iran have signed a peace agreement – oil has fallen to 80 dollars per barrel. Jun 15, 2026
- EURUSD Ahead of the New Week: Expecting High Volatility Jun 15, 2026
- COT Metals Charts: Speculator Bets led by Steel Jun 14, 2026
- COT Bonds Charts: Speculator Bets led by 2-Year Bonds & Ultra 10-Year Bonds Jun 14, 2026