
By Orbex
EURUSD Challenges 1.1700 Technical Resistance
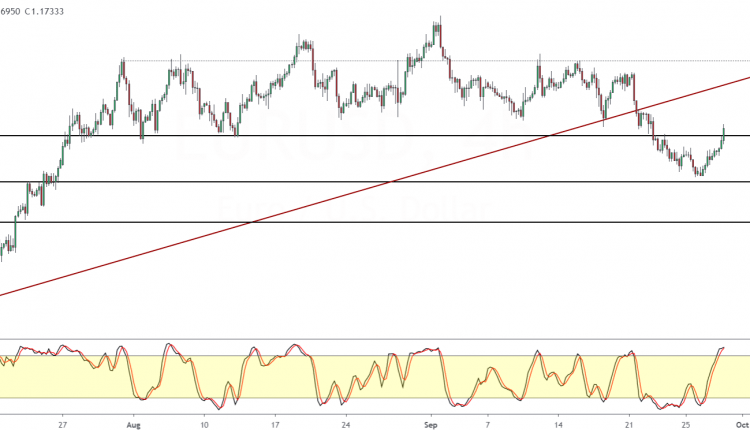
The euro currency is holding on to the gains made for the second consecutive day.
This comes as prices reversed direction just a few pips shy of the 1.1600 level of support.
At the time of writing, the EURUSD is testing the previously held support level near the 1.1700 – 1.1715 region. If resistance forms here, we could expect prices to head back lower.
Adding to this view is the hidden divergence on the 4-hour chart as well.
Free Reports:
 Get our Weekly Commitment of Traders Reports - See where the biggest traders (Hedge Funds and Commercial Hedgers) are positioned in the futures markets on a weekly basis.
 Download Our Metatrader 4 Indicators – Put Our Free MetaTrader 4 Custom Indicators on your charts when you join our Weekly Newsletter
A close below the expected resistance level could potentially send the EURUSD down to the 1.1600 handle. This will probably open the way for further declines.
Below the 1.1600 level of support, the 1.1500 level comes in as support next.
GBPUSD Rises To A One-Week High
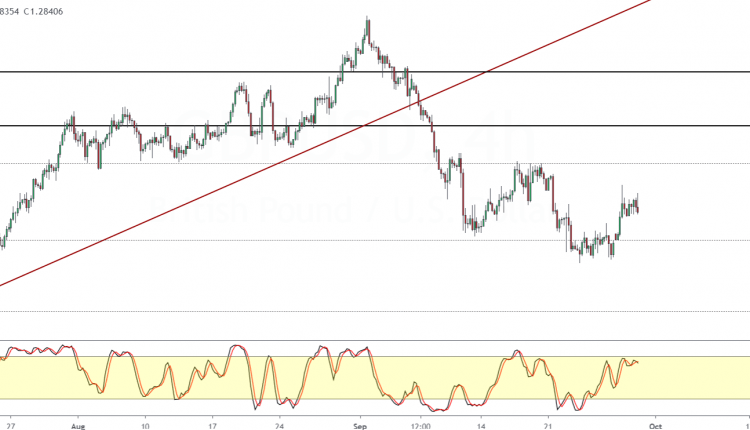
The British pound sterling is marking a correction to the upside.
This follows prices consolidating near the 1.2750 handle over the past few sessions. The current gains, however, looks to be limited.
To the upside, the 1.3000 handle will surely keep a lid on the gains.
While to the downside, the retest of the 1.2750 level could hold prices from falling further. This could mean that the GBPUSD might trade sideways within the said levels.
The breakout from this level could however be strong. We expect this to come following an announcement in regards to the Brexit talks.
As a result, the bias remains mixed for the moment.
Above 1.3000 level, the next key resistance is near 1.3122, and to the downside, below 1.2750, the next support level is near 1.2516.
Oil Prices Retreat, Down Over 3%
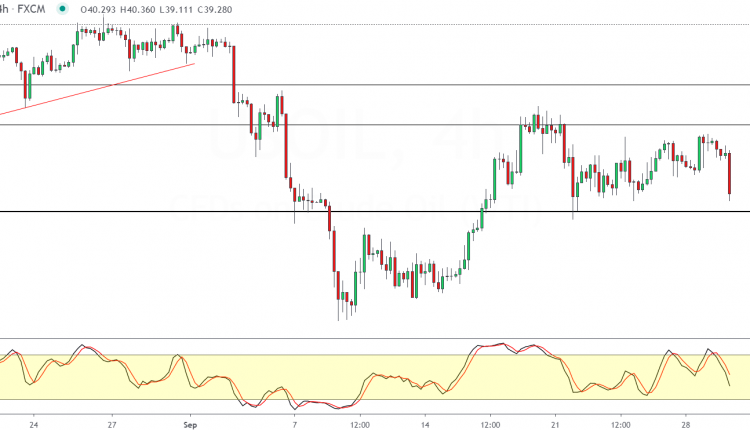
WTI Crude oil prices are trading lower on Tuesday and were down over 3% intraday.
Price action remains steady within the 41.00 and the 38.83 levels of resistance and support respectively.
A breakout from this range to the downside could open up further declines.
Below the 38.83 level of support, oil prices could easily test the 9th September lows of 36.51.
The downside bias gains support as price action has reversed following a lower high formation. This potentially indicates a move to the downside.
However, the weekly bullish candlestick gives hope for an upside move as well.
But a lot of this will depend on how price reacts to the 38.83 level for the moment.
Gold Advances For A Second Day
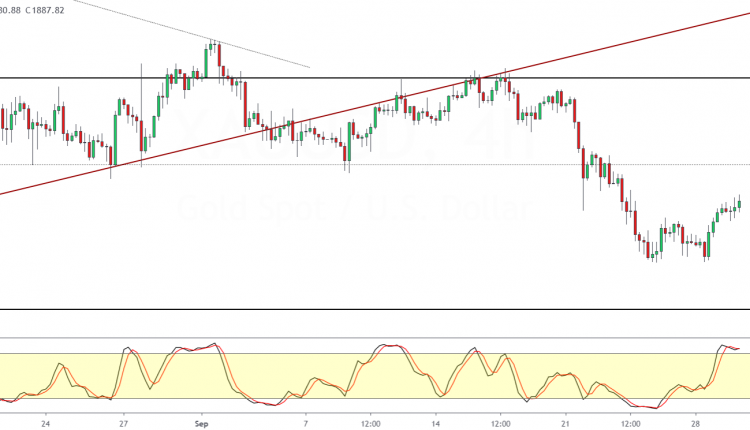
The precious metal is attempting to pare losses from last week as price action is trading stronger for the second consecutive day.
The recovery although nascent comes after prices fell toward the 1850 handle earlier. In the process, we see the double bottom pattern holding up.
This puts the minimum upside back to the 1900 region. Given that 1900 – 1911.50 held up as a strong support level, we expect prices to reverse gains here.
A reversal off this region could keep prices floating above the 1850 handle in short term, but further gains could come if this 1850 support breaks.
The next main downside target will be the 1817.80 region.
By Orbex

- Gold Surges 2% Since Week Opening Amid Geopolitical Shifts and Fed Expectations Jun 17, 2026
- Your Bourse and FXPRIMUS Bring 24/7 Synthetic Indices to the Global Broker Market Jun 16, 2026
- Institutional investors continue to reduce their presence in metals Jun 16, 2026
- USDJPY Driven by Emotions: Bank of Japan Raises Rate to Highest Level Since 1995 Jun 16, 2026
- The United States and Iran have signed a peace agreement – oil has fallen to 80 dollars per barrel. Jun 15, 2026
- EURUSD Ahead of the New Week: Expecting High Volatility Jun 15, 2026
- COT Metals Charts: Speculator Bets led by Steel Jun 14, 2026
- COT Bonds Charts: Speculator Bets led by 2-Year Bonds & Ultra 10-Year Bonds Jun 14, 2026
- COT Energy Charts: Speculator Bets led by Brent Oil Jun 14, 2026
- COT Soft Commodities Charts: Weekly Speculator Bets led lower by Corn and Soybean Meal Jun 14, 2026