
Author: Dmitriy Gurkovskiy, Chief Analyst at RoboForex
On the final September Monday, the major currency pair is sticking to its two-month lows and trading around 1.1634.
The start of this week is anticipated to be calm for EUR/USD but there will be a lot of news later.
As usual, at the beginning of every month, the USA is going to report on its labor market and September readings may raise a lot of questions. The first of them is whether the positive impulse, which helped to eliminate the spring crisis with jobs and labor force, is still strong or on the decline and may start consolidating? If the employment indicators do not steadily improve, there will be talks about additional stimulus packages, which is a serious problem.
This week, the USA will publish the final report on the country’s GDP for the second quarter of 2020. If the actual readings are not worse than expected, the USD may find some support because all problems in this area have already been included in prices.
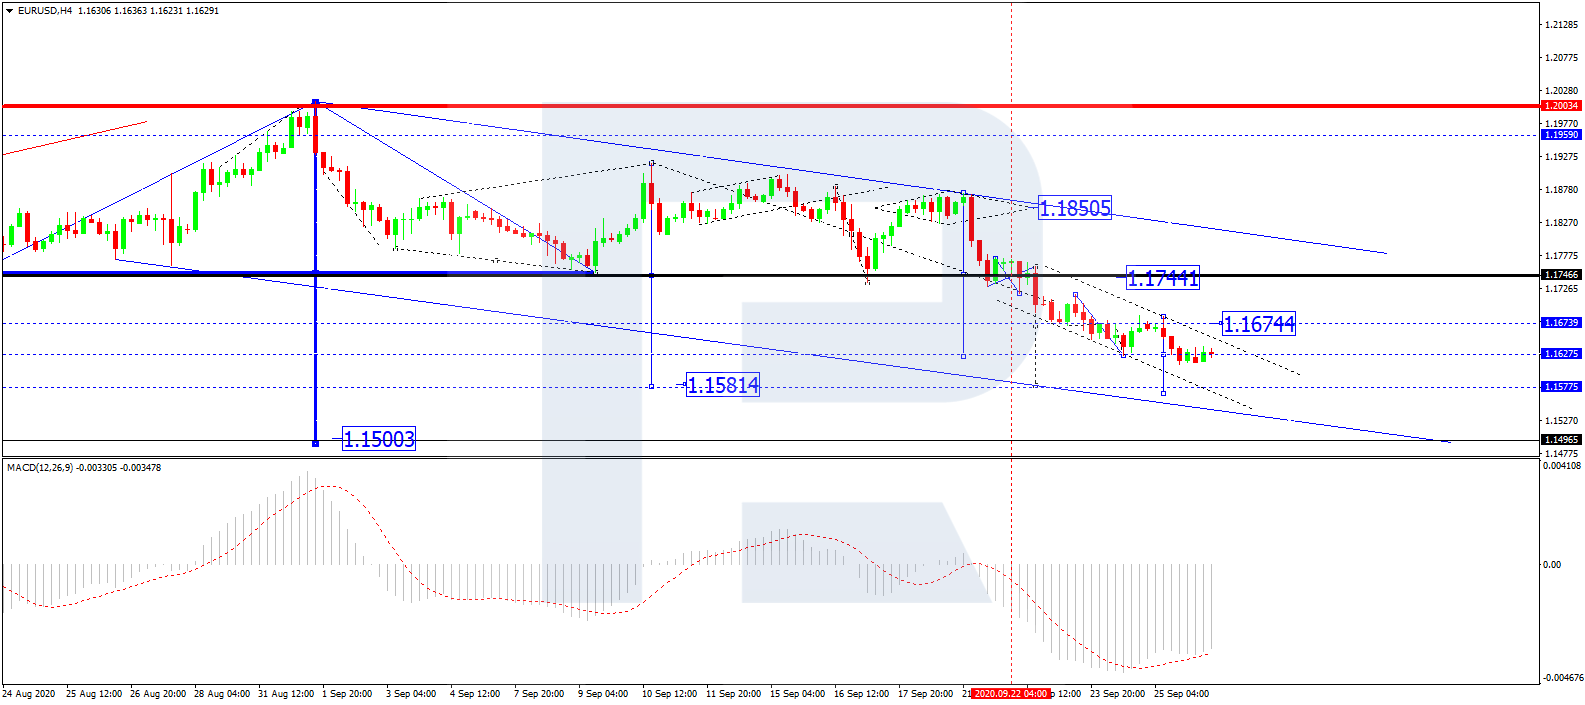
In the H4 chart, EUR/USD is forming the third descending wave with the target at 1.1600. Later, the market may correct towards 1.1744 and then continue trading inside the downtrend with the target at 1.1500. From the technical point of view, this scenario is confirmed by MACD Oscillator: its signal line is no longer moving inside the histogram area. However, taking into account that on the price chart the instrument may yet continue falling, the line is not expected to rise towards 0 until the price reaches the target. If later the line breaks 0, there might be a new correction on the price chart.
Free Reports:
 Download Our Metatrader 4 Indicators – Put Our Free MetaTrader 4 Custom Indicators on your charts when you join our Weekly Newsletter
 Get our Weekly Commitment of Traders Reports - See where the biggest traders (Hedge Funds and Commercial Hedgers) are positioned in the futures markets on a weekly basis.
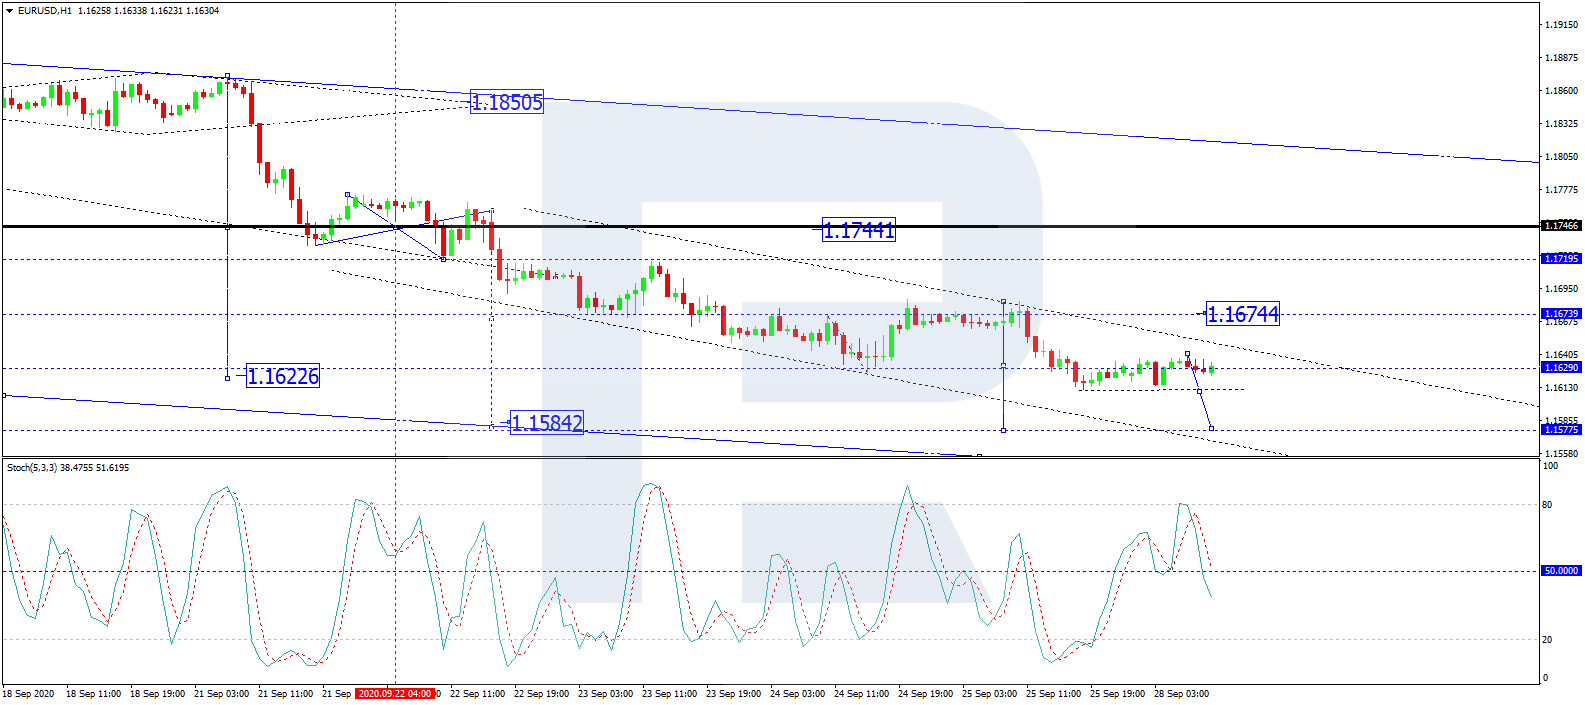
As we can see in the H1 chart, after breaking 1.1640, EUR/USD is consolidating below it. Possibly, the pair may test this level from below and then resume falling to break 1.1612. After that, the instrument may continue trading downwards to reach 1.1600 at least. From the technical point of view, this scenario is confirmed by Stochastic Oscillator: its signal line is moving downwards and has already broken 50. Later, it may continue falling to reach 20. Only after the line leaves the area of 20, the asset may start a correction on the price chart.
Disclaimer
Any forecasts contained herein are based on the author’s particular opinion. This analysis may not be treated as trading advice. RoboForex bears no responsibility for trading results based on trading recommendations and reviews contained herein.

- EUR/USD: The Advantage Remains with the Dollar Jun 29, 2026
- Escalation of the US–Iran conflict is once again supporting the rise in oil prices Jun 29, 2026
- Oil prices fall back to pre‑war levels. Silver drops to a 7‑month low Jun 25, 2026
- Gold Falls to an Eight-Month Low: This May Not Be the Bottom Jun 25, 2026
- Stock indices came under heavy selling pressure amid growing skepticism about AI investments Jun 24, 2026
- The Pound Is Pressured Not by Politics, but by a Strong US Dollar Jun 24, 2026
- Global crude oil prices continued to decline. The AUD/USD exchange rate hit an 11‑week low Jun 23, 2026
- EUR/USD Remains Under Sellers’ Control as the Dollar Stays Strong Jun 23, 2026
- Gold Falls for the Third Consecutive Week: Is There Still Upside Potential? Jun 22, 2026
- Bank Indonesia raised its interest rate. Norges Bank and the SNB left rates unchanged Jun 19, 2026