
Article By RoboForex.com
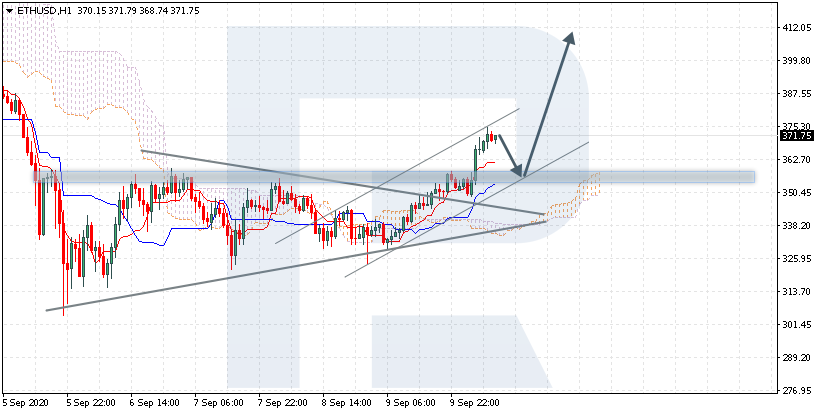
ETHUSD, “Ethereum vs US Dollar”
ETHUSD is trading at 371.15 above the Ichimoku Cloud, suggesting an uptrend. Also, it has broken away the upper border of the Triangle pattern, suggesting the growth of the price for the height of the pattern. A test of the signal lines of the indicator near 355.65 is expected, followed by growth to 410.55. An additional signal confirming the growth will be a bounce off the lower border of the ascending channel. The growth will be canceled in the case of a breakaway of the lower border of the Cloud and securing under 325.05, which will mean further declining to 300.50.

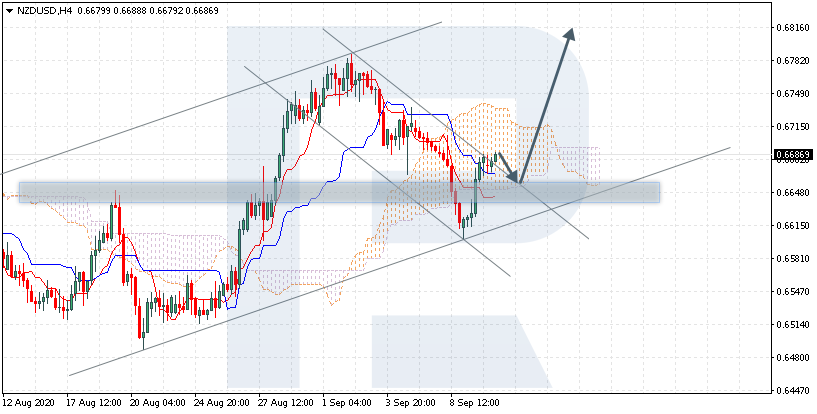
NZDUSD, “New Zealand vs. US Dollar”
NZDUSD is trading at 0.6686 inside the Ichimoku Cloud, suggesting a flat. The quotations returned into the Cloud after they broke through it downwards, which indicates pressure from buyers. A test of the lower border of the Cloud at 0.6650 is expected, followed by growth to 0.6820. An additional signal confirming the growth will be a bounce off the upper border of the descending channel. The growth will be canceled in the case of a breakaway of the lower border of the Cloud and closing under 0.6610, which will mean further falling to 0.6525. Conversely, the growth will be confirmed by a breakaway of the upper border of the Cloud and securing above 0.6750, which will mean the bullish trend resumes.
Free Reports:
 Download Our Metatrader 4 Indicators – Put Our Free MetaTrader 4 Custom Indicators on your charts when you join our Weekly Newsletter
 Get our Weekly Commitment of Traders Reports - See where the biggest traders (Hedge Funds and Commercial Hedgers) are positioned in the futures markets on a weekly basis.
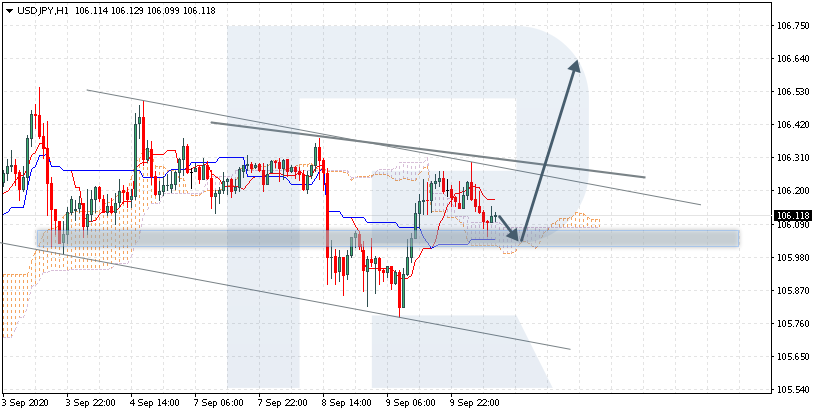
USDJPY, “US Dollar vs Japanese Yen”
USDJPY is trading at 106.11 above the Ichimoku Cloud, suggesting an uptrend. A test of the lower border of the Cloud at 105.85 is expected, followed by growth to 106.65. An additional signal confirming the growth will be a bounce off the support level. The growth will be canceled in the case of a breakaway of the lower border of the Cloud and closing under 105.85, which will mean further declining to 104.95. Conversely, the growth will be confirmed by a breakaway of the upper border of the descending channel and securing above 106.35, which will also mean a reversal Head and Shoulders pattern is forming.
Article By RoboForex.com
Attention!
Forecasts presented in this section only reflect the author’s private opinion and should not be considered as guidance for trading. RoboForex LP bears no responsibility for trading results based on trading recommendations described in these analytical reviews.

- Bank Indonesia raised its interest rate. Norges Bank and the SNB left rates unchanged Jun 19, 2026
- EUR/USD Loses Ground as Market Sentiment Favours the US Dollar Jun 19, 2026
- GBPUSD Awaits Bank of England Meeting Near April Lows Jun 18, 2026
- Markets disliked the results of the FOMC meeting. HKMA followed the Fed and kept its rate unchanged. Jun 18, 2026
- Gold Surges 2% Since Week Opening Amid Geopolitical Shifts and Fed Expectations Jun 17, 2026
- Your Bourse and FXPRIMUS Bring 24/7 Synthetic Indices to the Global Broker Market Jun 16, 2026
- Institutional investors continue to reduce their presence in metals Jun 16, 2026
- USDJPY Driven by Emotions: Bank of Japan Raises Rate to Highest Level Since 1995 Jun 16, 2026
- The United States and Iran have signed a peace agreement – oil has fallen to 80 dollars per barrel. Jun 15, 2026
- EURUSD Ahead of the New Week: Expecting High Volatility Jun 15, 2026