
Article By RoboForex.com
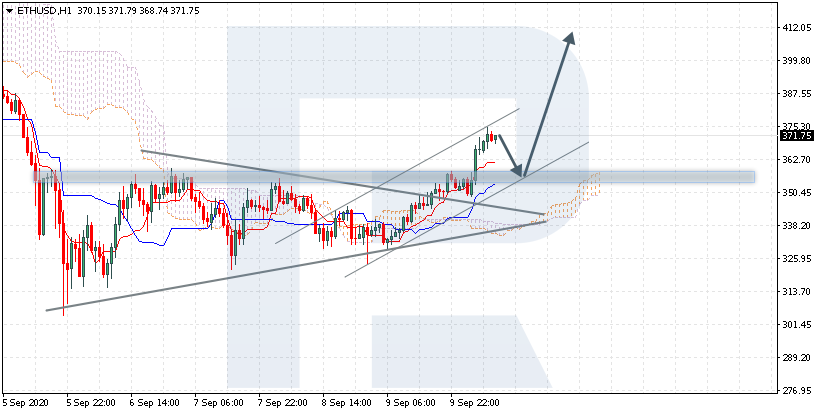
ETHUSD, “Ethereum vs US Dollar”
ETHUSD is trading at 371.15 above the Ichimoku Cloud, suggesting an uptrend. Also, it has broken away the upper border of the Triangle pattern, suggesting the growth of the price for the height of the pattern. A test of the signal lines of the indicator near 355.65 is expected, followed by growth to 410.55. An additional signal confirming the growth will be a bounce off the lower border of the ascending channel. The growth will be canceled in the case of a breakaway of the lower border of the Cloud and securing under 325.05, which will mean further declining to 300.50.

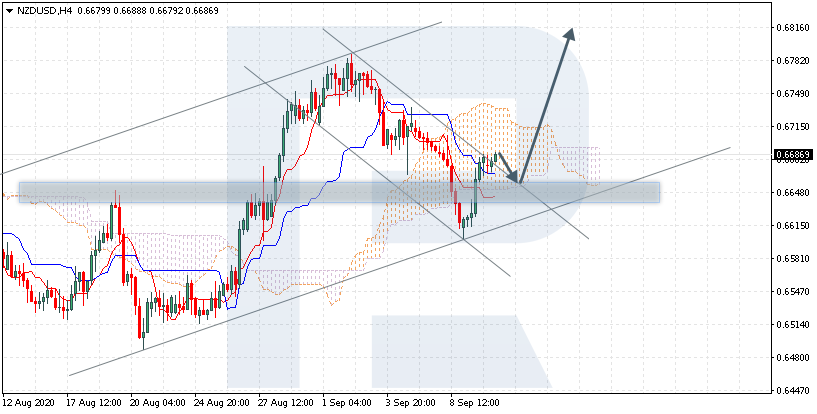
NZDUSD, “New Zealand vs. US Dollar”
NZDUSD is trading at 0.6686 inside the Ichimoku Cloud, suggesting a flat. The quotations returned into the Cloud after they broke through it downwards, which indicates pressure from buyers. A test of the lower border of the Cloud at 0.6650 is expected, followed by growth to 0.6820. An additional signal confirming the growth will be a bounce off the upper border of the descending channel. The growth will be canceled in the case of a breakaway of the lower border of the Cloud and closing under 0.6610, which will mean further falling to 0.6525. Conversely, the growth will be confirmed by a breakaway of the upper border of the Cloud and securing above 0.6750, which will mean the bullish trend resumes.
Free Reports:
 Sign Up for Our Stock Market Newsletter – Get updated on News, Charts & Rankings of Public Companies when you join our Stocks Newsletter
 Get our Weekly Commitment of Traders Reports - See where the biggest traders (Hedge Funds and Commercial Hedgers) are positioned in the futures markets on a weekly basis.
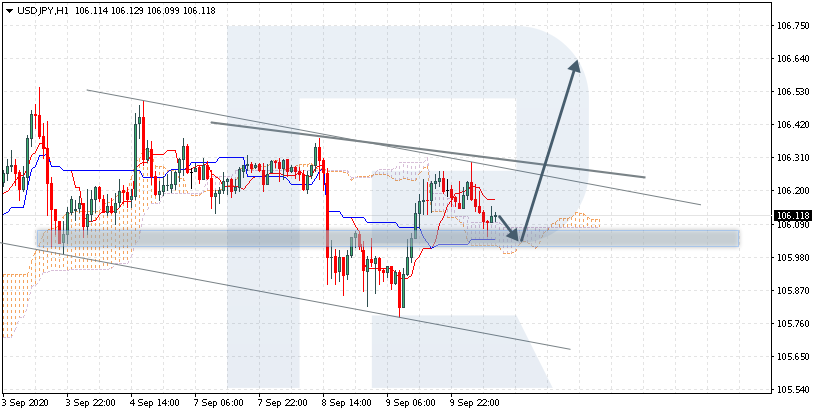
USDJPY, “US Dollar vs Japanese Yen”
USDJPY is trading at 106.11 above the Ichimoku Cloud, suggesting an uptrend. A test of the lower border of the Cloud at 105.85 is expected, followed by growth to 106.65. An additional signal confirming the growth will be a bounce off the support level. The growth will be canceled in the case of a breakaway of the lower border of the Cloud and closing under 105.85, which will mean further declining to 104.95. Conversely, the growth will be confirmed by a breakaway of the upper border of the descending channel and securing above 106.35, which will also mean a reversal Head and Shoulders pattern is forming.
Article By RoboForex.com
Attention!
Forecasts presented in this section only reflect the author’s private opinion and should not be considered as guidance for trading. RoboForex LP bears no responsibility for trading results based on trading recommendations described in these analytical reviews.

- The Tech‑heavy NASDAQ Index jumped by more than 3.3%. The offshore yuan is trading at its highest level since 2023 Jul 31, 2026
- USD/JPY After Volatility: Multiple Events in One Day Jul 31, 2026
- The US indices sell off amid renewed US-Iran clashes. Oil jumps by 7% Jul 30, 2026
- USD/JPY Temporary in Equilibrium: Multiple Factors in Focus Jul 30, 2026
- GBP/USD at Month’s Lows: The Outlook Remains Weak Jul 29, 2026
- Crude oil falls below $80 per barrel. Australia sees inflation slowdown Jul 29, 2026
- The US Tech sector hit by sell‑off. Oil prices decline on renewed negotiations Jul 28, 2026
- Gold Declines, Focus on Fed and Falling Oil Prices Jul 28, 2026
- This week will be one of the most crowded for central‑bank meetings Jul 27, 2026
- EUR/USD Ahead of a Key Week: Holding Near Lows Jul 27, 2026