By RoboForex Analytical Department
The price of gold fell on Monday, dropping to 3,290 USD per troy ounce amid easing market tensions.
Key factors driving gold’s decline
The sell-off in the safe-haven asset was driven by reduced risk aversion, as trade tensions between the US and China showed signs of easing. This weakened gold’s appeal as a traditional hedge against uncertainty.
Earlier, US President Donald Trump hinted at a potential softening of his tough trade stance towards China, signalling the possibility of tariff negotiations. On Friday, China exempted certain US goods from its 25% tariffs, though Beijing stopped short of confirming any scheduled trade talks with Washington.
Additional downward pressure came from a strengthening US dollar, which made dollar-priced gold more expensive for foreign investors.
Free Reports:
Upcoming US economic data in focus. This week, a raft of key US economic indicators will be released, including:
These reports could provide fresh clues on the Federal Reserve’s next policy moves and the broader economic outlook.
Technical analysis: XAU/USD
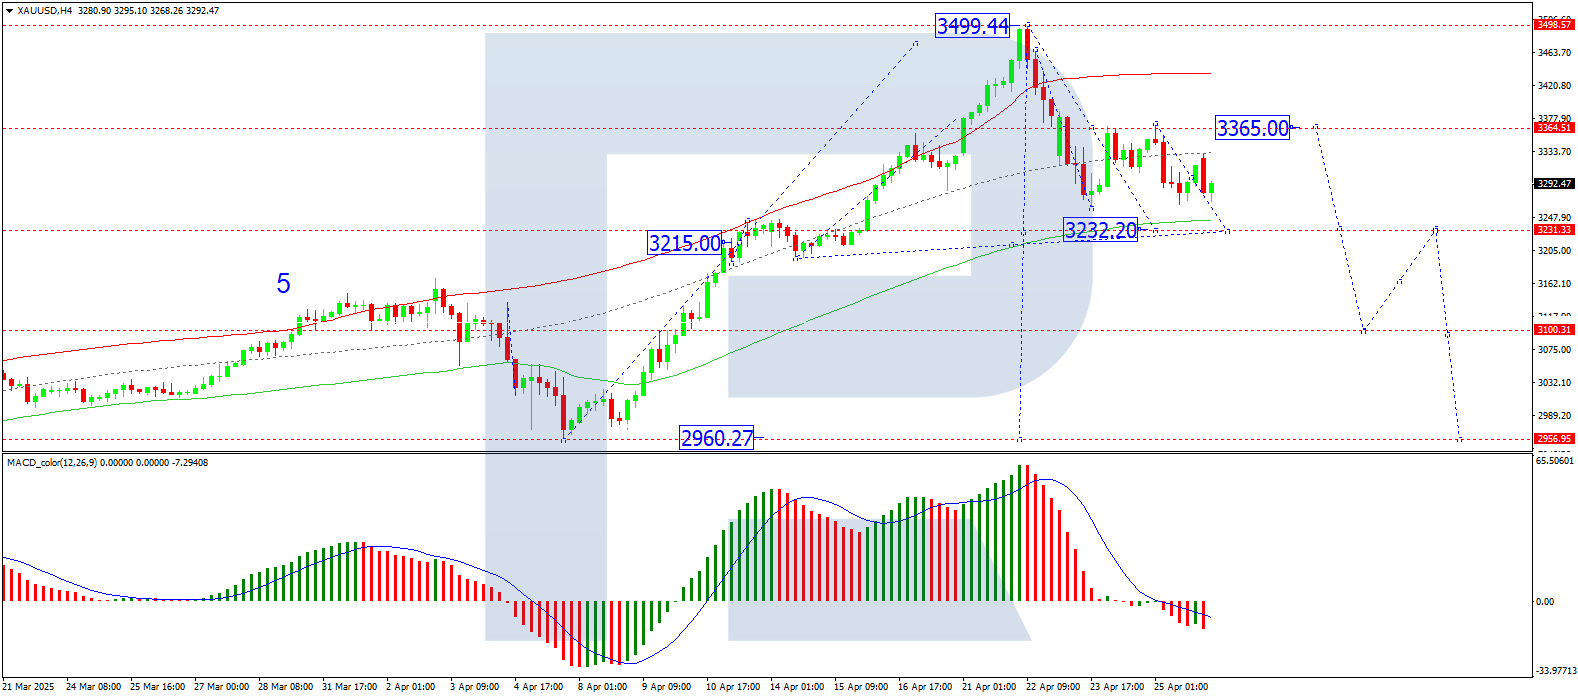
On the H4 chart, XAU/USD is forming the fifth structure in the first wave of decline to the 3,232 level. A move to this target level seems likely. Further, a correction to the level of 3,365 is possible. After completing this correction, a new wave of decline to the 3,100 level is probable. The target is local. Technically, this scenario is confirmed by the MACD indicator, with its signal line under the zero level and directed strictly downwards.
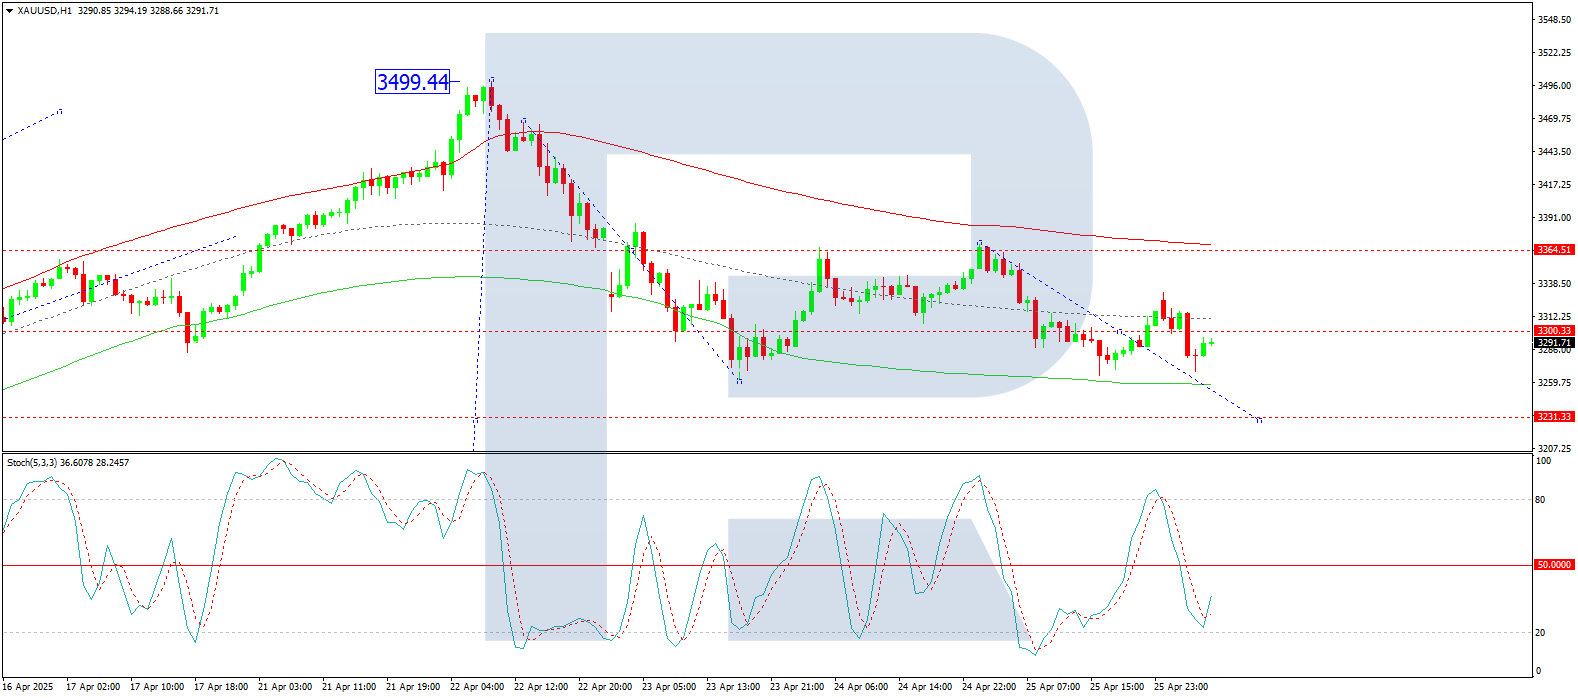
On the H1 chart, XAU/USD has formed a consolidation range around the level of 3,300, and with an exit down, a decline to 3,232 is probable. Today, the fifth wave of the decline to at least 3,232 seems highly likely. Technically, this scenario is confirmed by the Stochastic oscillator. Its signal line is under the 50 level and directed strictly downwards to the 20 level.
Conclusion
Gold remains vulnerable to further losses amid improving US-China trade sentiment and a stronger dollar. Traders will closely monitor upcoming US data for further directional cues.
Disclaimer
Any forecasts contained herein are based on the author’s particular opinion. This analysis may not be treated as trading advice. RoboForex bears no responsibility for trading results based on trading recommendations and reviews contained herein.
By ForexTime FXTM’s USDInd ↑ 2% MTD Dollar best performing G10 currency MTD Geopolitical risk…
By JustMarkets The US stock market concluded Thursday’s session in the red as the escalating…
By Analytical Department RoboForex EUR/USD is holding near 1.1620 on Friday, with the US dollar…
By JustMarkets The US stock market rose on Wednesday. By the end of the day,…
By Daniele D'Alvia, Queen Mary University of London When a conflict escalates, financial markets respond…
By Analytical Department RoboForex GBP/USD contracted to 1.3350 on Thursday, with the pound remaining under…
This website uses cookies.