By RoboForex Analytical Department
USD/JPY has been struggling to break past the resistance level at 149.55 despite repeated attempts over the past five trading sessions. The Japanese yen remains under pressure as the Federal Reserve signals a more moderate approach to interest rate cuts in its upcoming meetings, contrasting with the broader expectations of more aggressive rate reductions.
Further complicating the currency dynamics, recent fiscal stimulus announcements from China have yet to manage to bolster market confidence. Over the weekend, China’s Finance Minister Lan Fo’an detailed plans for additional capital injections into state-owned banks and measures to support the property market. However, the lack of specific details regarding the spending amount and the precise nature of these measures left investors feeling uncertain about the effectiveness and scale of the proposed stimulus.
In Japan, dovish comments from Bank of Japan Governor Kazuo Ueda and opposition from new Prime Minister Shigeru Ishiba against further rate hikes have added to the pressure on the yen. Earlier this month, Ishiba expressed concerns that the current economic conditions do not warrant additional rate increases. However, other senior officials later softened this stance, indicating some internal conflict or reassessment within the Japanese government regarding monetary policy.
Technical analysis of USD/JPY
Free Reports:
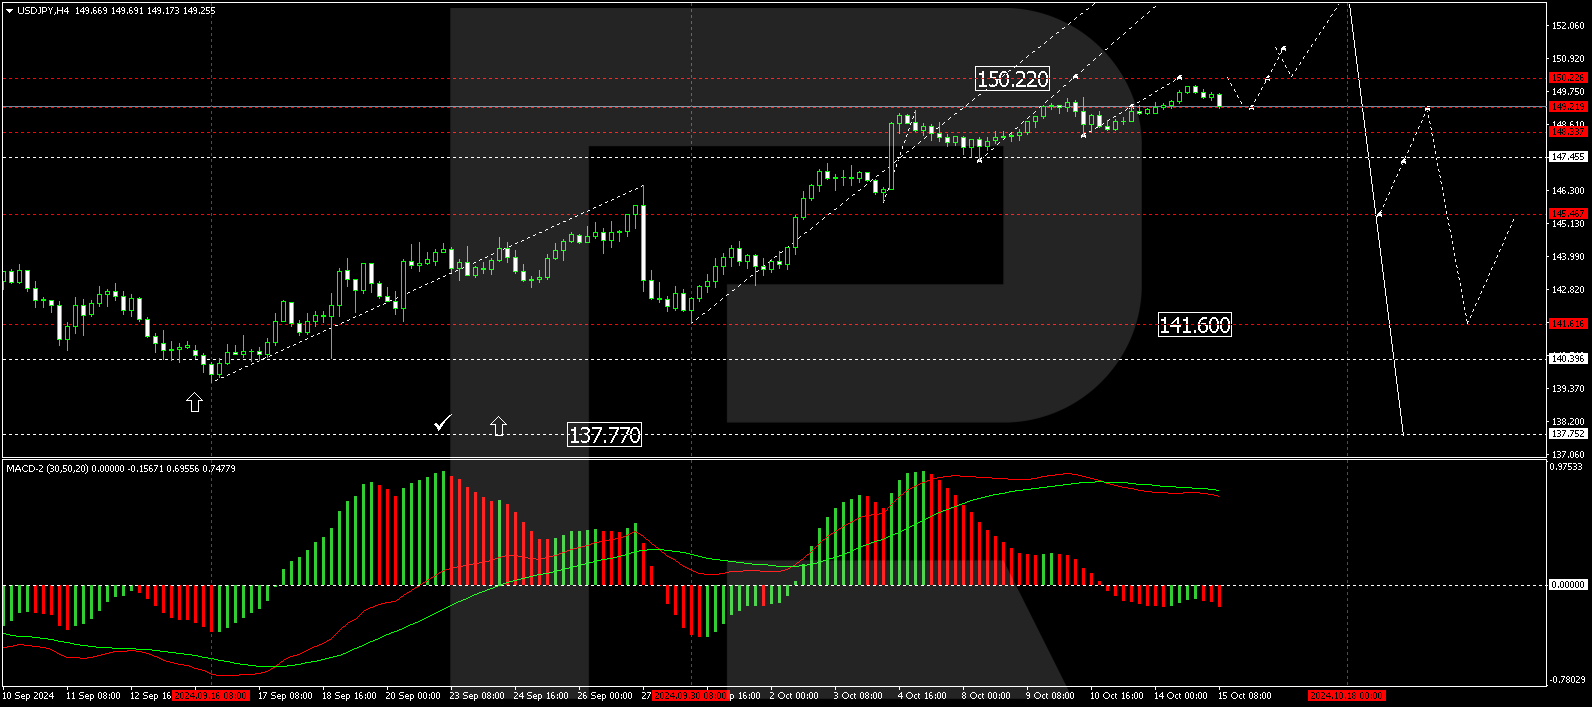
The USD/JPY pair is currently within a broad consolidation range around 149.22. The range has expanded to 149.96, and the market is now forming a downward movement towards 149.22, testing this level from above. If the market rebounds from here, we might see an ascent towards 150.22. A break above this level could signal a continuation towards 153.22. Conversely, a drop below 148.88 could lead to a further correction down to 147.47. The MACD indicator supports this view, with the signal line high above zero but starting to descend towards it, suggesting a potential shift in momentum.
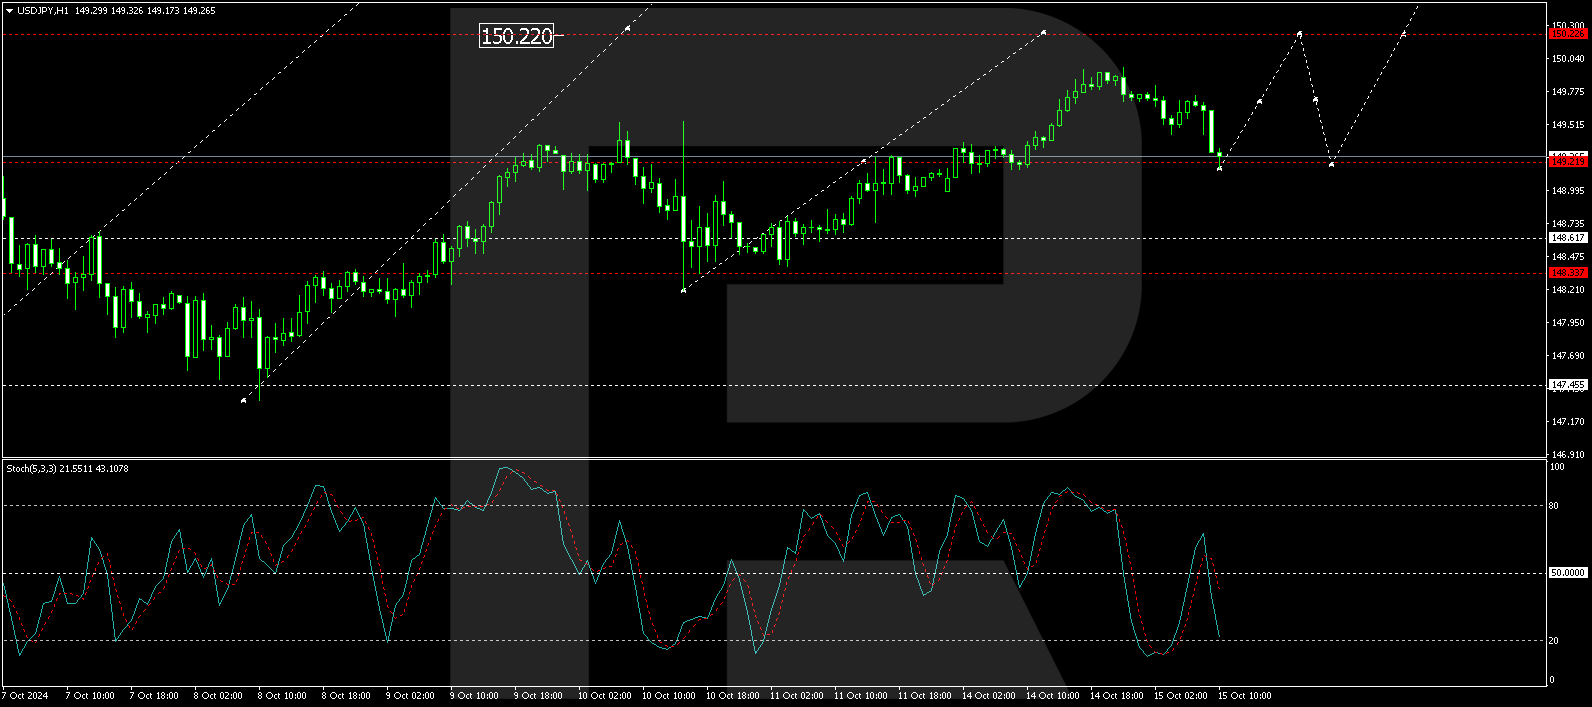
On the hourly chart, USD/JPY has completed a growth wave to 149.96 and is undergoing a correction to 149.22. Following this corrective phase, the market is expected to resume its upward trajectory towards 150.22. This movement aligns with the Stochastic oscillator’s current trajectory, which shows the signal line moving upwards from 50 towards 80, indicating potential for further gains in the short term.
Disclaimer
Any forecasts contained herein are based on the author’s particular opinion. This analysis may not be treated as trading advice. RoboForex bears no responsibility for trading results based on trading recommendations and reviews contained herein.
By ForexTime FXTM’s USDInd ↑ 2% MTD Dollar best performing G10 currency MTD Geopolitical risk…
By JustMarkets The US stock market concluded Thursday’s session in the red as the escalating…
By Analytical Department RoboForex EUR/USD is holding near 1.1620 on Friday, with the US dollar…
By JustMarkets The US stock market rose on Wednesday. By the end of the day,…
By Daniele D'Alvia, Queen Mary University of London When a conflict escalates, financial markets respond…
By Analytical Department RoboForex GBP/USD contracted to 1.3350 on Thursday, with the pound remaining under…
This website uses cookies.