
By InvestMacro
Here are the latest charts and statistics for the Commitment of Traders (COT) reports data published by the Commodities Futures Trading Commission (CFTC).
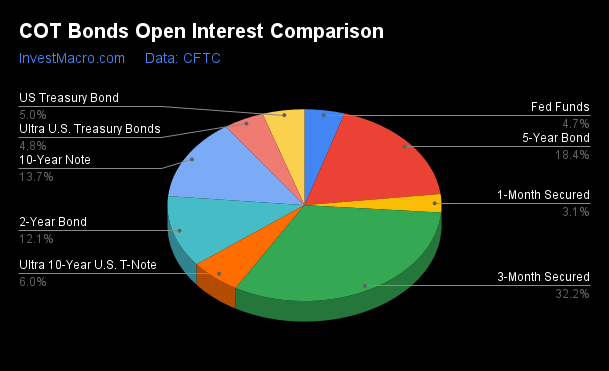
The latest COT data is updated through Tuesday September 3rd and shows a quick view of how large traders (for-profit speculators and commercial hedgers) were positioned in the futures markets.
Weekly Speculator Changes led by Fed Funds & SOFR 3-Months
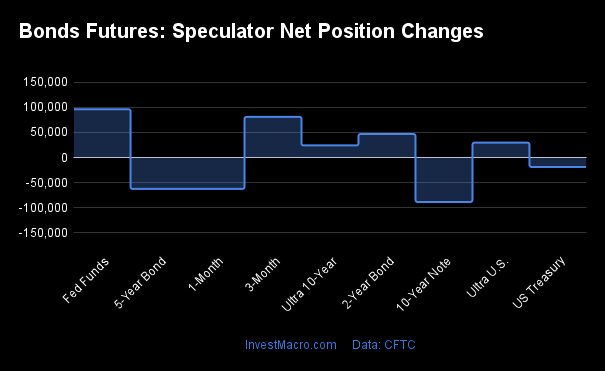
The COT bond market speculator bets were slightly higher this week as five out of the nine bond markets we cover had higher positioning while the other four markets had lower speculator contracts.
Free Reports:
 Get our Weekly Commitment of Traders Reports - See where the biggest traders (Hedge Funds and Commercial Hedgers) are positioned in the futures markets on a weekly basis.
 Download Our Metatrader 4 Indicators – Put Our Free MetaTrader 4 Custom Indicators on your charts when you join our Weekly Newsletter
Leading the gains for the bond markets was the Fed Funds (95,931 contracts) with the SOFR 3-Months (80,807 contracts), the 2-Year Bonds (46,648 contracts), the Ultra Treasury Bonds (29,496 contracts) and the Ultra 10-Year Bonds (24,032 contracts) also seeing positive weeks.
The bond markets with declines in speculator bets for the week were the 10-Year Bonds (-88,390 contracts), the SOFR 1-Month (-62,403 contracts), the 5-Year Bonds (-62,439 contracts) and with the US Treasury Bonds (-18,810 contracts) also registering lower bets on the week.
Bonds Net Speculators Leaderboard
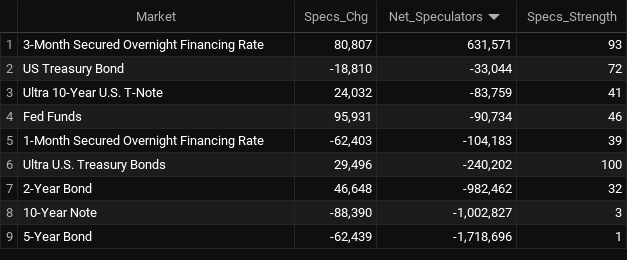
Legend: Weekly Speculators Change | Speculators Current Net Position | Speculators Strength Score compared to last 3-Years (0-100 range)
Strength Scores led by Ultra Treasury Bonds & SOFR 3-Months
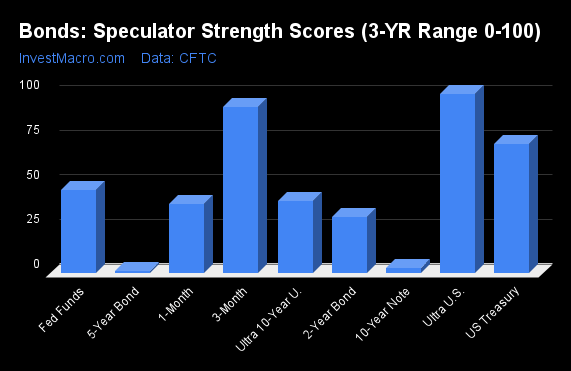
COT Strength Scores (a normalized measure of Speculator positions over a 3-Year range, from 0 to 100 where above 80 is Extreme-Bullish and below 20 is Extreme-Bearish) showed that the Ultra Treasury Bonds (100 percent) and the SOFR 3-Months (93 percent) lead the bond markets this week. The US Treasury Bonds (72 percent) comes in as the next highest in the weekly strength scores.
On the downside, the 5-Year Bonds (1 percent) and the 10-Year Bonds (3 percent) come in at the lowest strength level currently and are in Extreme-Bearish territory (below 20 percent).
Strength Statistics:
Fed Funds (46.3 percent) vs Fed Funds previous week (24.6 percent)
2-Year Bond (31.6 percent) vs 2-Year Bond previous week (28.6 percent)
5-Year Bond (1.1 percent) vs 5-Year Bond previous week (4.7 percent)
10-Year Bond (2.9 percent) vs 10-Year Bond previous week (10.1 percent)
Ultra 10-Year Bond (40.5 percent) vs Ultra 10-Year Bond previous week (35.5 percent)
US Treasury Bond (72.0 percent) vs US Treasury Bond previous week (78.5 percent)
Ultra US Treasury Bond (100.0 percent) vs Ultra US Treasury Bond previous week (86.4 percent)
SOFR 1-Month (38.8 percent) vs SOFR 1-Month previous week (55.3 percent)
SOFR 3-Months (92.9 percent) vs SOFR 3-Months previous week (88.7 percent)
Ultra Treasury Bonds top the 6-Week Strength Trends
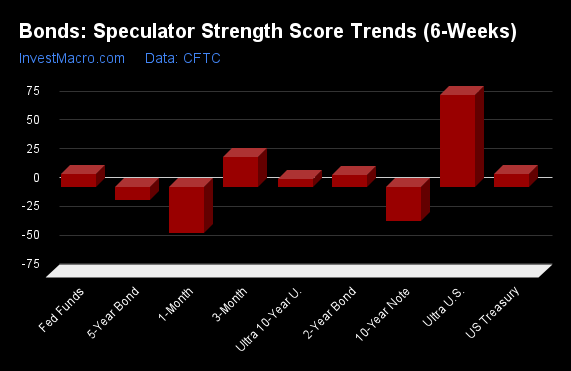
COT Strength Score Trends (or move index, calculates the 6-week changes in strength scores) showed that the Ultra Treasury Bonds (79 percent) leads the past six weeks trends for bonds. The SOFR 3-Months (26 percent) and the US Treasury Bonds (11 percent) are the next highest positive movers in the latest trends data.
The SOFR 1-Month (-40 percent), the 10-Year Bonds (-30 percent) and the 5-Year Bonds (-11 percent) lead the downside trend scores currently.
Strength Trend Statistics:
Fed Funds (10.5 percent) vs Fed Funds previous week (-22.9 percent)
2-Year Bond (10.2 percent) vs 2-Year Bond previous week (10.0 percent)
5-Year Bond (-11.4 percent) vs 5-Year Bond previous week (-4.7 percent)
10-Year Bond (-29.6 percent) vs 10-Year Bond previous week (-22.7 percent)
Ultra 10-Year Bond (6.6 percent) vs Ultra 10-Year Bond previous week (3.9 percent)
US Treasury Bond (10.8 percent) vs US Treasury Bond previous week (11.5 percent)
Ultra US Treasury Bond (79.1 percent) vs Ultra US Treasury Bond previous week (69.2 percent)
SOFR 1-Month (-40.3 percent) vs SOFR 1-Month previous week (-15.0 percent)
SOFR 3-Months (25.9 percent) vs SOFR 3-Months previous week (34.8 percent)
30-Day Federal Funds Futures:
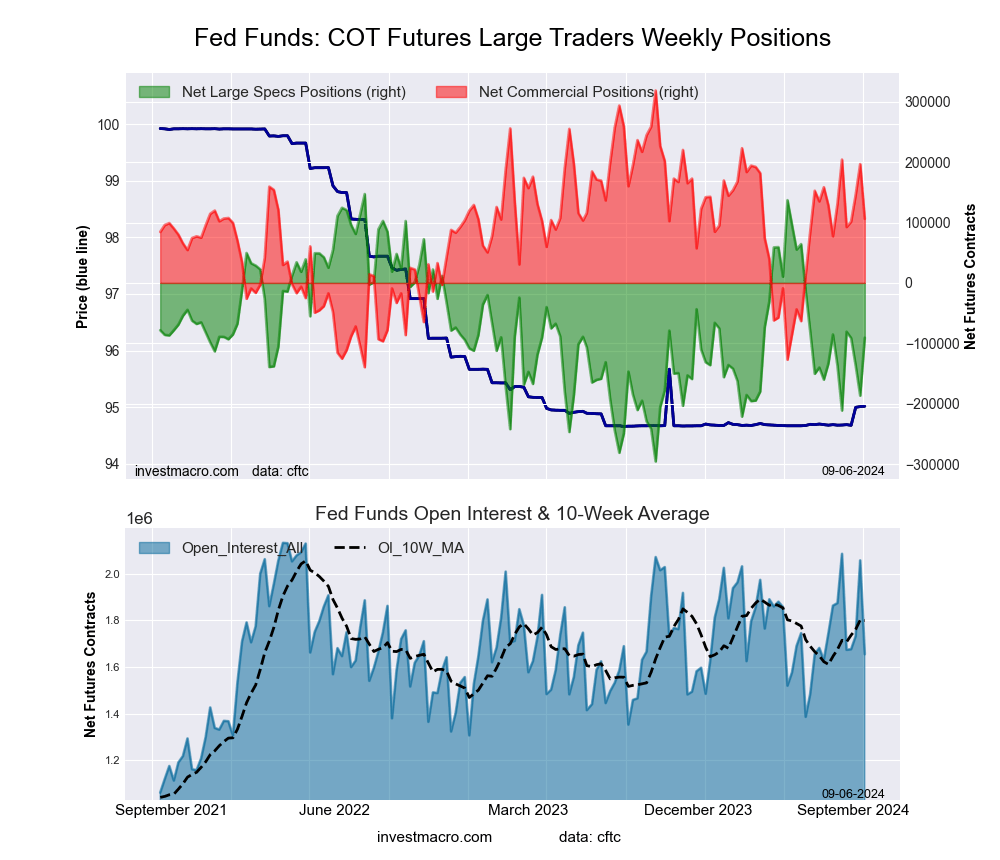 The 30-Day Federal Funds large speculator standing this week came in at a net position of -90,734 contracts in the data reported through Tuesday. This was a weekly lift of 95,931 contracts from the previous week which had a total of -186,665 net contracts.
This week’s current strength score (the trader positioning range over the past three years, measured from 0 to 100) shows the speculators are currently Bearish with a score of 46.3 percent. The commercials are Bullish with a score of 53.6 percent and the small traders (not shown in chart) are Bullish with a score of 56.8 percent.
Price Trend-Following Model: Downtrend
Our weekly trend-following model classifies the current market price position as: Downtrend. The current action for the model is considered to be: Hold – Maintain Short Position.
| 30-Day Federal Funds Statistics | SPECULATORS | COMMERCIALS | SMALL TRADERS |
| – Percent of Open Interest Longs: | 13.7 | 70.3 | 1.6 |
| – Percent of Open Interest Shorts: | 19.2 | 63.9 | 2.5 |
| – Net Position: | -90,734 | 106,172 | -15,438 |
| – Gross Longs: | 226,762 | 1,163,911 | 25,969 |
| – Gross Shorts: | 317,496 | 1,057,739 | 41,407 |
| – Long to Short Ratio: | 0.7 to 1 | 1.1 to 1 | 0.6 to 1 |
| NET POSITION TREND: | |||
| – Strength Index Score (3 Year Range Pct): | 46.3 | 53.6 | 56.8 |
| – Strength Index Reading (3 Year Range): | Bearish | Bullish | Bullish |
| NET POSITION MOVEMENT INDEX: | |||
| – 6-Week Change in Strength Index: | 10.5 | -5.5 | -39.0 |
Secured Overnight Financing Rate (3-Month) Futures:
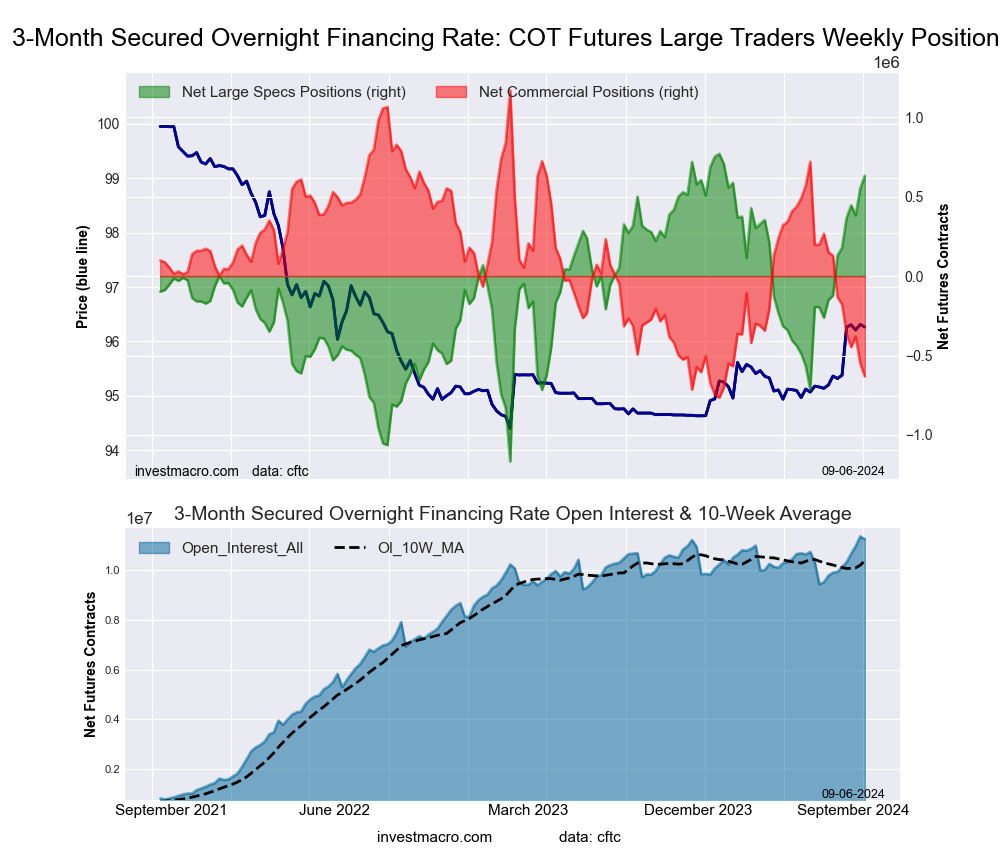 The Secured Overnight Financing Rate (3-Month) large speculator standing this week came in at a net position of 631,571 contracts in the data reported through Tuesday. This was a weekly boost of 80,807 contracts from the previous week which had a total of 550,764 net contracts.
This week’s current strength score (the trader positioning range over the past three years, measured from 0 to 100) shows the speculators are currently Bullish-Extreme with a score of 92.9 percent. The commercials are Bearish-Extreme with a score of 6.9 percent and the small traders (not shown in chart) are Bullish-Extreme with a score of 87.5 percent.
Price Trend-Following Model: Weak Uptrend
Our weekly trend-following model classifies the current market price position as: Weak Uptrend. The current action for the model is considered to be: Hold – Maintain Long Position.
| SOFR 3-Months Statistics | SPECULATORS | COMMERCIALS | SMALL TRADERS |
| – Percent of Open Interest Longs: | 17.4 | 53.8 | 0.4 |
| – Percent of Open Interest Shorts: | 11.8 | 59.4 | 0.5 |
| – Net Position: | 631,571 | -630,902 | -669 |
| – Gross Longs: | 1,960,048 | 6,047,347 | 50,527 |
| – Gross Shorts: | 1,328,477 | 6,678,249 | 51,196 |
| – Long to Short Ratio: | 1.5 to 1 | 0.9 to 1 | 1.0 to 1 |
| NET POSITION TREND: | |||
| – Strength Index Score (3 Year Range Pct): | 92.9 | 6.9 | 87.5 |
| – Strength Index Reading (3 Year Range): | Bullish-Extreme | Bearish-Extreme | Bullish-Extreme |
| NET POSITION MOVEMENT INDEX: | |||
| – 6-Week Change in Strength Index: | 25.9 | -25.8 | -1.0 |
Individual Bond Markets:
Secured Overnight Financing Rate (1-Month) Futures:
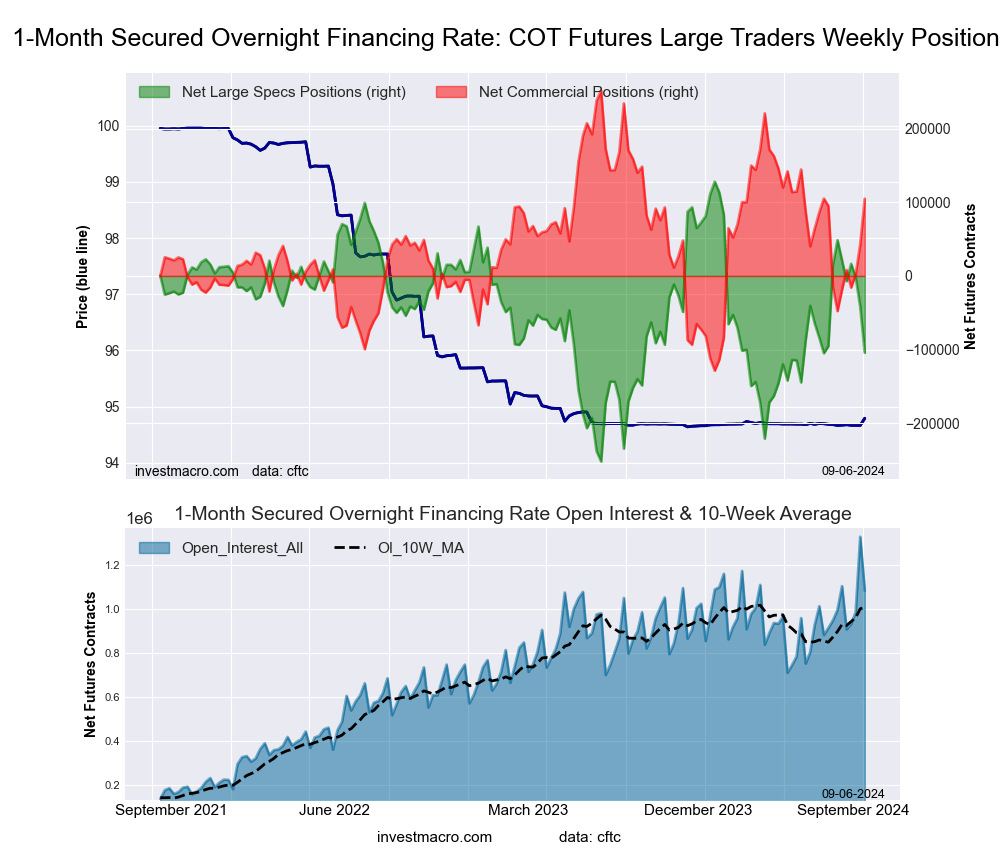 The Secured Overnight Financing Rate (1-Month) large speculator standing this week came in at a net position of -104,183 contracts in the data reported through Tuesday. This was a weekly decrease of -62,403 contracts from the previous week which had a total of -41,780 net contracts.
This week’s current strength score (the trader positioning range over the past three years, measured from 0 to 100) shows the speculators are currently Bearish with a score of 38.8 percent. The commercials are Bullish with a score of 61.4 percent and the small traders (not shown in chart) are Bullish with a score of 50.7 percent.
Price Trend-Following Model: Strong Uptrend
Our weekly trend-following model classifies the current market price position as: Strong Uptrend. The current action for the model is considered to be: New Buy – Long Position.
| SOFR 1-Month Statistics | SPECULATORS | COMMERCIALS | SMALL TRADERS |
| – Percent of Open Interest Longs: | 17.9 | 63.2 | 0.0 |
| – Percent of Open Interest Shorts: | 27.5 | 53.5 | 0.1 |
| – Net Position: | -104,183 | 104,828 | -645 |
| – Gross Longs: | 193,472 | 683,928 | 332 |
| – Gross Shorts: | 297,655 | 579,100 | 977 |
| – Long to Short Ratio: | 0.6 to 1 | 1.2 to 1 | 0.3 to 1 |
| NET POSITION TREND: | |||
| – Strength Index Score (3 Year Range Pct): | 38.8 | 61.4 | 50.7 |
| – Strength Index Reading (3 Year Range): | Bearish | Bullish | Bullish |
| NET POSITION MOVEMENT INDEX: | |||
| – 6-Week Change in Strength Index: | -40.3 | 40.1 | 2.8 |
2-Year Treasury Note Futures:
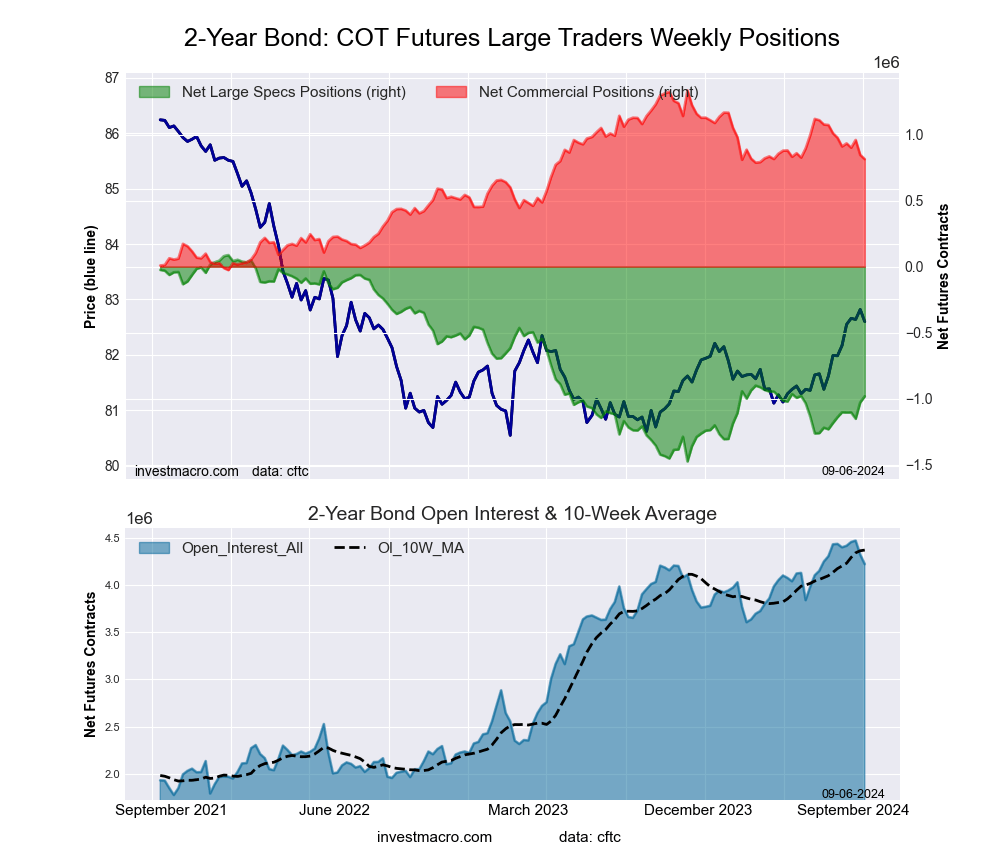 The 2-Year Treasury Note large speculator standing this week came in at a net position of -982,462 contracts in the data reported through Tuesday. This was a weekly increase of 46,648 contracts from the previous week which had a total of -1,029,110 net contracts.
This week’s current strength score (the trader positioning range over the past three years, measured from 0 to 100) shows the speculators are currently Bearish with a score of 31.6 percent. The commercials are Bullish with a score of 61.8 percent and the small traders (not shown in chart) are Bullish-Extreme with a score of 89.0 percent.
Price Trend-Following Model: Strong Uptrend
Our weekly trend-following model classifies the current market price position as: Strong Uptrend. The current action for the model is considered to be: Hold – Maintain Long Position.
| 2-Year Treasury Note Statistics | SPECULATORS | COMMERCIALS | SMALL TRADERS |
| – Percent of Open Interest Longs: | 14.5 | 77.2 | 6.4 |
| – Percent of Open Interest Shorts: | 37.8 | 57.9 | 2.5 |
| – Net Position: | -982,462 | 814,688 | 167,774 |
| – Gross Longs: | 614,392 | 3,261,747 | 272,379 |
| – Gross Shorts: | 1,596,854 | 2,447,059 | 104,605 |
| – Long to Short Ratio: | 0.4 to 1 | 1.3 to 1 | 2.6 to 1 |
| NET POSITION TREND: | |||
| – Strength Index Score (3 Year Range Pct): | 31.6 | 61.8 | 89.0 |
| – Strength Index Reading (3 Year Range): | Bearish | Bullish | Bullish-Extreme |
| NET POSITION MOVEMENT INDEX: | |||
| – 6-Week Change in Strength Index: | 10.2 | -11.9 | 1.0 |
5-Year Treasury Note Futures:
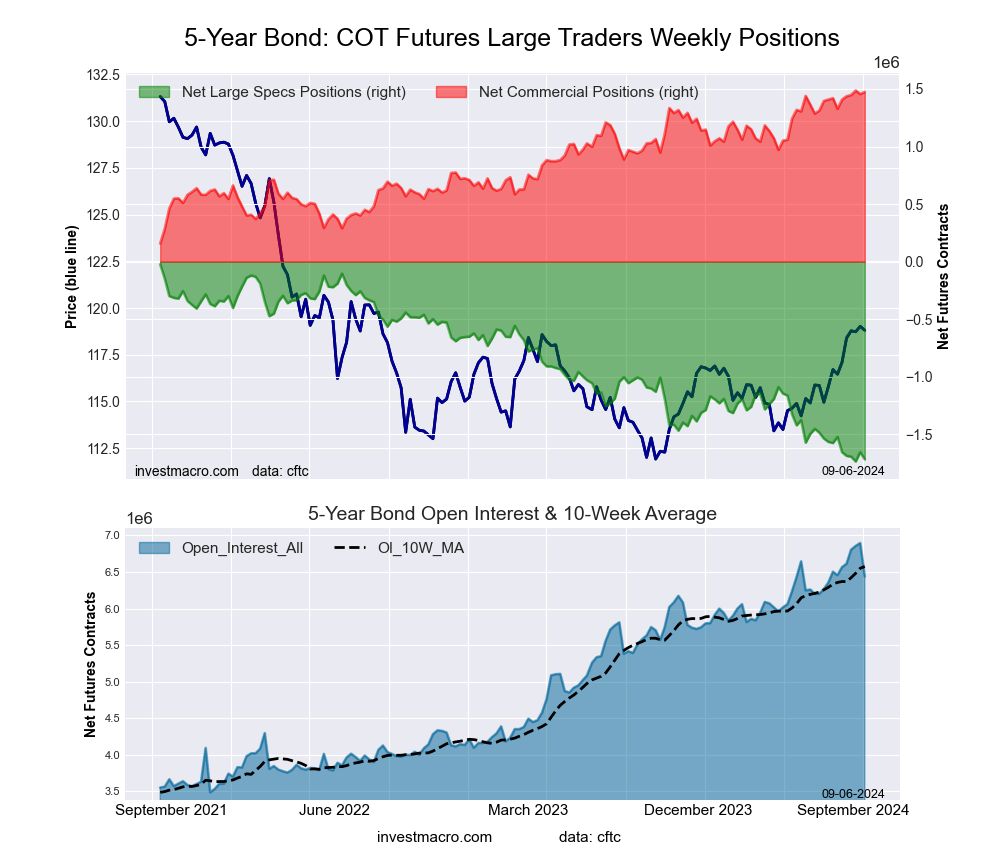 The 5-Year Treasury Note large speculator standing this week came in at a net position of -1,718,696 contracts in the data reported through Tuesday. This was a weekly fall of -62,439 contracts from the previous week which had a total of -1,656,257 net contracts.
This week’s current strength score (the trader positioning range over the past three years, measured from 0 to 100) shows the speculators are currently Bearish-Extreme with a score of 1.1 percent. The commercials are Bullish-Extreme with a score of 99.1 percent and the small traders (not shown in chart) are Bullish-Extreme with a score of 98.7 percent.
Price Trend-Following Model: Strong Uptrend
Our weekly trend-following model classifies the current market price position as: Strong Uptrend. The current action for the model is considered to be: Hold – Maintain Long Position.
| 5-Year Treasury Note Statistics | SPECULATORS | COMMERCIALS | SMALL TRADERS |
| – Percent of Open Interest Longs: | 8.5 | 83.0 | 7.4 |
| – Percent of Open Interest Shorts: | 35.2 | 60.1 | 3.7 |
| – Net Position: | -1,718,696 | 1,475,139 | 243,557 |
| – Gross Longs: | 548,634 | 5,348,029 | 478,777 |
| – Gross Shorts: | 2,267,330 | 3,872,890 | 235,220 |
| – Long to Short Ratio: | 0.2 to 1 | 1.4 to 1 | 2.0 to 1 |
| NET POSITION TREND: | |||
| – Strength Index Score (3 Year Range Pct): | 1.1 | 99.1 | 98.7 |
| – Strength Index Reading (3 Year Range): | Bearish-Extreme | Bullish-Extreme | Bullish-Extreme |
| NET POSITION MOVEMENT INDEX: | |||
| – 6-Week Change in Strength Index: | -11.4 | 11.1 | 8.7 |
10-Year Treasury Note Futures:
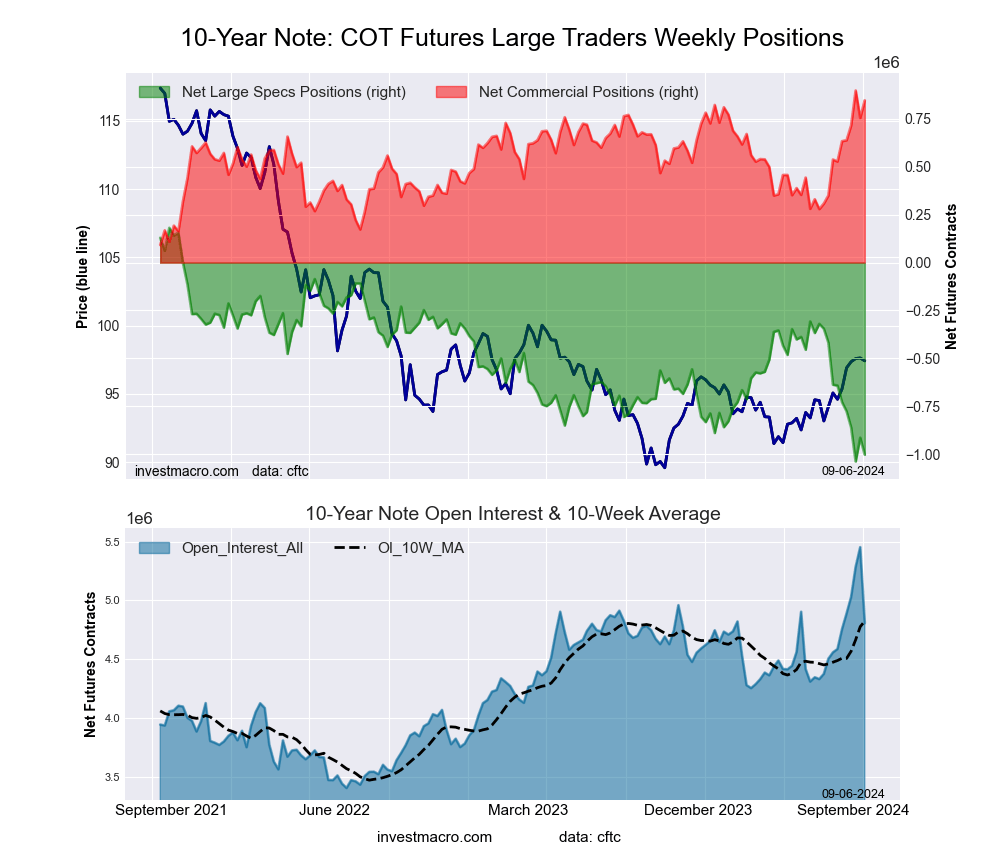 The 10-Year Treasury Note large speculator standing this week came in at a net position of -1,002,827 contracts in the data reported through Tuesday. This was a weekly lowering of -88,390 contracts from the previous week which had a total of -914,437 net contracts.
This week’s current strength score (the trader positioning range over the past three years, measured from 0 to 100) shows the speculators are currently Bearish-Extreme with a score of 2.9 percent. The commercials are Bullish-Extreme with a score of 93.6 percent and the small traders (not shown in chart) are Bullish-Extreme with a score of 99.3 percent.
Price Trend-Following Model: Strong Uptrend
Our weekly trend-following model classifies the current market price position as: Strong Uptrend. The current action for the model is considered to be: Hold – Maintain Long Position.
| 10-Year Treasury Note Statistics | SPECULATORS | COMMERCIALS | SMALL TRADERS |
| – Percent of Open Interest Longs: | 9.0 | 78.7 | 10.3 |
| – Percent of Open Interest Shorts: | 29.8 | 61.1 | 7.0 |
| – Net Position: | -1,002,827 | 846,839 | 155,988 |
| – Gross Longs: | 430,206 | 3,782,720 | 494,696 |
| – Gross Shorts: | 1,433,033 | 2,935,881 | 338,708 |
| – Long to Short Ratio: | 0.3 to 1 | 1.3 to 1 | 1.5 to 1 |
| NET POSITION TREND: | |||
| – Strength Index Score (3 Year Range Pct): | 2.9 | 93.6 | 99.3 |
| – Strength Index Reading (3 Year Range): | Bearish-Extreme | Bullish-Extreme | Bullish-Extreme |
| NET POSITION MOVEMENT INDEX: | |||
| – 6-Week Change in Strength Index: | -29.6 | 39.6 | 8.4 |
Ultra 10-Year Notes Futures:
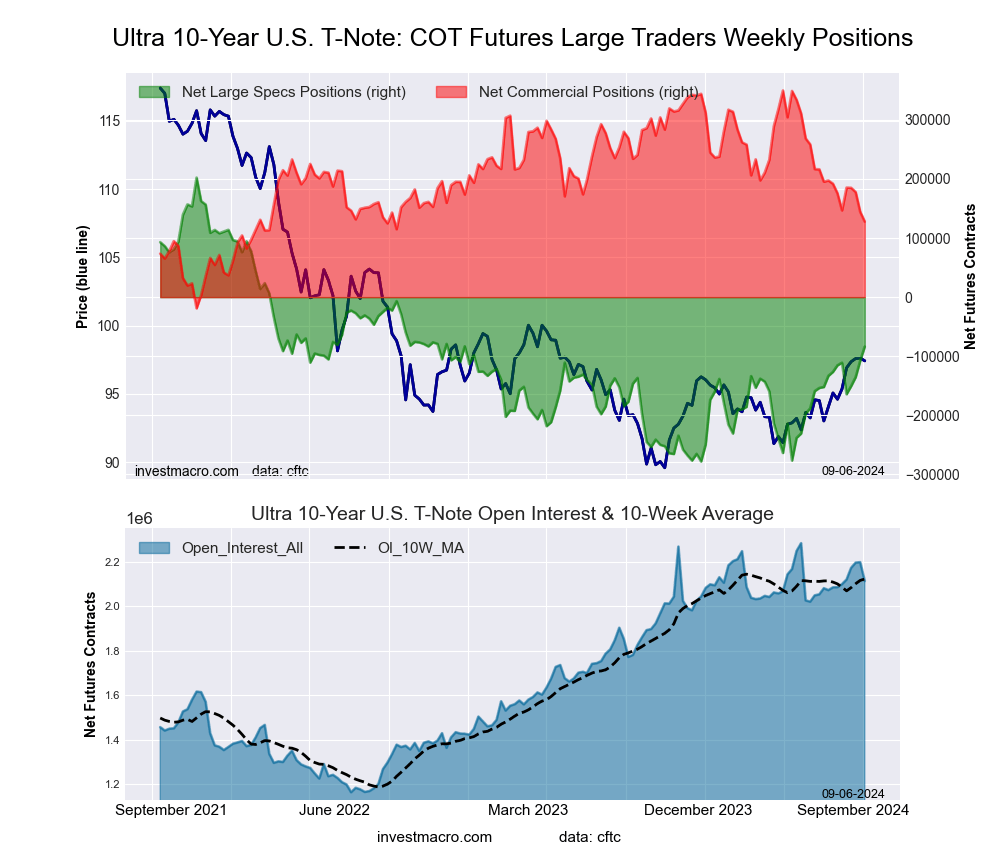 The Ultra 10-Year Notes large speculator standing this week came in at a net position of -83,759 contracts in the data reported through Tuesday. This was a weekly gain of 24,032 contracts from the previous week which had a total of -107,791 net contracts.
This week’s current strength score (the trader positioning range over the past three years, measured from 0 to 100) shows the speculators are currently Bearish with a score of 40.5 percent. The commercials are Bearish with a score of 39.8 percent and the small traders (not shown in chart) are Bullish-Extreme with a score of 86.5 percent.
Price Trend-Following Model: Weak Uptrend
Our weekly trend-following model classifies the current market price position as: Weak Uptrend. The current action for the model is considered to be: Hold – Maintain Long Position.
| Ultra 10-Year Notes Statistics | SPECULATORS | COMMERCIALS | SMALL TRADERS |
| – Percent of Open Interest Longs: | 13.6 | 75.2 | 10.2 |
| – Percent of Open Interest Shorts: | 17.6 | 69.1 | 12.3 |
| – Net Position: | -83,759 | 127,871 | -44,112 |
| – Gross Longs: | 287,562 | 1,588,757 | 216,022 |
| – Gross Shorts: | 371,321 | 1,460,886 | 260,134 |
| – Long to Short Ratio: | 0.8 to 1 | 1.1 to 1 | 0.8 to 1 |
| NET POSITION TREND: | |||
| – Strength Index Score (3 Year Range Pct): | 40.5 | 39.8 | 86.5 |
| – Strength Index Reading (3 Year Range): | Bearish | Bearish | Bullish-Extreme |
| NET POSITION MOVEMENT INDEX: | |||
| – 6-Week Change in Strength Index: | 6.6 | -13.0 | 9.4 |
US Treasury Bonds Futures:
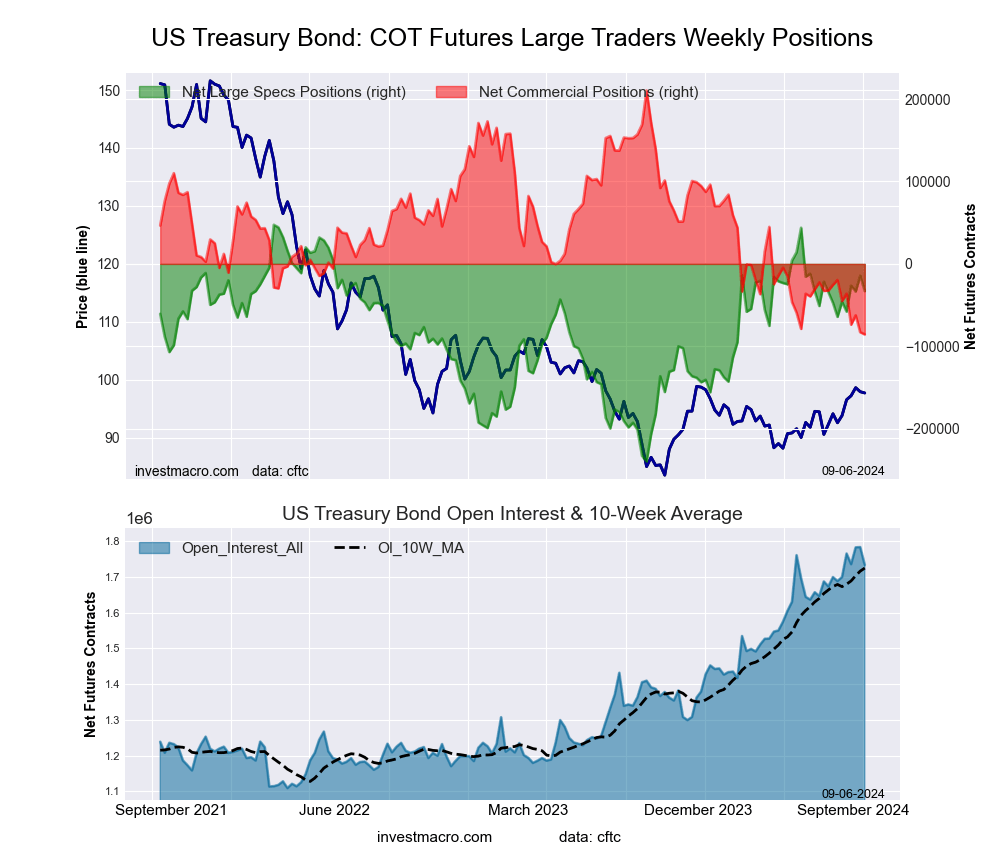 The US Treasury Bonds large speculator standing this week came in at a net position of -33,044 contracts in the data reported through Tuesday. This was a weekly reduction of -18,810 contracts from the previous week which had a total of -14,234 net contracts.
This week’s current strength score (the trader positioning range over the past three years, measured from 0 to 100) shows the speculators are currently Bullish with a score of 72.0 percent. The commercials are Bearish-Extreme with a score of 0.0 percent and the small traders (not shown in chart) are Bullish-Extreme with a score of 100.0 percent.
Price Trend-Following Model: Strong Uptrend
Our weekly trend-following model classifies the current market price position as: Strong Uptrend. The current action for the model is considered to be: Hold – Maintain Long Position.
| US Treasury Bonds Statistics | SPECULATORS | COMMERCIALS | SMALL TRADERS |
| – Percent of Open Interest Longs: | 20.2 | 63.0 | 14.1 |
| – Percent of Open Interest Shorts: | 22.1 | 68.0 | 7.3 |
| – Net Position: | -33,044 | -85,532 | 118,576 |
| – Gross Longs: | 350,527 | 1,092,273 | 244,254 |
| – Gross Shorts: | 383,571 | 1,177,805 | 125,678 |
| – Long to Short Ratio: | 0.9 to 1 | 0.9 to 1 | 1.9 to 1 |
| NET POSITION TREND: | |||
| – Strength Index Score (3 Year Range Pct): | 72.0 | 0.0 | 100.0 |
| – Strength Index Reading (3 Year Range): | Bullish | Bearish-Extreme | Bullish-Extreme |
| NET POSITION MOVEMENT INDEX: | |||
| – 6-Week Change in Strength Index: | 10.8 | -22.3 | 23.7 |
Ultra US Treasury Bonds Futures:
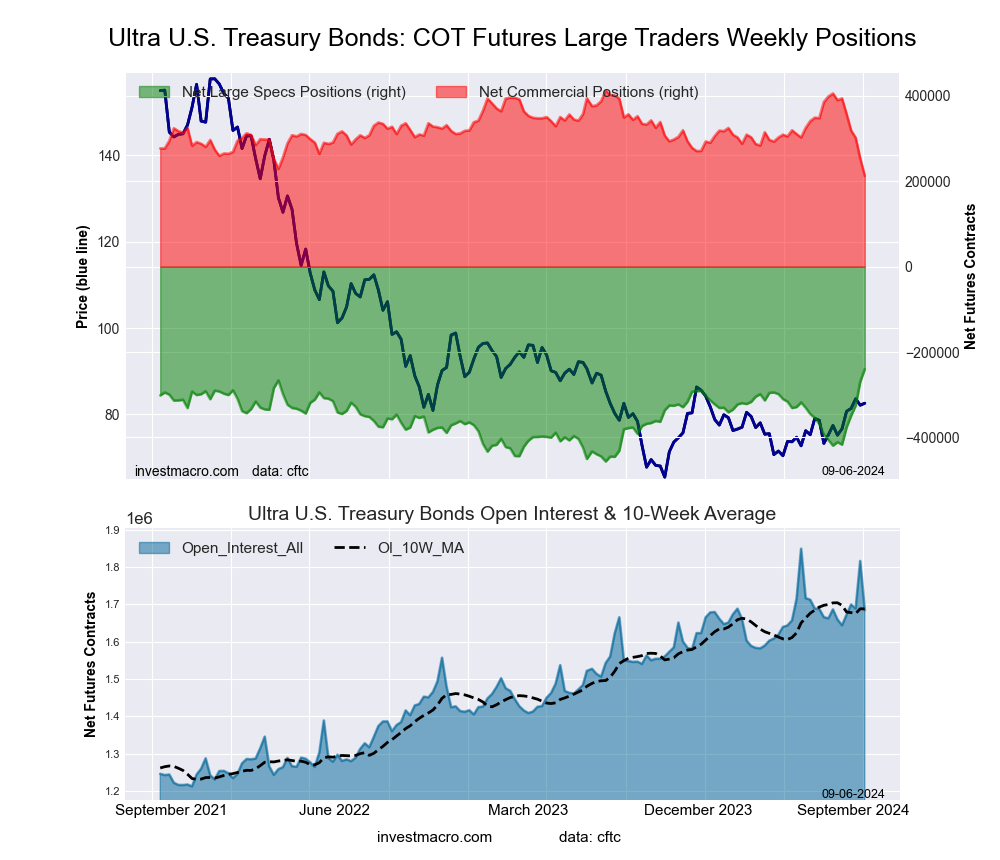 The Ultra US Treasury Bonds large speculator standing this week came in at a net position of -240,202 contracts in the data reported through Tuesday. This was a weekly rise of 29,496 contracts from the previous week which had a total of -269,698 net contracts.
This week’s current strength score (the trader positioning range over the past three years, measured from 0 to 100) shows the speculators are currently Bullish-Extreme with a score of 100.0 percent. The commercials are Bearish-Extreme with a score of 0.0 percent and the small traders (not shown in chart) are Bearish with a score of 49.2 percent.
Price Trend-Following Model: Strong Uptrend
Our weekly trend-following model classifies the current market price position as: Strong Uptrend. The current action for the model is considered to be: Hold – Maintain Long Position.
| Ultra US Treasury Bonds Statistics | SPECULATORS | COMMERCIALS | SMALL TRADERS |
| – Percent of Open Interest Longs: | 9.5 | 78.4 | 11.1 |
| – Percent of Open Interest Shorts: | 23.7 | 65.7 | 9.5 |
| – Net Position: | -240,202 | 212,830 | 27,372 |
| – Gross Longs: | 159,543 | 1,320,086 | 187,073 |
| – Gross Shorts: | 399,745 | 1,107,256 | 159,701 |
| – Long to Short Ratio: | 0.4 to 1 | 1.2 to 1 | 1.2 to 1 |
| NET POSITION TREND: | |||
| – Strength Index Score (3 Year Range Pct): | 100.0 | 0.0 | 49.2 |
| – Strength Index Reading (3 Year Range): | Bullish-Extreme | Bearish-Extreme | Bearish |
| NET POSITION MOVEMENT INDEX: | |||
| – 6-Week Change in Strength Index: | 79.1 | -88.7 | 8.0 |
Article By InvestMacro – Receive our weekly COT Newsletter
*COT Report: The COT data, released weekly to the public each Friday, is updated through the most recent Tuesday (data is 3 days old) and shows a quick view of how large speculators or non-commercials (for-profit traders) were positioned in the futures markets.
The CFTC categorizes trader positions according to commercial hedgers (traders who use futures contracts for hedging as part of the business), non-commercials (large traders who speculate to realize trading profits) and nonreportable traders (usually small traders/speculators) as well as their open interest (contracts open in the market at time of reporting). See CFTC criteria here.

- Investors run to safe-haven assets amid Middle East escalation Mar 6, 2026
- EUR/USD Under Pressure: Middle East Risks Outweigh All Else Mar 6, 2026
- Bitcoin shows resilience to Middle East events. Oil market stabilizes Mar 5, 2026
- GBP/USD: Market Not Expecting BoE Rate Cut in March Mar 5, 2026
- Brent headed for $100? Mar 4, 2026
- Global stock indices continue sell-off due to Middle East conflict Mar 4, 2026
- USD/JPY to Quickly Return to Growth: Momentum Favours the US Dollar Mar 4, 2026
- European equities plunge amid Persian Gulf military conflict Mar 3, 2026
- Gold Rallies for Fifth Day, With External Risks Mounting Mar 3, 2026
- Iran Crisis: A Dangerous Turning Point Mar 2, 2026