By RoboForex Analytical Department
The USD/JPY pair is hovering around 155.00 on Monday, having earlier touched a new 34-year peak at 160.00. Market rumours suggest that the Japanese authorities might have intervened in the currency market, although there has been no official confirmation. Today’s market movement is particularly notable due to a public holiday in Japan, which has resulted in minimal market liquidity. This scenario made it relatively easy for investors to prompt significant changes in the quotes.
Last week, the Bank of Japan (BoJ) maintained its monetary policy foundation, keeping the interest rate steady at 0-0.1% per annum. Market participants were left disappointed, as they had anticipated a more pronounced reaction from the BoJ.
The primary driver of the yen’s ongoing weakness is the significant discrepancy between the interest rates set by the BoJ and the US Federal Reserve. This interest rate gap exerts substantial pressure on the yen, making any actual intervention largely ineffective. The BoJ, aware of this reality, has thus far limited its actions to verbal interventions to influence the yen’s value.
Technical analysis of USD/JPY
Free Reports:
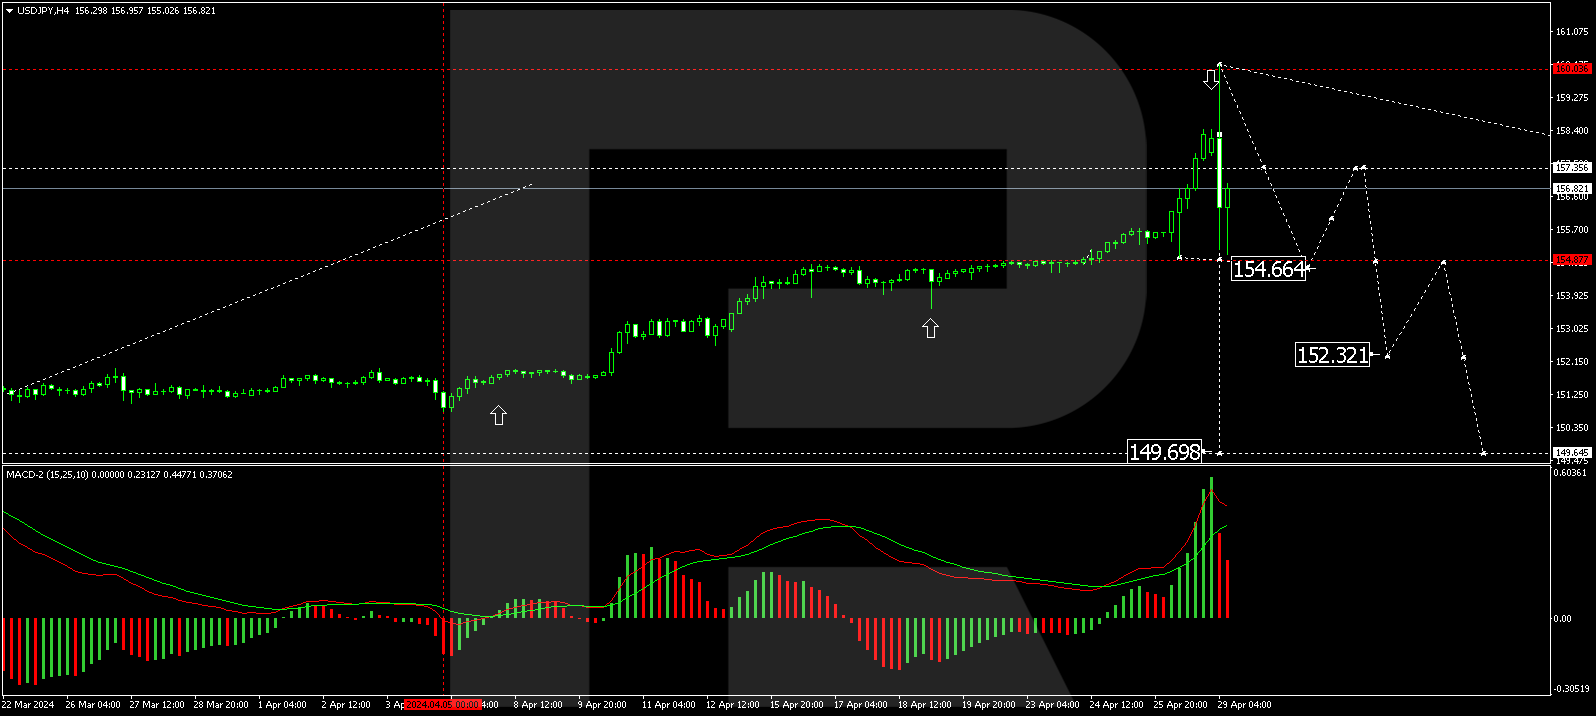
On the H4 chart of USD/JPY, a growth wave reaching the level of 160.16 was realised. The structure of the first impulse of decline to 154.70 is currently forming. Once this level is reached, a correction to 157.35 (testing from below) is anticipated, potentially followed by a new wave of decline towards 152.32, with the prospect of continuing the trend to 149.65. This scenario is technically supported by the MACD oscillator, which is positioned above zero at the highs but is expected to decline to new lows.
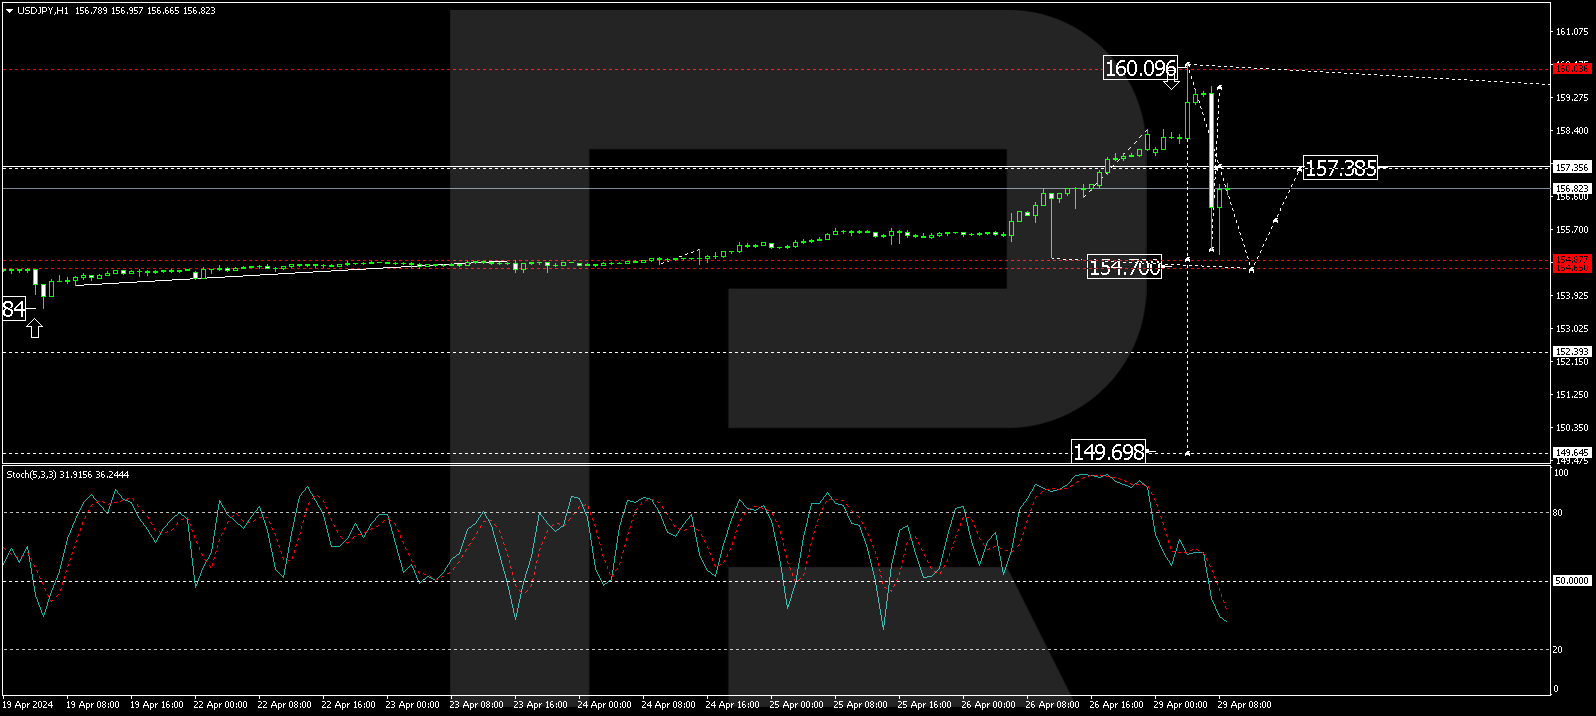
On the H1 chart, the upward growth wave to 160.16 has been completed. We are now observing the formation of the first impulse of the decline wave. The local target of this downside impulse at 155.15 has been achieved. We anticipate a corrective move to 157.35 (testing from below). Subsequently, the next phase of the downward trend to 154.65 is expected, which is the primary target. After completing this, a correction back to 157.35 may be considered. The Stochastic oscillator confirms this bearish outlook, with its signal line below 50 and pointing strictly downwards.
Disclaimer
Any forecasts contained herein are based on the author’s particular opinion. This analysis may not be treated as trading advice. RoboForex bears no responsibility for trading results based on trading recommendations and reviews contained herein.
By ForexTime FXTM’s USDInd ↑ 2% MTD Dollar best performing G10 currency MTD Geopolitical risk…
By JustMarkets The US stock market concluded Thursday’s session in the red as the escalating…
By Analytical Department RoboForex EUR/USD is holding near 1.1620 on Friday, with the US dollar…
By JustMarkets The US stock market rose on Wednesday. By the end of the day,…
By Daniele D'Alvia, Queen Mary University of London When a conflict escalates, financial markets respond…
By Analytical Department RoboForex GBP/USD contracted to 1.3350 on Thursday, with the pound remaining under…
This website uses cookies.